

AEM
#162
Agnico Eagle Mines Limited Common Stock
204.8 1 USD
-0.01%
Market Price
Sector: Basic Materials
Base: USD
Profit Currency: USD
Daily Range
Year Range
Daily Change
-1.20%
Monthly Change
+25.31%
6 month change
-5.59%
Year Change
+32.67%
Previous Close
207.2 9
Open
204.5 8
Low
204.3 1
High
205.4 8
Volume
668
Financials
Value Q4, 25 TTM
News
Barrick Mining Trading at a Discount: Should You Buy the Stock Now?
Is AngloGold Ashanti Set for Strong EBITDA Growth in H2'26?
Wall Street Bulls Look Optimistic About Agnico (AEM): Should You Buy?
Barrick Mining's Q2 Gold Production Rises: Will It Continue in Q3?
Can Kinross Gold's Strong Liquidity Fuel Future Growth and Returns?
Can AEM's Debt-Light Balance Sheet Create Room for Further Growth?
Gold Jumps 10% in August — This Billionaire Gold Bug Is Banking Gains - SPDR Gold Shares (ARCA:GLD), Nova
Why Is Agnico (AEM) Up 42.9% Since Last Earnings Report?
Can AngloGold Ashanti Sustain Its Solid Y/Y Revenue Growth in H2?
Gold Miner Newmont Eclipses Gold's Rally Thanks To A Dual Growth Engine
Agnico Eagle Stock Rapidly Approaches Buy Point Amid Gold Rally
Charts & Ideas
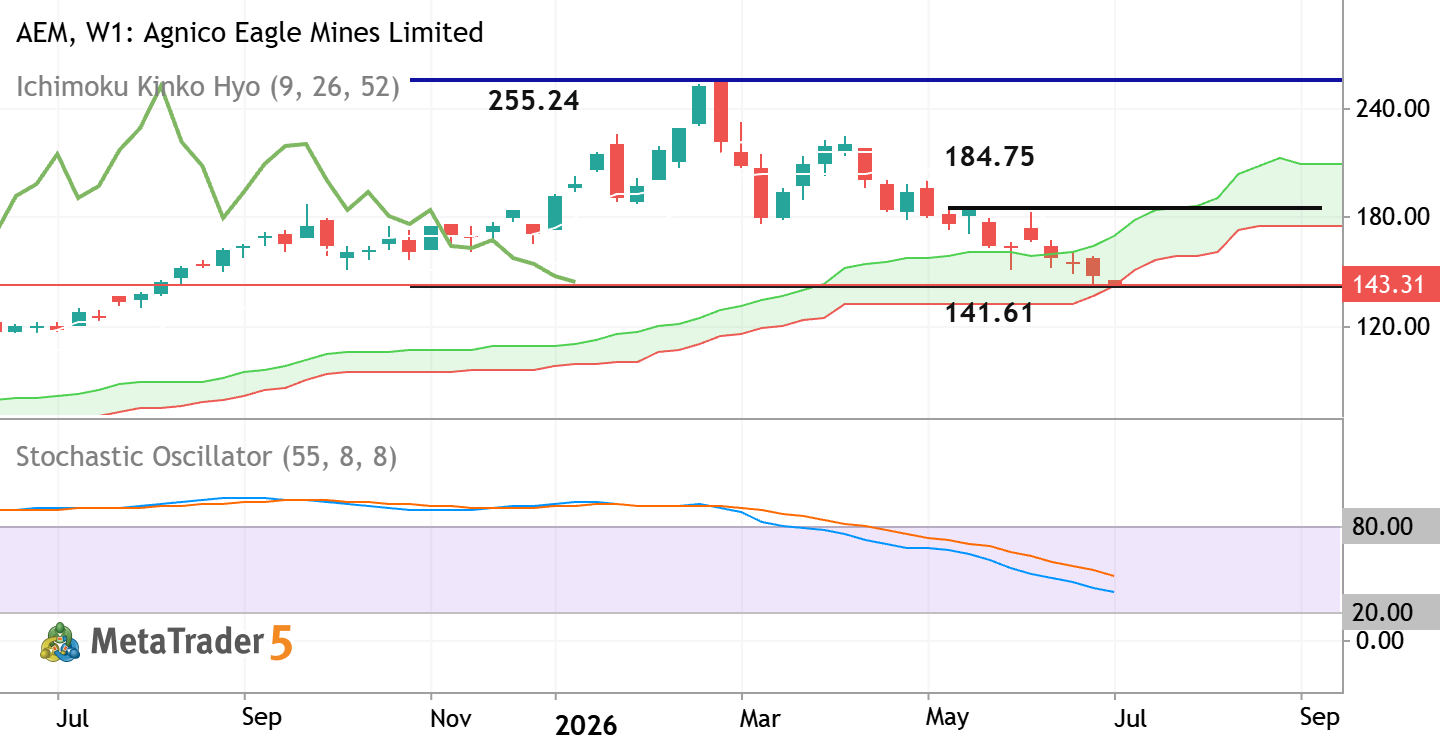
AEM - Long-Term Technical Forecast
Weekly price is breaking the Ichimoku cloud to below for the possible weekly bearish reversal. Chinkou Spam line of Ichimoku indicator crossed the historical price for the strong breakdown to be started, and Stochastic oscillator is showing the downtrend in the near future as well for example. If the price breaks support level at 141.61 to below so the primary weekly bearish reversal will be started. If the price crosses resistance at 184.75 to above together with 255.24 as a good terget to re-enter so the weekly bullish trend will be resumed. Alternatively, the price will be on secondary ranging within s/r channel to be near and inside Ichimoku cloud waiting for the direction of the strong trend to be started. Trading Summary : possible breakdown with the primary weekly bearish reversal


The AEM doesn’t have other trading ideas at this time
Browse ready-made trading ideas or select a symbol and create your own
Go to Charts and Trading Ideas