

INVH
#650
Invitation Homes Inc. Common Stock
29.0 6 USD
-0.01%
Market Price
Sector: Real Estate
Base: USD
Profit Currency: USD
Daily Range
Year Range
Daily Change
-0.65%
Monthly Change
-3.04%
6 month change
+10.70%
Year Change
-6.35%
Previous Close
29.2 5
Open
29.0 9
Low
29.0 1
High
29.1 7
Volume
689
Financials
Value Q1, 25Q2, 25Q3, 25Q4, 25Q1, 26Q2, 26 TTM
News
Why Is Invitation Home (INVH) Down 1.5% Since Last Earnings Report?
Rates Retake The Spotlight
Winners Of REIT Earnings Season
A Hawkish Hold, A Steeper Curve
The Case For REITs In 2H 2026
Do Wall Street Analysts Like Invitation Homes Stock?
Invitation Homes Inc. (INVH) Q2 2026 Earnings Call Transcript
INVH Q2 FFO Beats Estimates on NOI Growth, Revenues Top, '26 View Up
Invitation Home (INVH) Q2 Earnings: Taking a Look at Key Metrics Versus Estimates
Invitation Home (INVH) Q2 FFO and Revenues Beat Estimates
All You Need to Know About Invitation Home (INVH) Rating Upgrade to Buy
Charts & Ideas
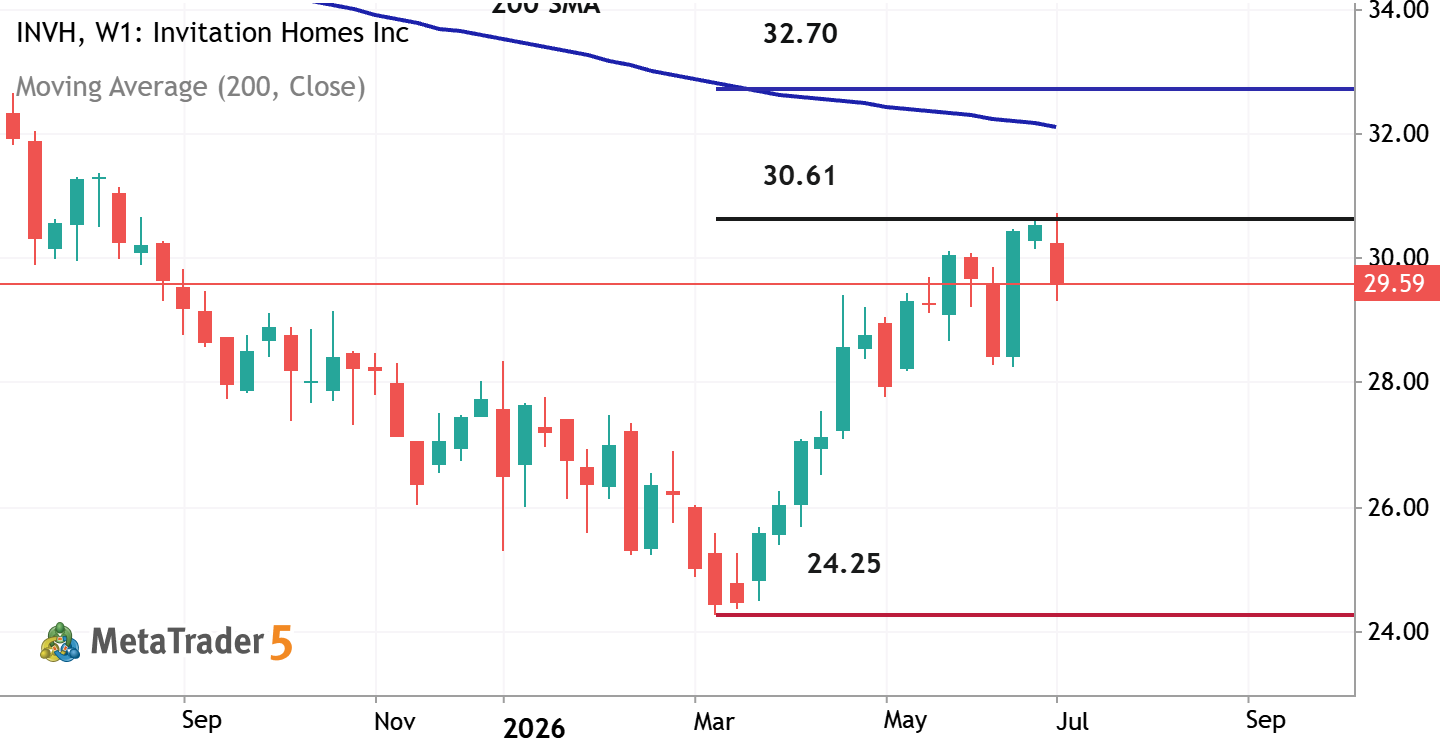
INVH - Long-Term Forecast
Weekly price is located below 200 SMA in the bearish area of the chart. The price was on bear market rally but it was bounced from resistance level at 30.61 to below for the bearish trend to be resumed. If the price breaks 30.61 resistance together with 200 SMA to above so the weekly bullish reversal will be started with 32.70 level as the possible target to re-enter. If the price crosses support level at 24.25 to below so the strong bearish trend will be continuing. Alternatively, the price will be on secondary ranging within the primary bearish trend to be within 24.25/30.61 s/r channel waiting for direction. Trading Summary : ranging to be near and below 200 waiting for direction


The INVH doesn’t have other trading ideas at this time
Browse ready-made trading ideas or select a symbol and create your own
Go to Charts and Trading Ideas