

XOM
#18
ExxonMobil Holdings Corporation Common Stock
163.6 4 USD
-0.01%
Market Price
Sector: Energy
Base: USD
Profit Currency: USD
Daily Range
Year Range
Daily Change
-0.56%
Monthly Change
+6.63%
6 month change
+5.28%
Year Change
+43.71%
Previous Close
164.5 6
Open
163.0 6
Low
163.0 4
High
163.9 0
Volume
1 283
Financials
No data
News
Future Possibilities When The Strategic Petroleum Reserve Runs Out (SP500)
S&P 500 Top Stock Gainers Today, 9/1/26 - TipRanks.com
Energy ETFs to Watch as US-Venezuela Sign Historic Oil Deal
3 ETFs with 10%+ Upside for Exposure to Finance, Health, and Energy, According to AI Analyst - TipRanks.com
Hormuz Escalation Pays Refiners And Tankers Again (NYSEARCA:XLE)
Wall St futures kick off September under pressure as yields, oil prices rise
Stock Market News for Sep 1, 2026
Venezuela Will Refill America's Oil Reserves (SPX)
Stocks Finish Mostly Lower as Rising Crude Boosts Bond Yields
S&P 500 Top Stock Gainers Today, 8/31/26 - TipRanks.com
What's Going on with ExxonMobil Shares on Monday? - ExxonMobil Holdings (NYSE:XOM)
Charts & Ideas
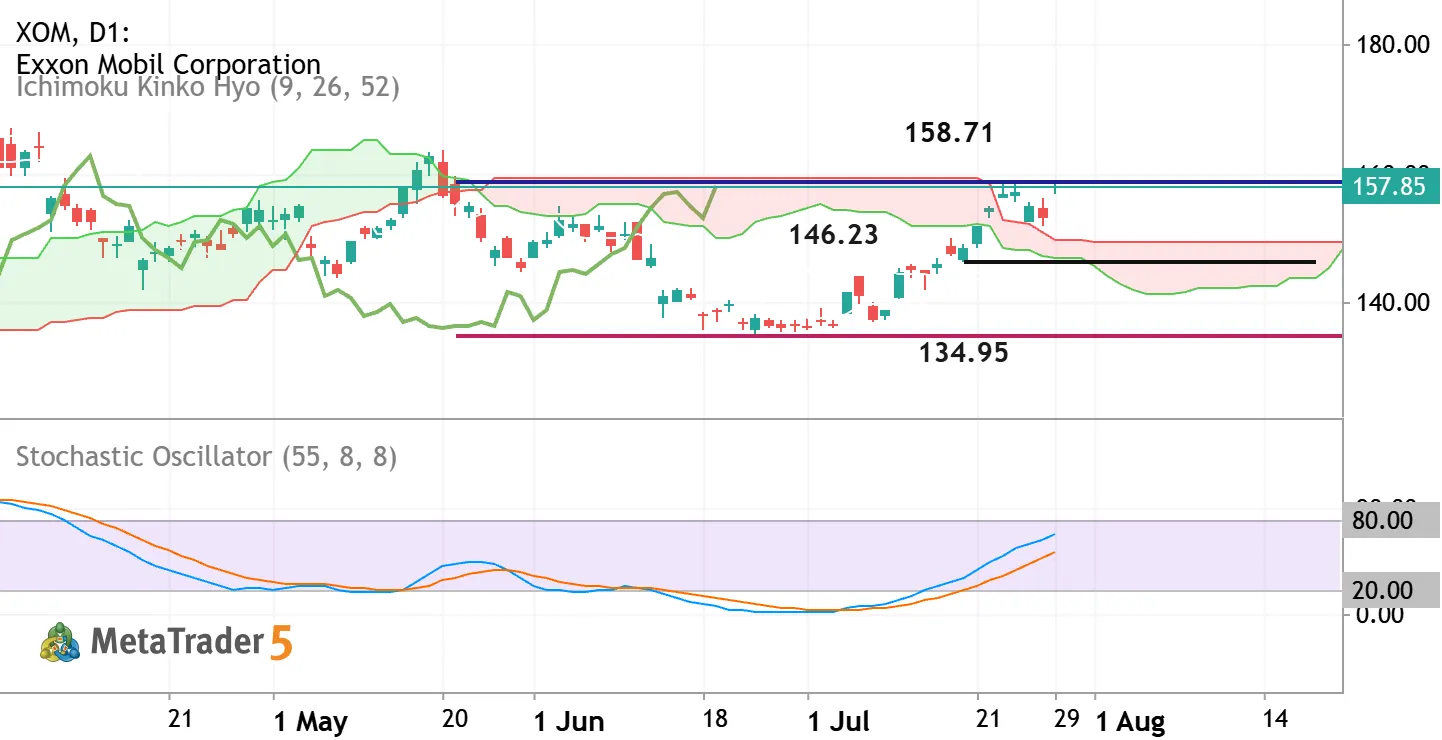
XOM - Daily Trading Forecast
The daily price is located near and above Ichimoku cloud in the bullish area of the chart: Chinkou Span line of Ichimoku indicator already broke the historical price to above for the good breakout to be started, and the price crosses the Ichimoku cloud to above as well for the daily primary bullush reversal. If the price breaks resistance level at 158.71 so the strong bullish trend may be continuing. If the price crosses support level at 146.23 to 134.95 as the nearest possible target so primary bearish trend will be resumed. Alternatively, the price will be on secondary ranging to be near and inside Ichimoku cloud and within s/r channel waiting for direction of the strong trend to be started. Trading Summary : breakout with the possible daily bullish reversal


The XOM doesn’t have other trading ideas at this time
Browse ready-made trading ideas or select a symbol and create your own
Go to Charts and Trading Ideas