Diego Vinicius Righetti Sa
Knowledge, Research, and Technology for the Financial Market
Frequência do Mercado was born from a passion for understanding financial markets and transforming complex knowledge into content that is accessible, practical, and grounded in evidence.
Founded by Diego Vinicius Righetti Sá (Vini Righetti), an investor, data analyst, and quantitative finance enthusiast, the platform emerged after years of study, research, and development of methods focused on investment analysis, risk management, applied statistics, and financial market technology.
The idea came from a simple need: to find content that went beyond superficial opinions and truly helped investors and traders understand markets more deeply, using data, methodology, and critical thinking.
Our Mission
To help people develop a stronger understanding of financial markets through education, research, and evidence-based analysis.
We believe that better decisions are built through knowledge, discipline, and the ability to interpret information with clarity.
What We Do
Frequência do Mercado brings together content and projects across several areas of the financial universe:
Financial Education
Market Analysis
Technical Analysis
Quantitative Finance
Data Science Applied to Finance
Risk Management
Systematic Trading
Trading Automation and Programming
Python Applied to Financial Markets
Cryptocurrencies and Digital Assets
In addition to producing articles, studies, and educational materials, we develop indicators, analytical tools, and technological projects aimed at interpreting and analyzing financial markets.
Our Philosophy
We do not believe in magic formulas, get-rich-quick promises, or infallible predictions.
We believe in continuous study, critical analysis, risk management, and constant evolution.
Frequência do Mercado was created as an environment where investors, traders, students, and professionals can learn, explore new ideas, and deepen their understanding of financial markets.
Our Commitment
To produce content with responsibility, independence, and an educational focus.
More than following market movements, we aim to understand the principles, data, and ideas behind them.
Because knowledge is not just information.
Knowledge is a competitive advantage.
— Diego Vinicius Righetti Sá
Founder of Frequência do Mercado
Charts & Ideas
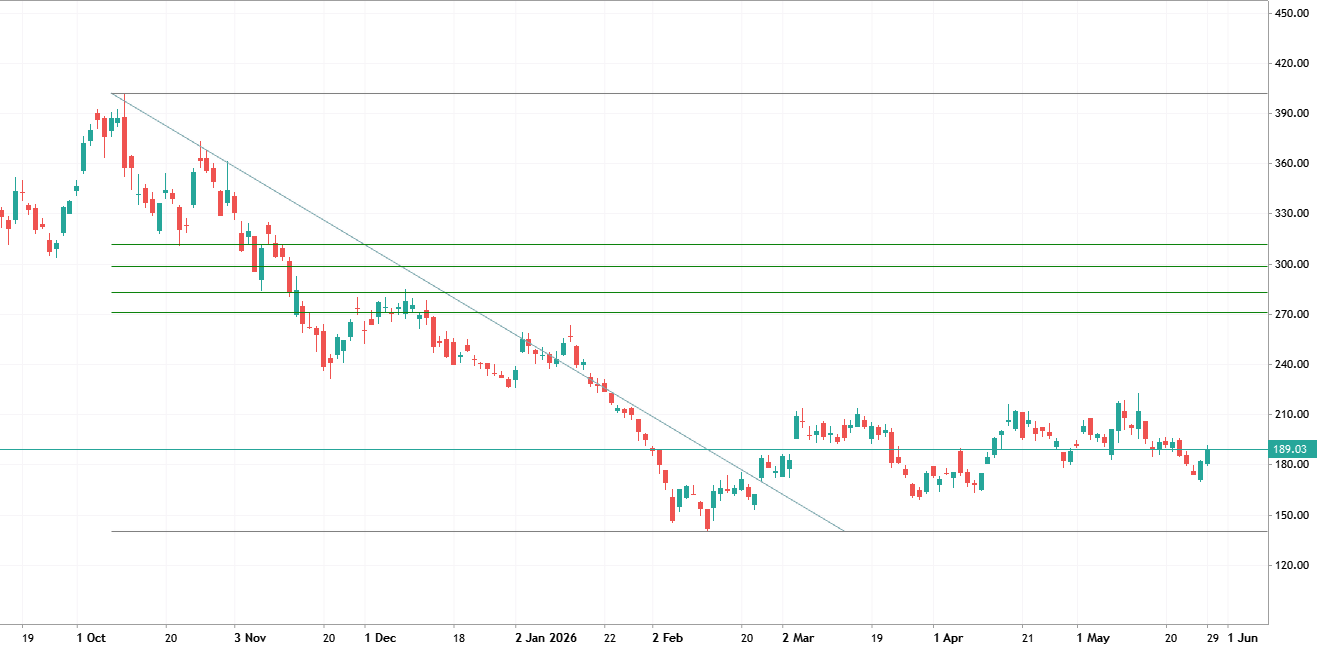

Coinbase Global (COIN) Signals Reversal: Technical Analysis and Targets
Coinbase Global shares caught the market's attention on the daily chart by presenting a classic ascending zig-zag technical behavior. After a significant upward leg, the asset performed a natural pullback, which is essential to test the interest of new buyers at more attractive price levels. In the current scenario, the price completed a controlled correction and found support exactly on a key demand region based on the retração de fibo . In the trading session following this bottom test, the market triggered a short-term reversal pattern as the asset surpassed the previous day's high. This price action signals a potential resumption of buying strength near the current price of 189.03 , validating the exhaustion of sellers. The analysis based on mathematical measurement shows that the
2026.05.30 15:42 0 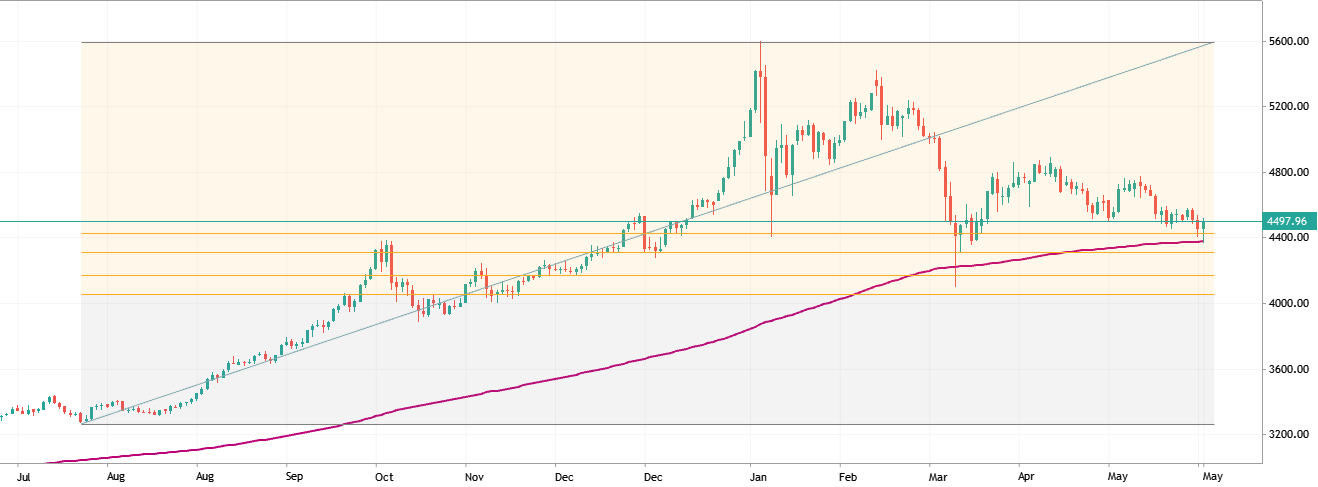
XAUUSD D1 - Teste de Confluência em Suporte Crítico e Retração de Fibonacci
O gráfico diário do XAUUSD (Ouro) apresenta um cenário de correção técnica significativa após o preço ter atingido a região de topo histórico em 5600. Atualmente, o ativo está testando a zona de suporte horizontal em 4497.96 (marcada pela linha verde), que se tornou o ponto focal da ação do preço nas últimas sessões. Confluências: Este nível de preço é de extrema relevância devido à convergência de múltiplos fatores técnicos: 1.Suporte Horizontal: A linha verde em 4497.96 já atuou como resistência e suporte anteriormente, demonstrando memória de mercado. 2.Retrações de Fibonacci: O preço está interagindo com os níveis de Fibonacci plotados (linhas laranjas), sugerindo que a correção atingiu uma zona onde compradores historicamente buscam valor. 3.Linha de Tendência de Alta (LTA): A
2026.05.28 21:13 0