GBPUSD H4 ANALYSIS GBPUSD Pound Sterling vs US Dollar

GBPUSD H4 ANALYSIS

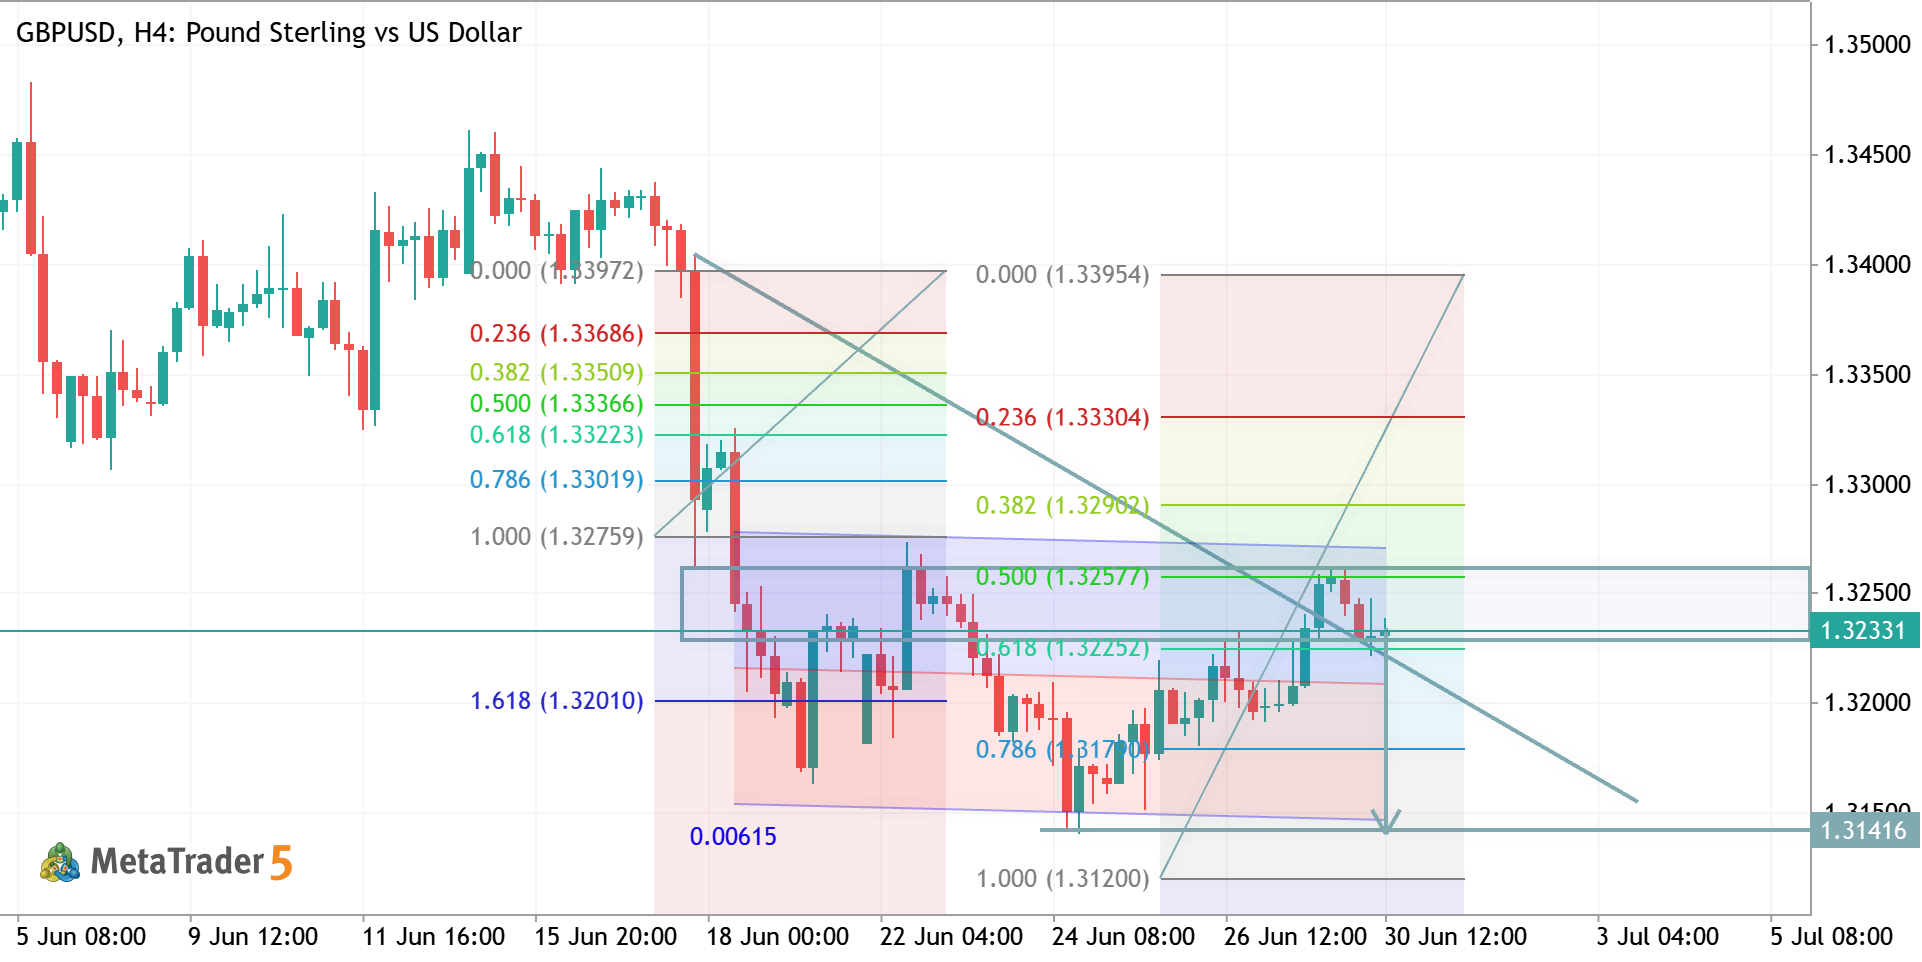
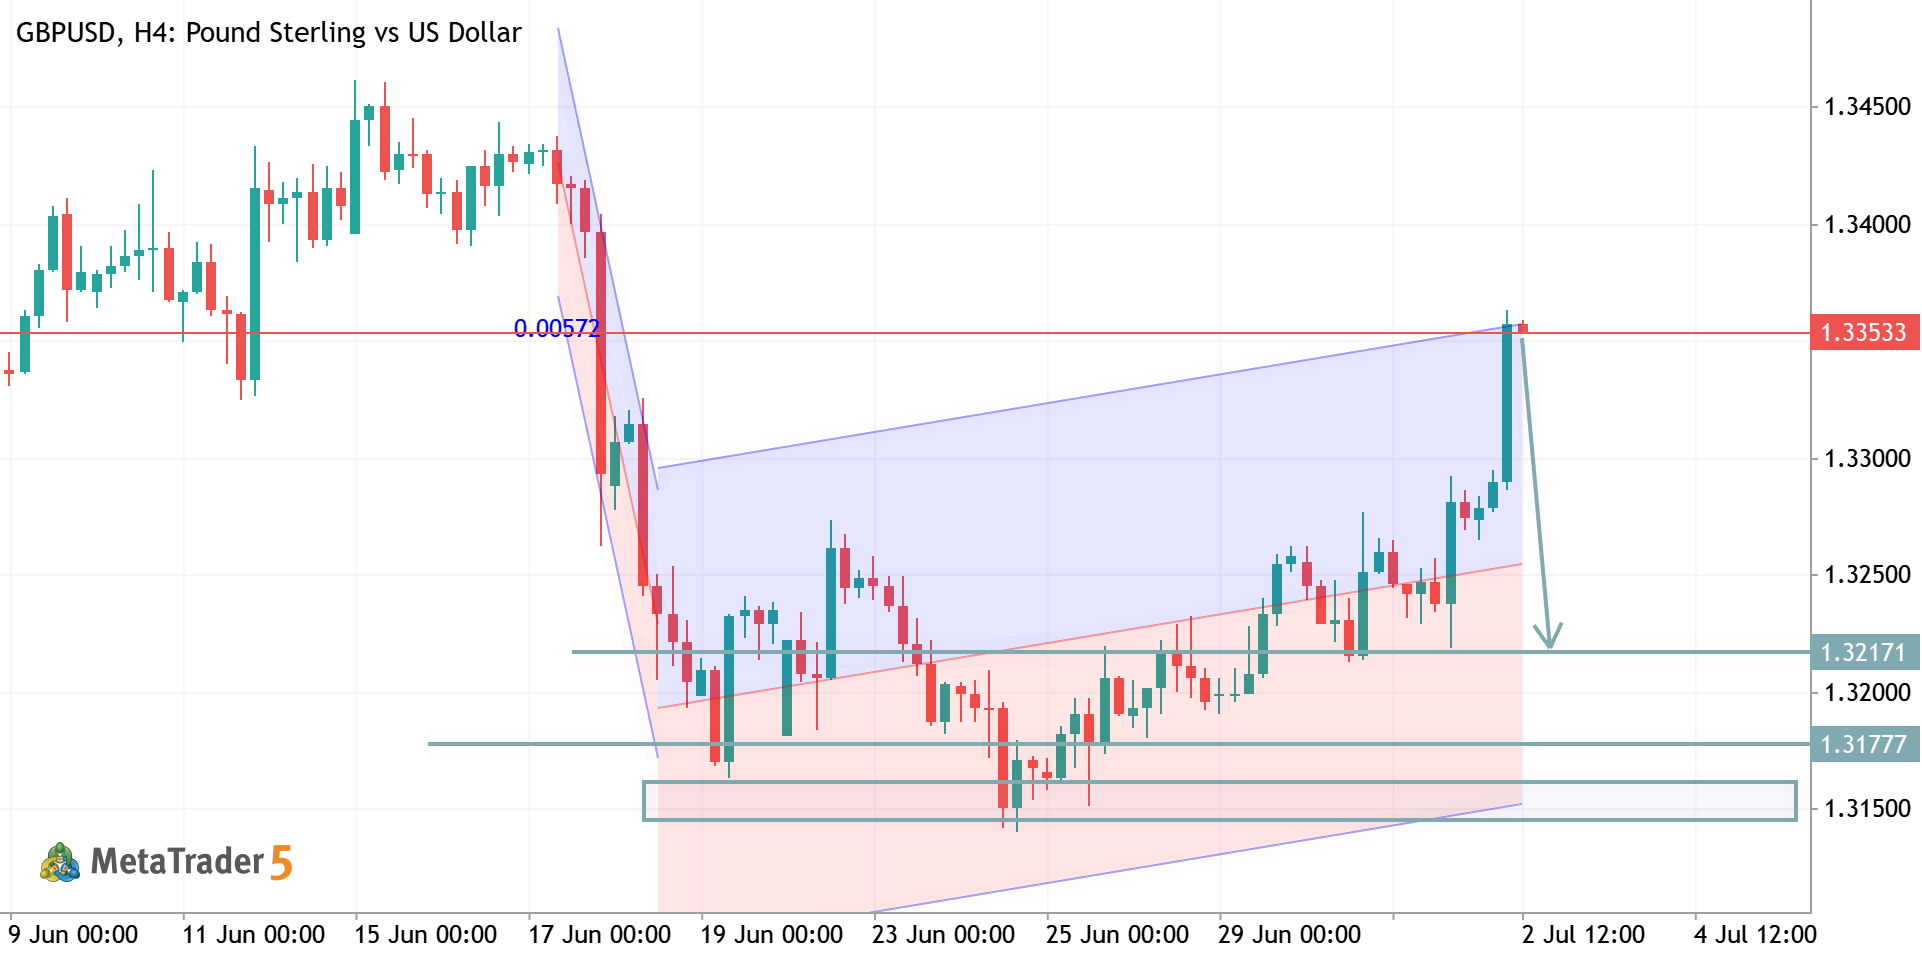
GBPUSD – Technical Outlook Price has reached a key resistance zone after completing a strong bullish move inside the rising structure. Rejection from the upper boundary suggests bearish momentum may build if sellers maintain control. A break below 1.3215 could trigger a move toward the 1.3180–1.3140 support area. Bulls remain valid only if price reclaims and holds above the recent high. Bias: Bearish below resistance 📉

BTCUSD H1 ANALYSIS BTCUSD Bitcoin vs US Dollar

BTCUSD H1 ANALYSIS

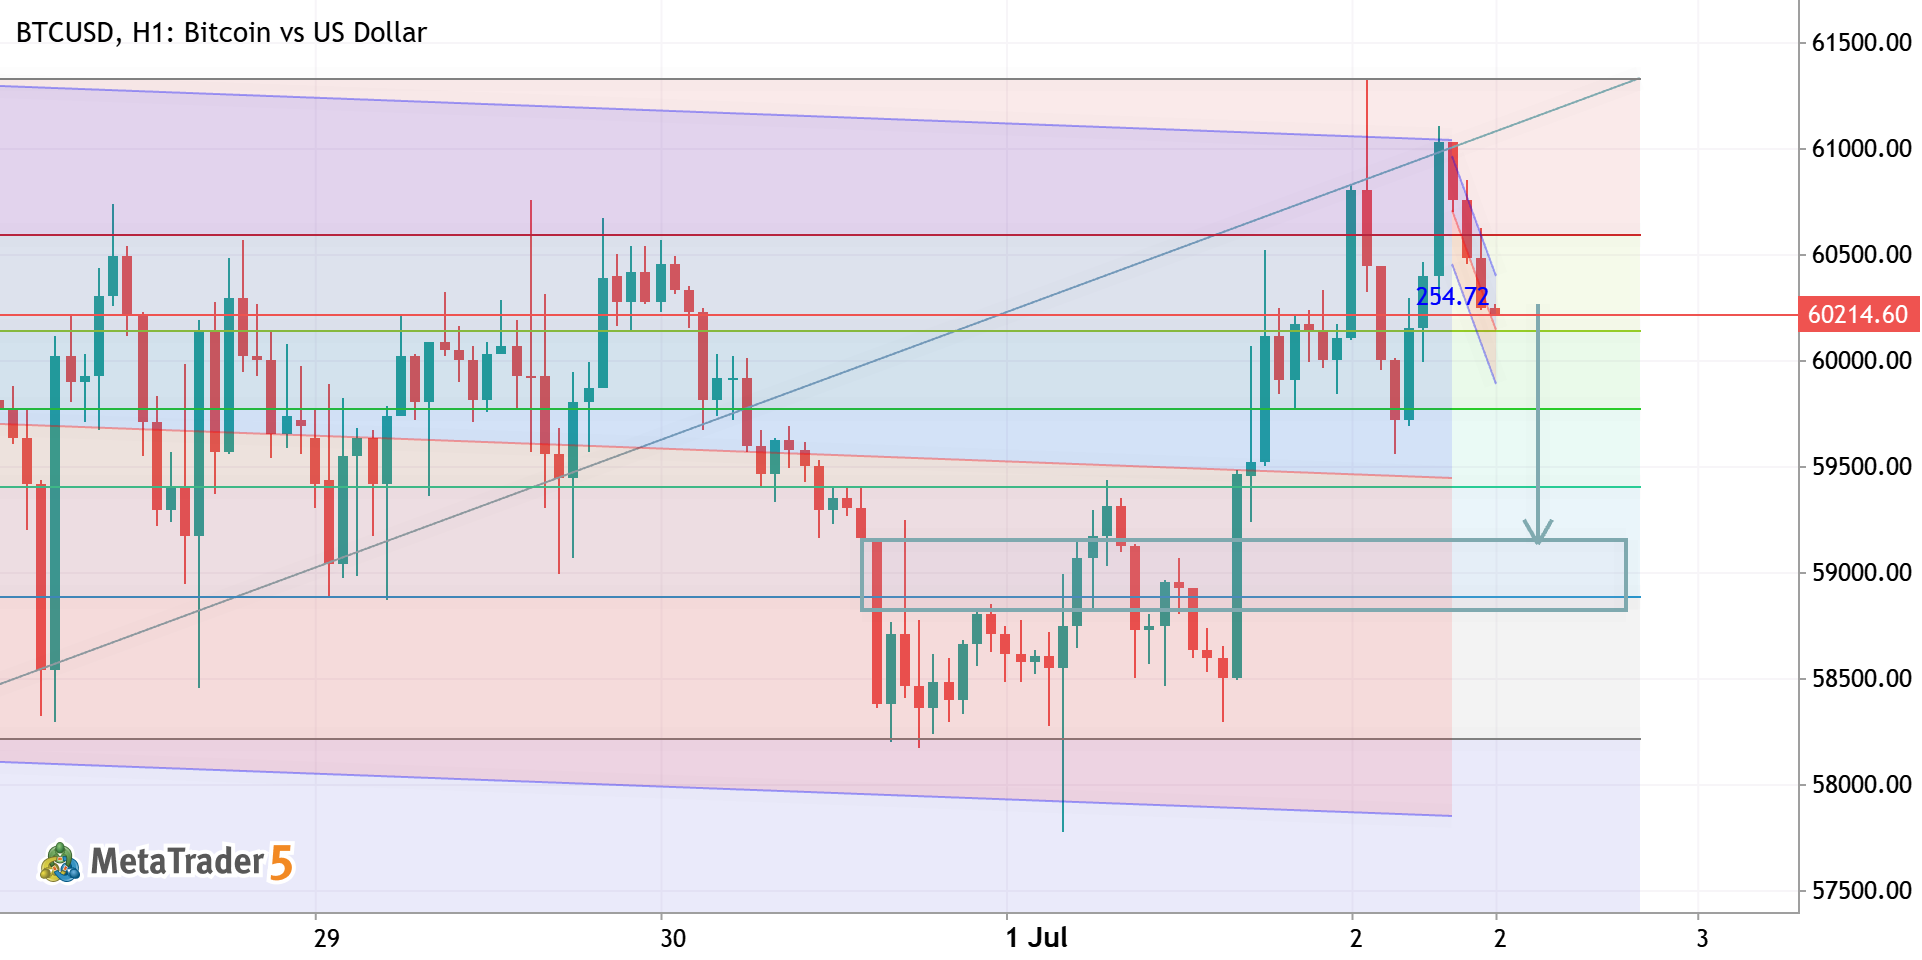
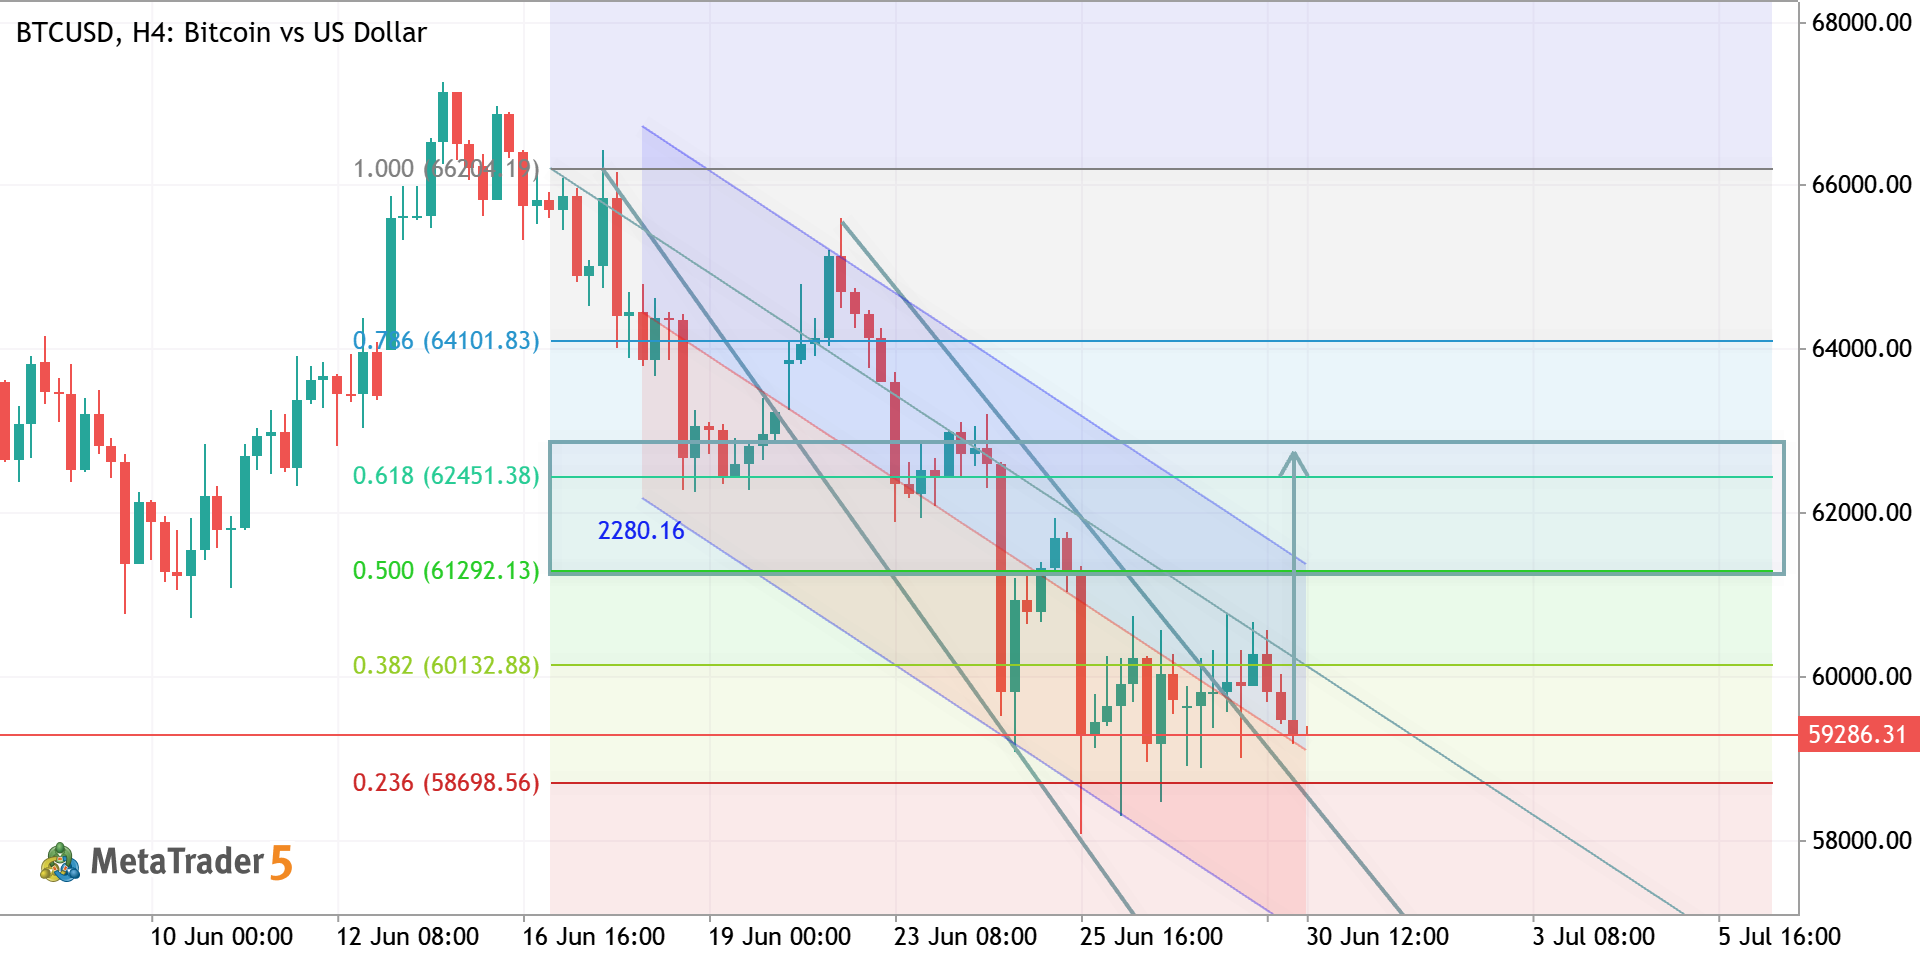
BTCUSD Analysis Price has rejected the upper resistance zone after a strong bullish impulse, signaling short-term weakness. As long as price remains below the recent high, a pullback toward the 59,000–58,500 demand zone is favored. A clean break below support could extend the bearish move, while reclaiming resistance would invalidate this setup. Bias: Bearish 📉 | Key Focus: Resistance rejection → Support retest
XAUUSD H1 ANALYSIS XAUUSD Gold vs US Dollar

XAUUSD H1 ANALYSIS

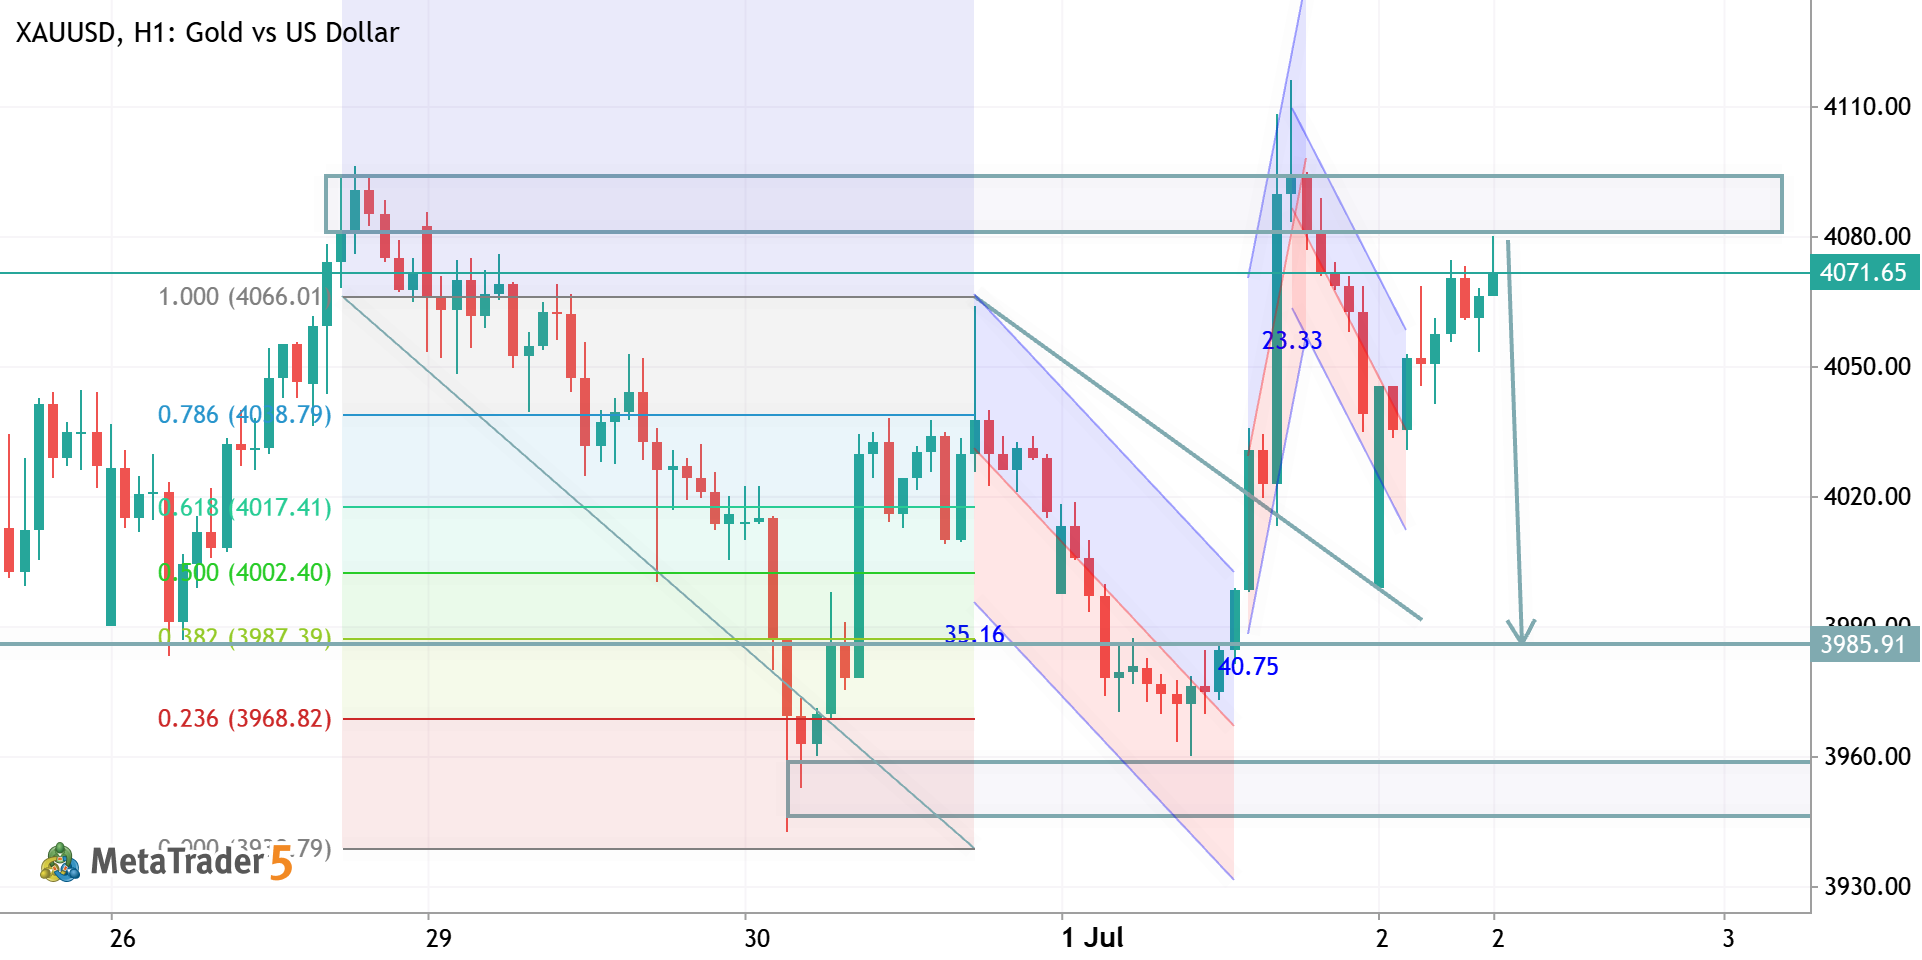
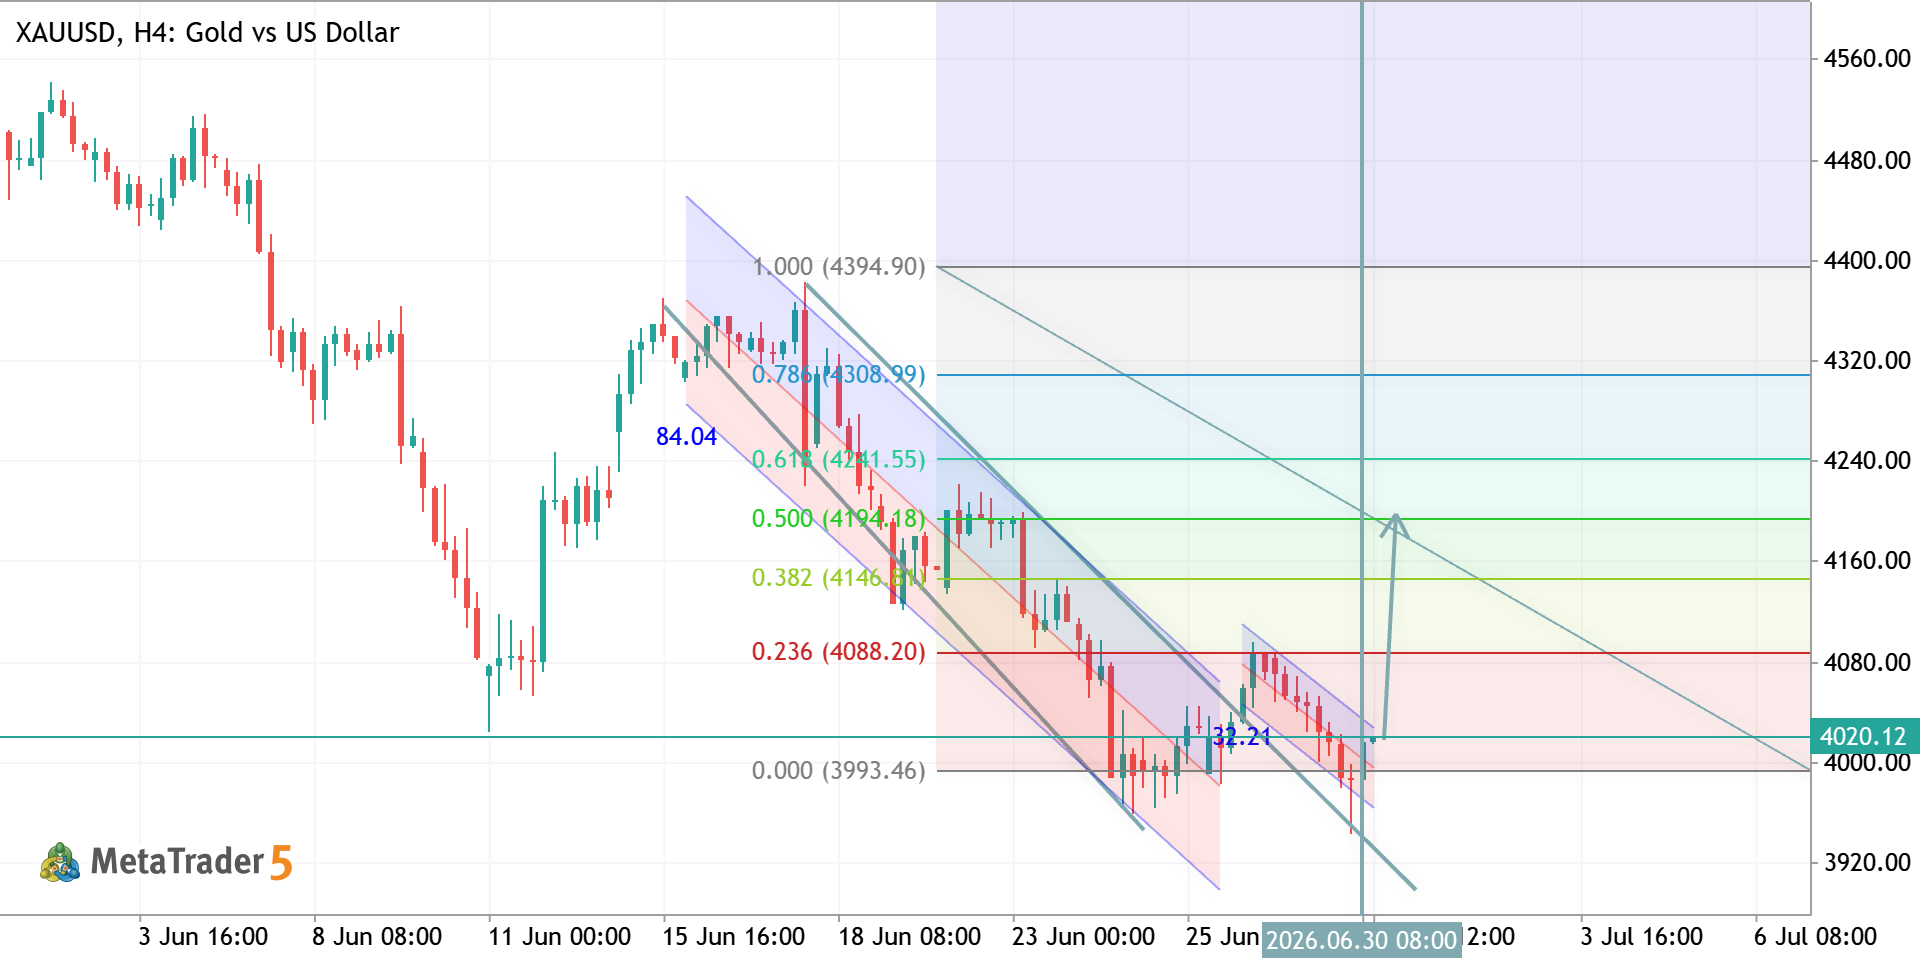
XAUUSD h1 Analysis 📊 Price is testing a strong resistance zone around 4075–4080. A rejection from this area could trigger a move toward 3985, while a confirmed breakout and close above resistance may continue the bullish trend. Waiting for confirmation before entry is the safest approach. Trade smart. Risk management first. #XAUUSD #Gold #MQL5 #Forex Or an even shorter version: Gold (XAUUSD): Price is at a key resistance. Rejection = bearish move toward 3985. Breakout above resistance = bullish continuation. Patience and confirmation are key.
PYPL - Daily Rally to the Possible Bullish Reversal PYPL PayPal Holdings, Inc. - Common Stock

PYPL - Daily Rally to the Possible Bullish Reversal

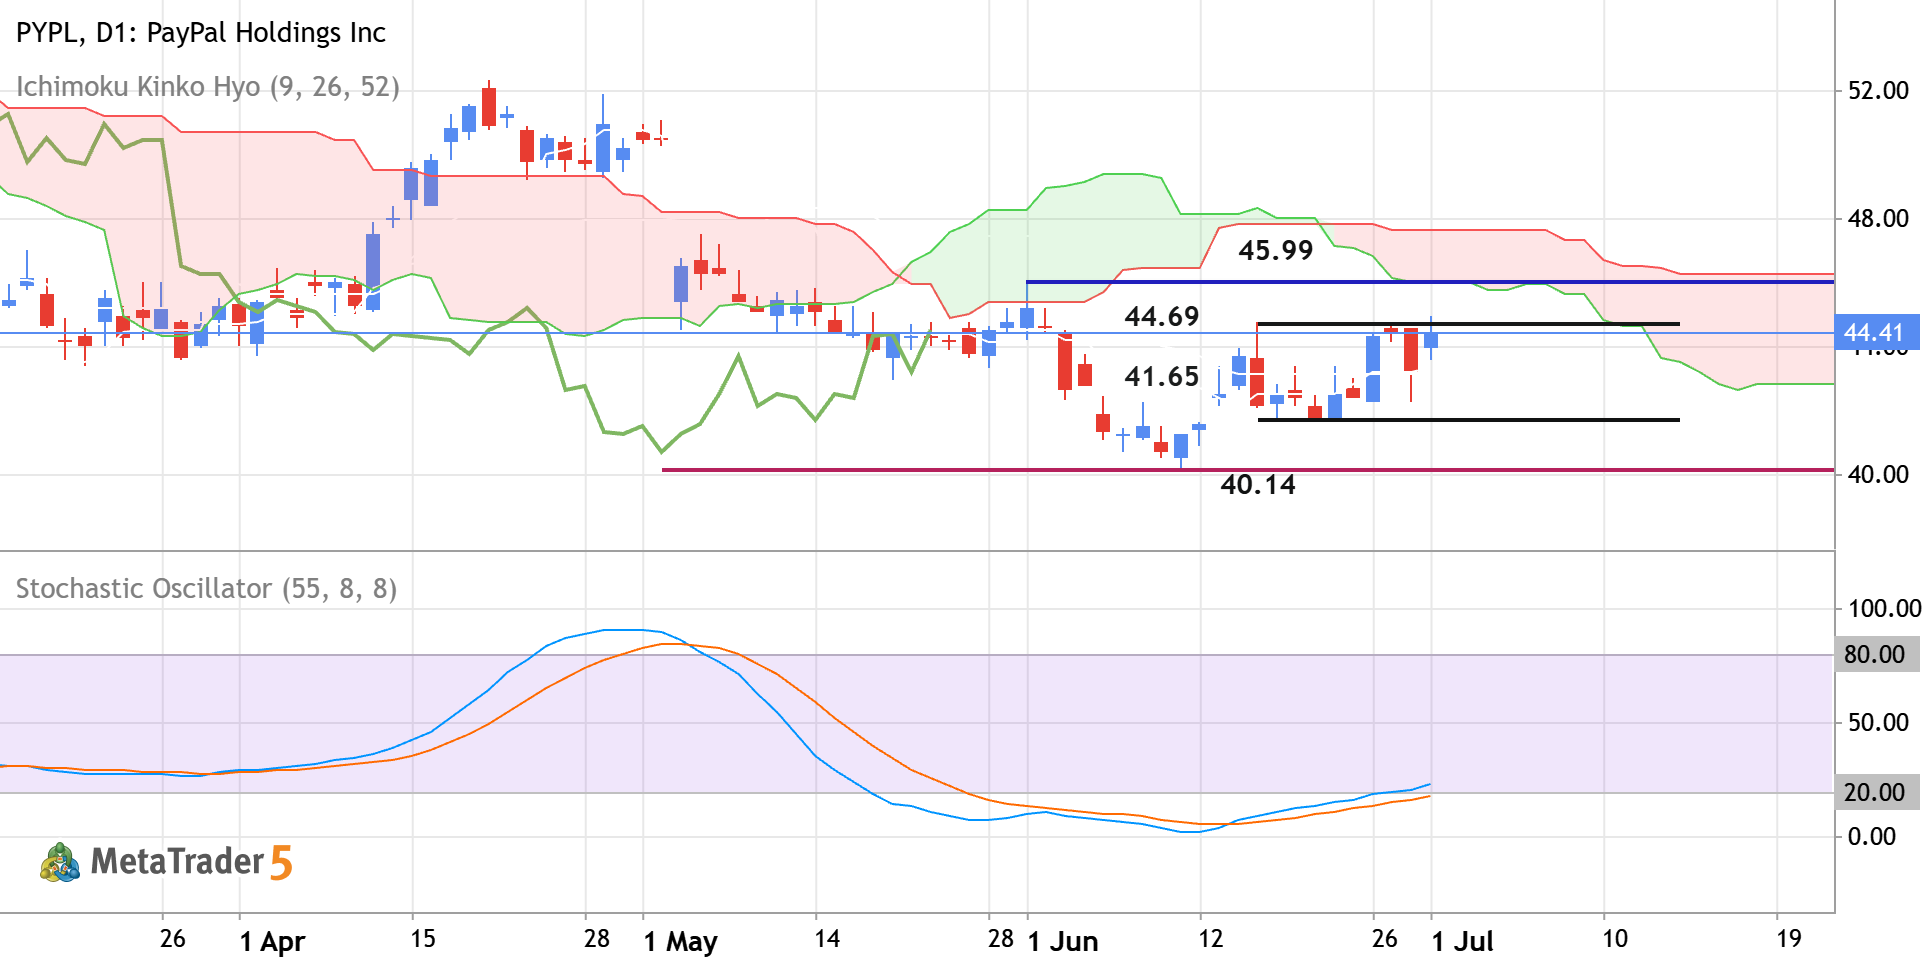
Daily price is located near and below Ichimoku cloud in the bearish area of the chart. The price was blinced from resistance levels at 40.14 and 41.65 to above for the bear market rally to be started. The Stochastic oscillator is showing the possible uptrend in the near future, and Chinkou Span line is crossing historical price but on open daily bar for now. If the price breaks the resistance level at 44.69 to the 45.99 to above so the primary bullish reversal will be started. If the price crosses support at 41.65 together with support level at 40.14 to below so the primary bearish trend will be resumed. Alternatively, the price will be on secondary ranging within the primary bearish trend to be near and below Ichimoku cloud waiting for direction of the strong trend to be started. Trading
GBPUSD TRADE IDEA GBPUSD Long Pound Sterling vs US Dollar

GBPUSD TRADE IDEA

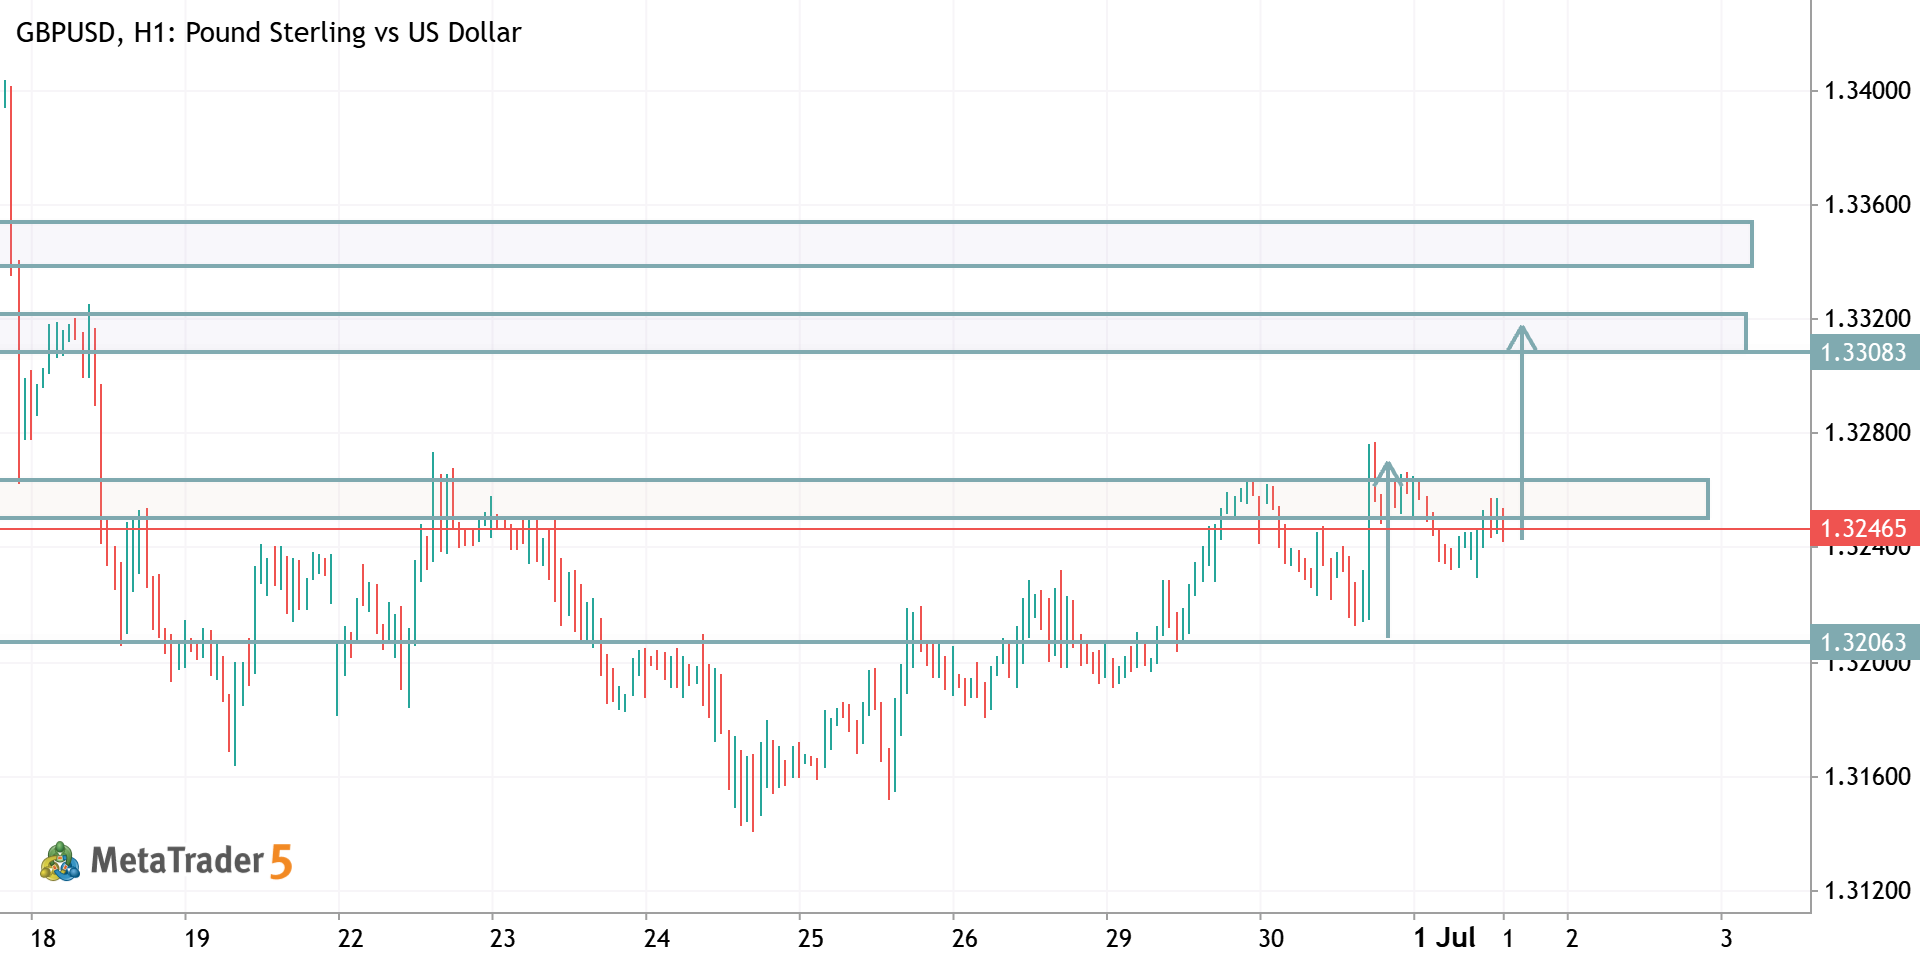
GBPUSD (H1) – Short Trade Setup Based on your chart, a short is reasonable if price rejects the resistance zone around 1.3250–1.3268 . Entry: Sell: 1.3250–1.3265 (after bearish confirmation) Stop Loss: 1.3275–1.3280 (above the recent swing high) Take Profit: TP1: 1.3206 TP2: 1.3160 TP3: 1.3135 (if bearish momentum accelerates) Trade Reason Price is testing a key resistance/supply zone . The overall trend remains bearish despite the recent recovery. A rejection from resistance offers a favorable risk-to-reward setup. Bias: Bearish (Short) , but wait for a bearish rejection candle or a break below the most recent H1 higher low before entering.
XAUUSD H4 ANALYSIS XAUUSD Gold vs US Dollar

XAUUSD H4 ANALYSIS

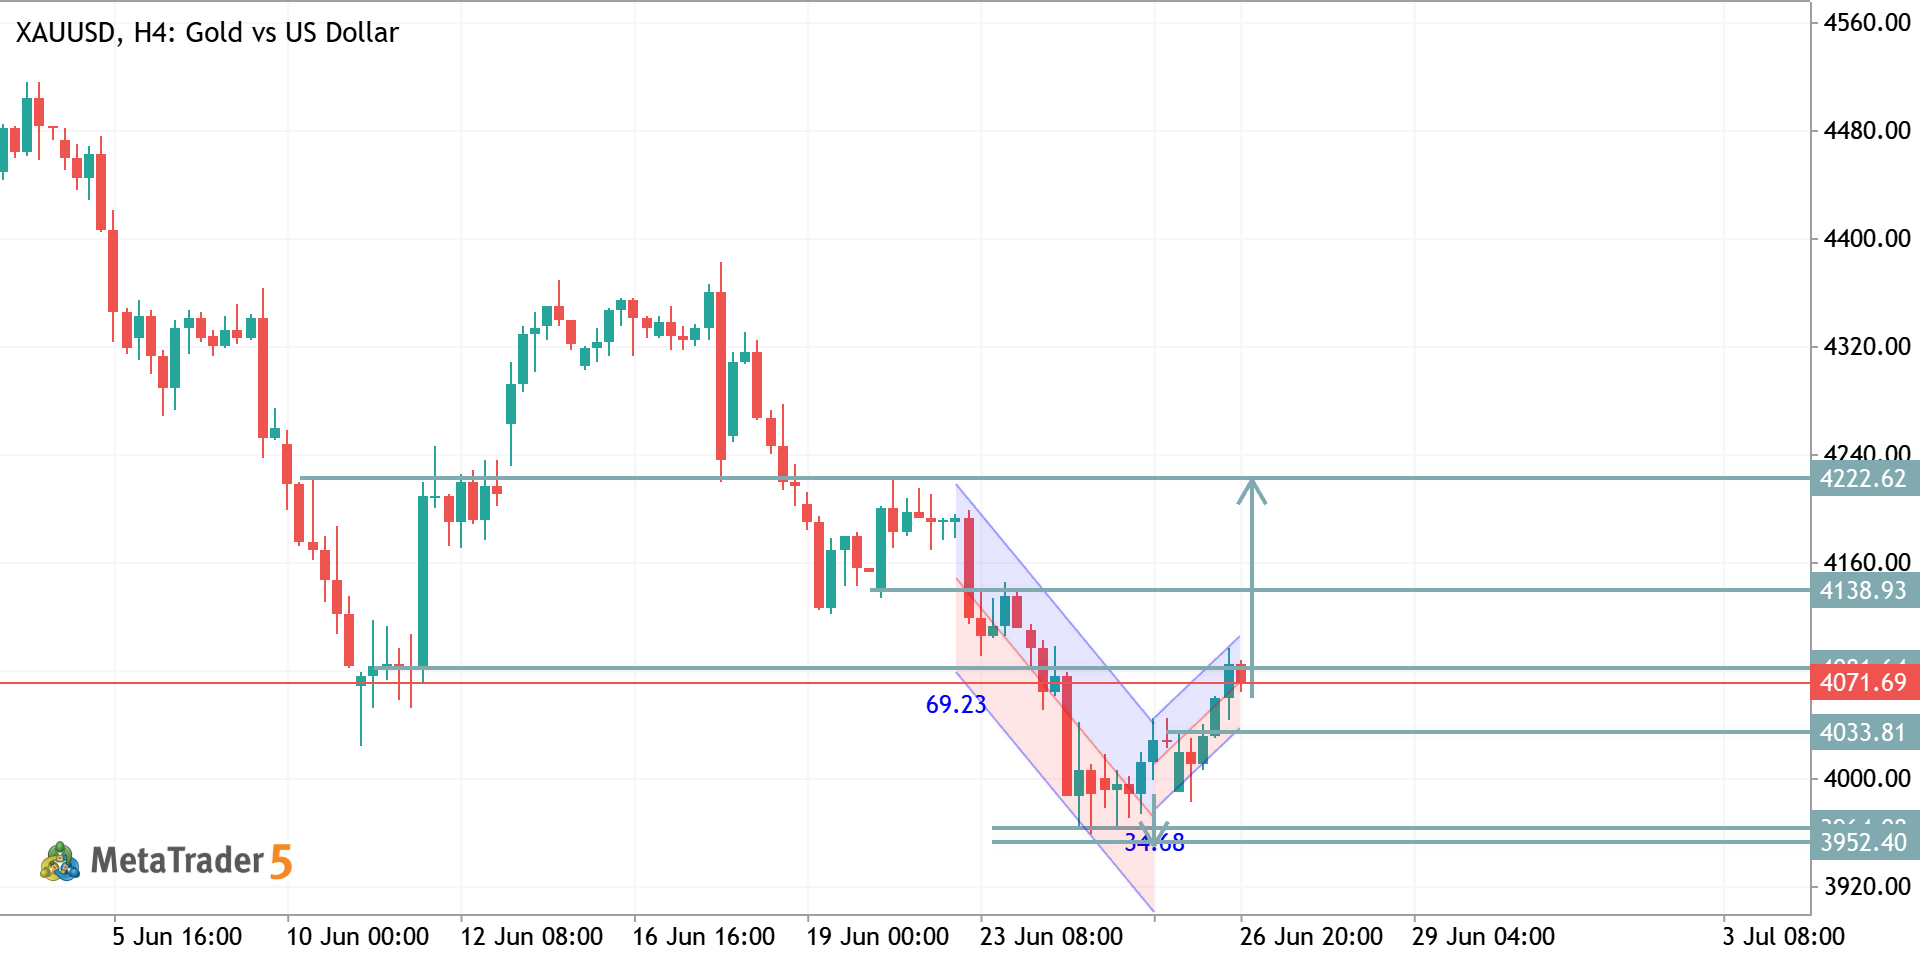
XAUUSD H4 Analysis Gold remains inside a falling channel, but price is approaching a key support zone where buying pressure is increasing. A breakout from the channel could signal a trend reversal. 📈 Bullish Scenario: A confirmed breakout above channel resistance may drive price toward 4200, with 4300 as the next upside target. 📉 Bearish Scenario: If the channel holds, sellers could push price back to retest the recent lows before any meaningful recovery. Bias: Cautiously Bullish. Waiting for breakout confirmation before targeting higher levels. #XAUUSD #Gold #Forex #TechnicalAnalysis #MQL5 #PriceAction
XAUUSD H4 ANALYSIS XAUUSD Gold vs US Dollar

XAUUSD H4 ANALYSIS

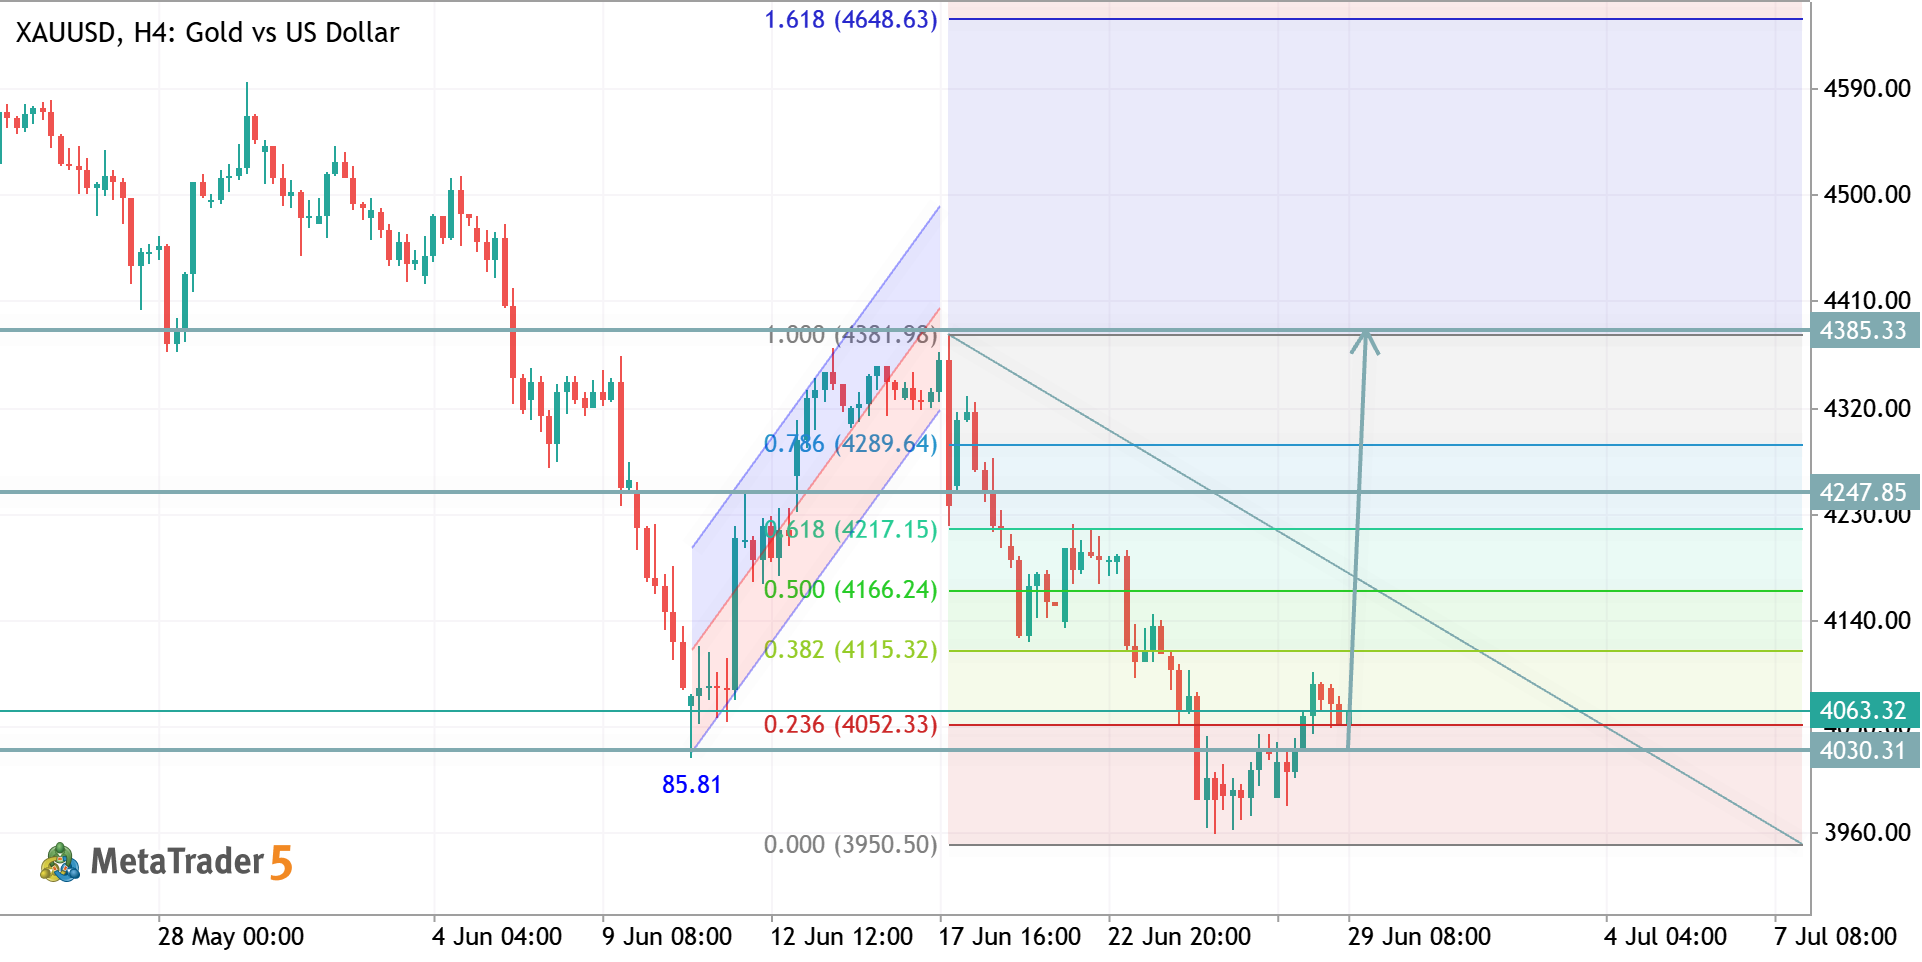
XAUUSD H4 Analysis Gold is attempting a recovery after respecting the 0.236 Fibonacci support. Buyers are stepping in, but price still needs to break the nearby resistance to confirm a stronger bullish move. 📈 Bullish Scenario: A sustained breakout above 4285–4385 could open the path toward 4648. 📉 Bearish Scenario: If price gets rejected at resistance, expect a retest of the 4050 support area. Bias: Bullish above support, but confirmation above resistance is essential before expecting further upside. #XAUUSD #Gold #Forex #TechnicalAnalysis #MQL5 #PriceAction
USDIND - Daily Ranging for Direction USDINR US Dollar vs Indian Rupee

USDIND - Daily Ranging for Direction

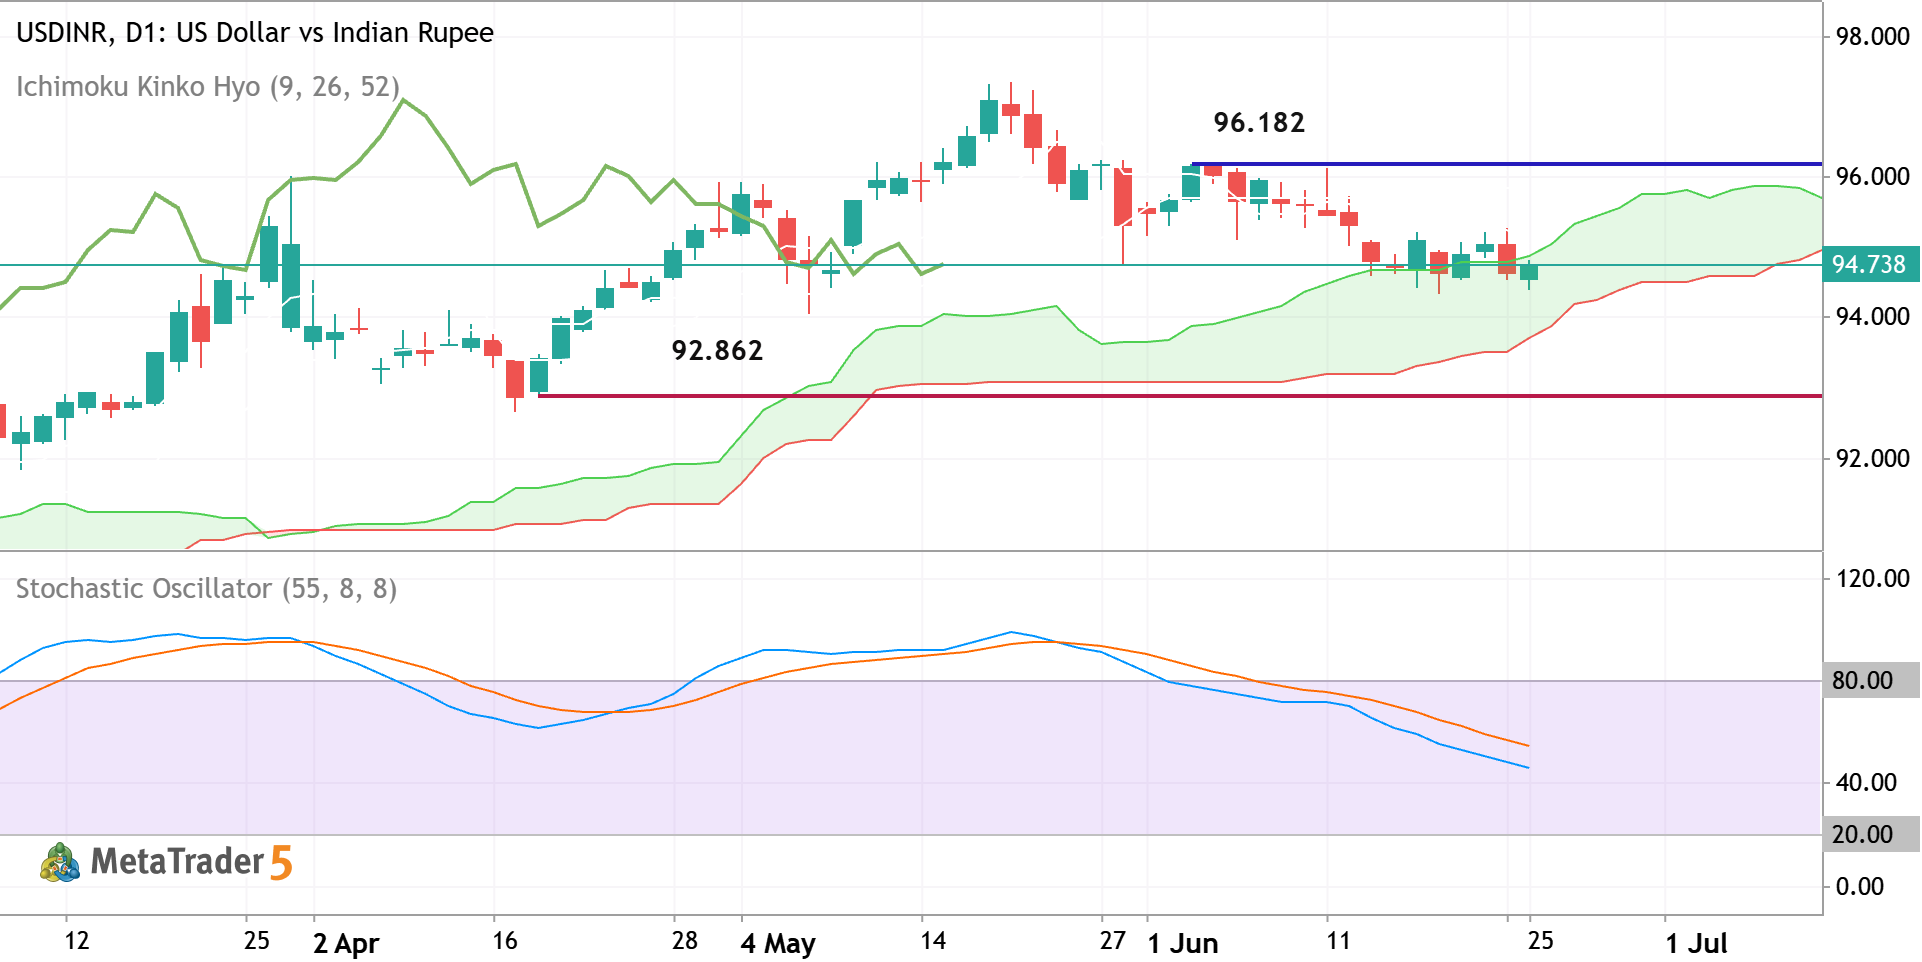
Daily price broke the upper border of Ichimoku cloud to below for the secondary ranging market condition. Chinkou Span line of Ichimoku indicator crossed the historycal price to below as well for the good daily breakdown to be started. Stochastic oscillator is showing the bearish condition to be continuing for example. If the price breaks support level at 92.862 to below so the primary bearish reversal will be started. If the price crosses the resistance level at 96.182 to above so the primary bullish trend will be resumed. Alternatively, the price will be on secondary ranging to be near and inside Ichimoku cloud waiting for direction. Recommendation : Waiting for Direction.
XAUUSD TRADE IDEA XAUUSD Long Gold vs US Dollar

XAUUSD TRADE IDEA

XAUUSD (Gold) H4 Trade Analysis – Buy Bias Market Structure: Bullish recovery after a completed falling channel breakout. Trend: Short-term bullish after breaking above the descending channel. Key Support: 4033–4072 Major Resistance: 4139 , then 4223 Momentum: Buyers have regained control, but price is testing resistance near 4072 . Buy Setup Entry: 4055–4075 (on a pullback or bullish confirmation) Stop Loss: Below 4025 Take Profit 1: 4139 Take Profit 2: 4223 Alternative Scenario If price closes below 4033 , the bullish setup weakens and gold could retest 3952 before finding new demand. Overall Bias: BUY while price remains above 4033 , targeting 4139 and 4223 .