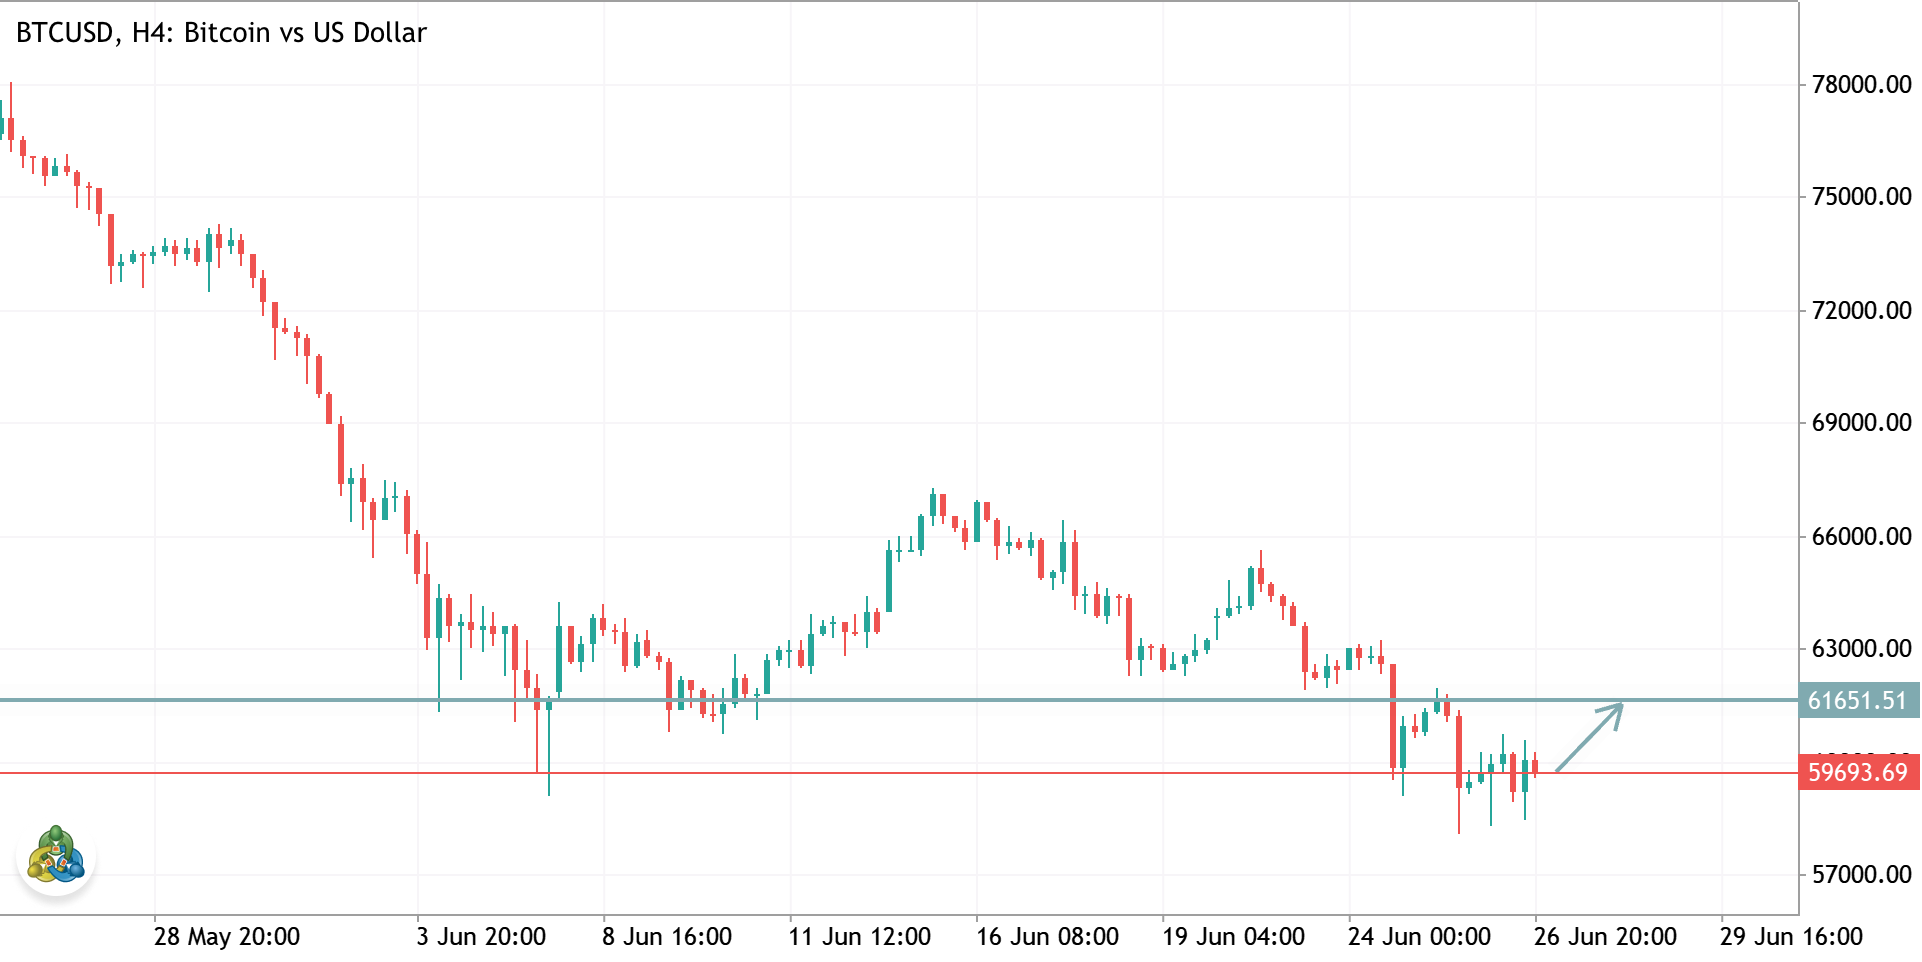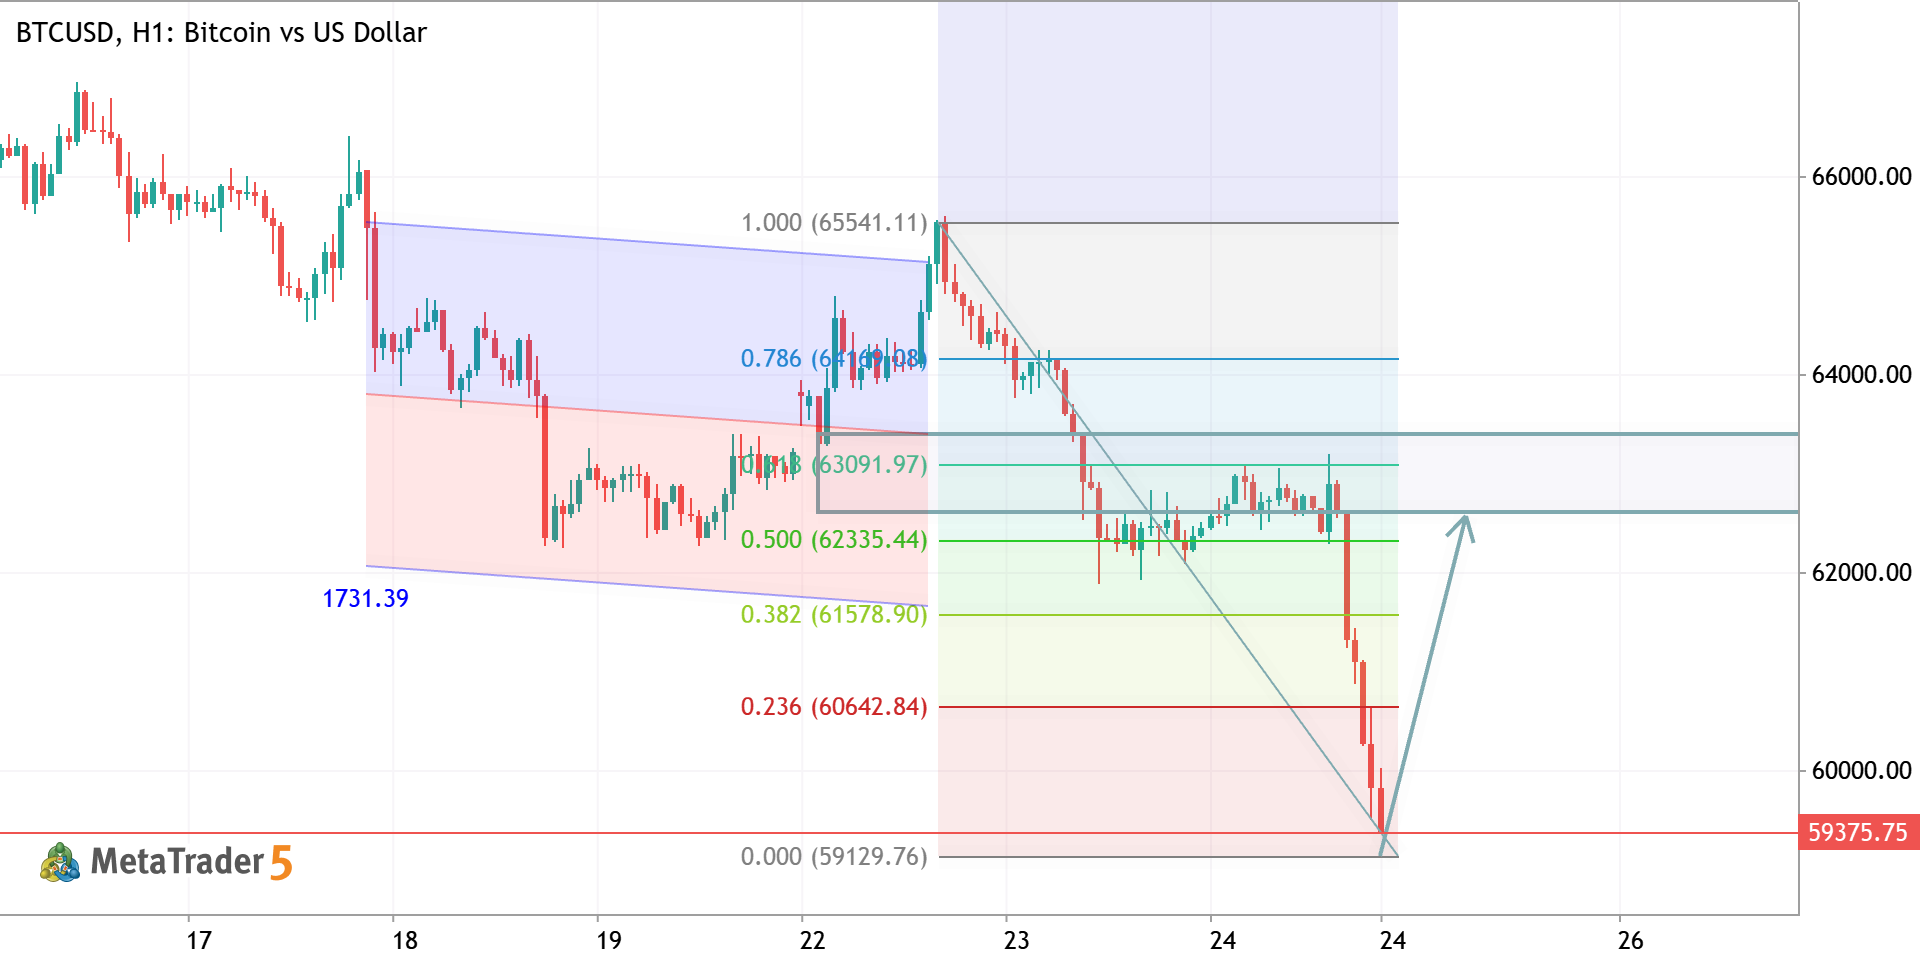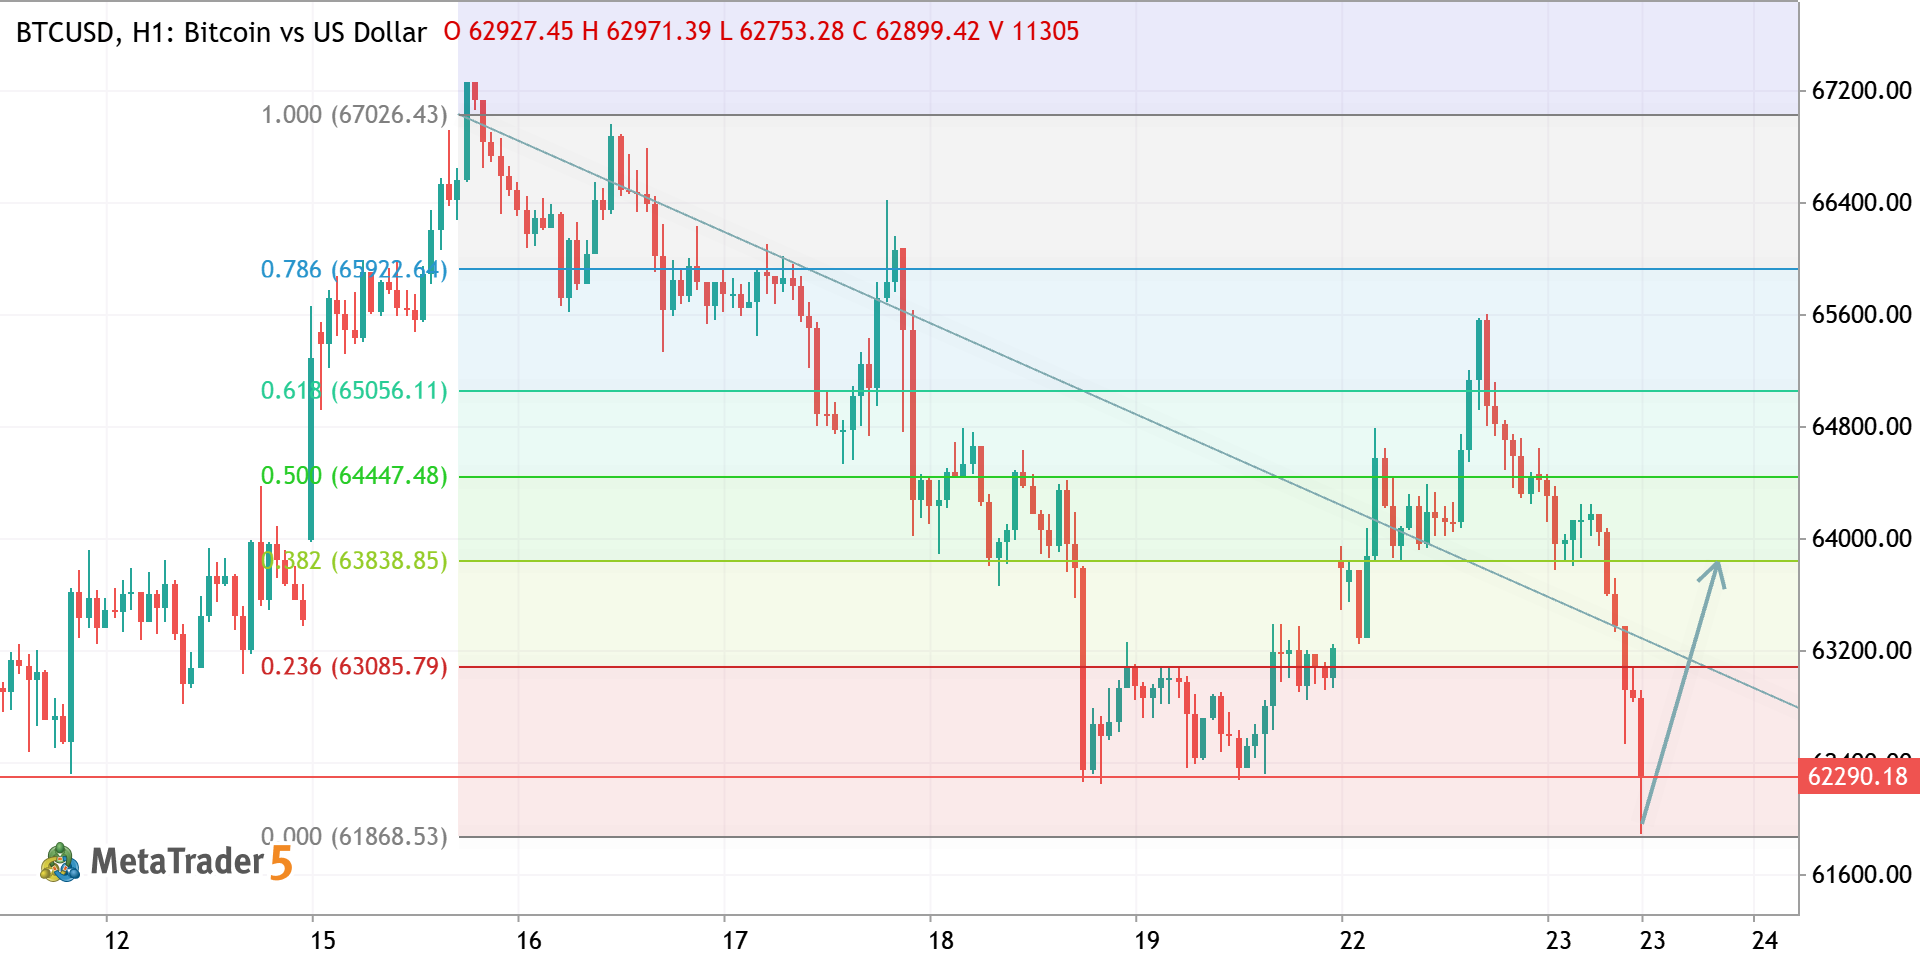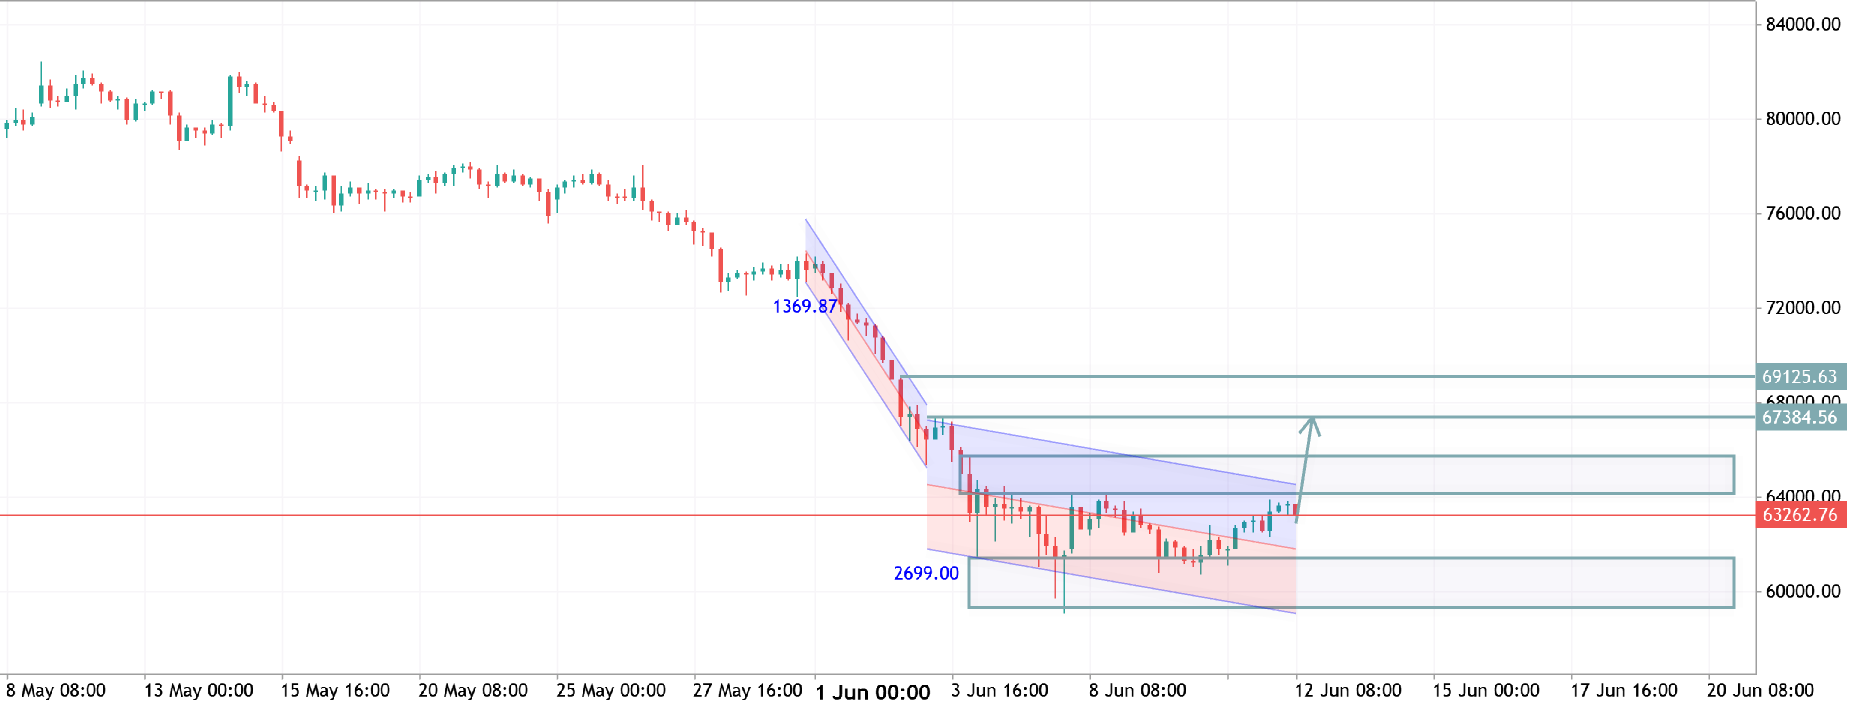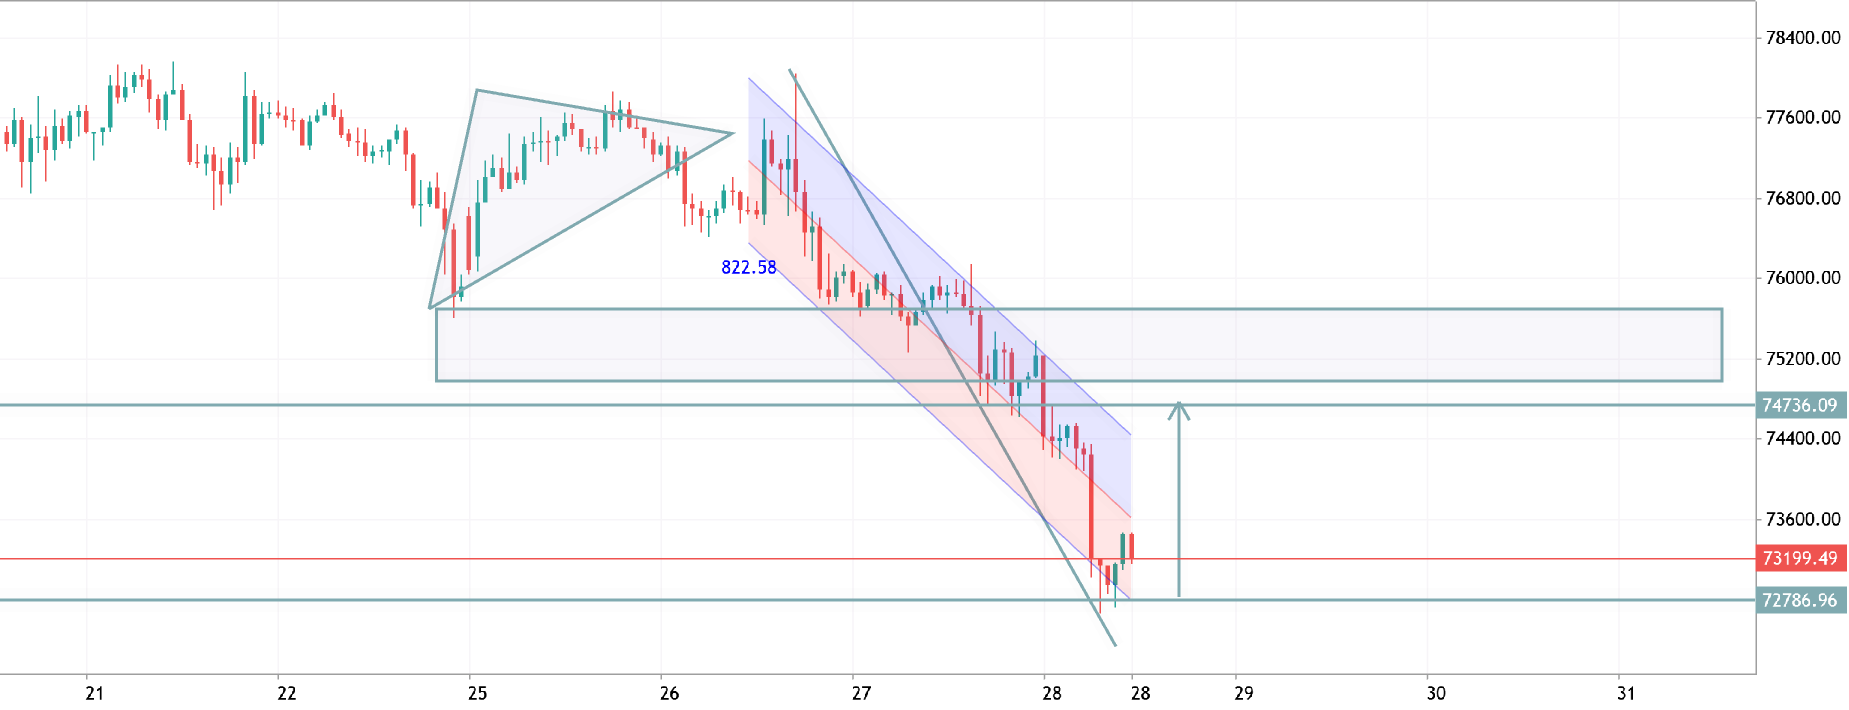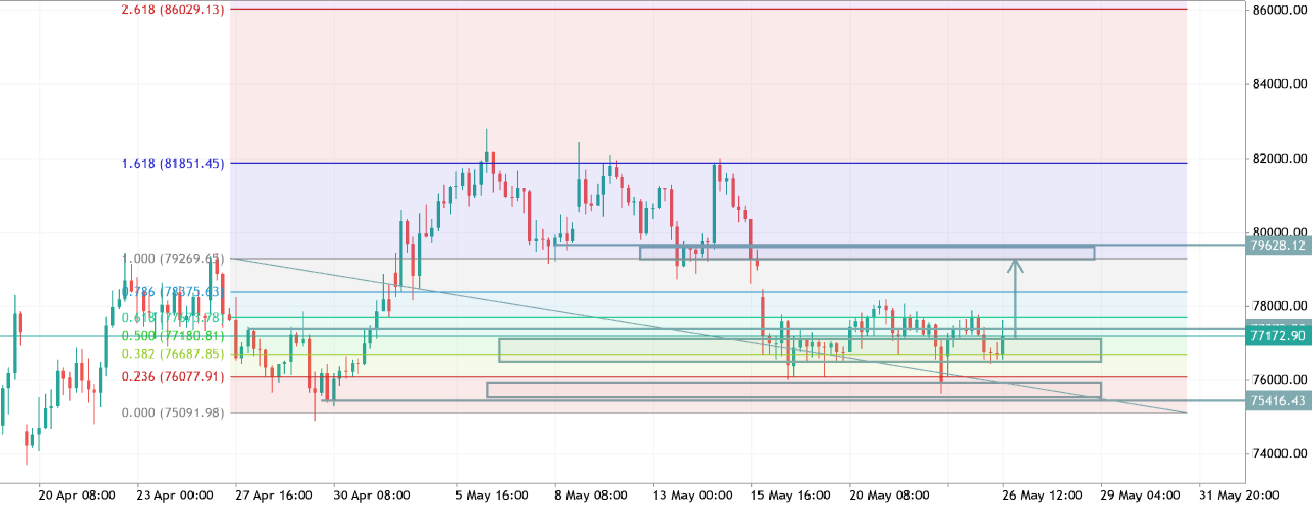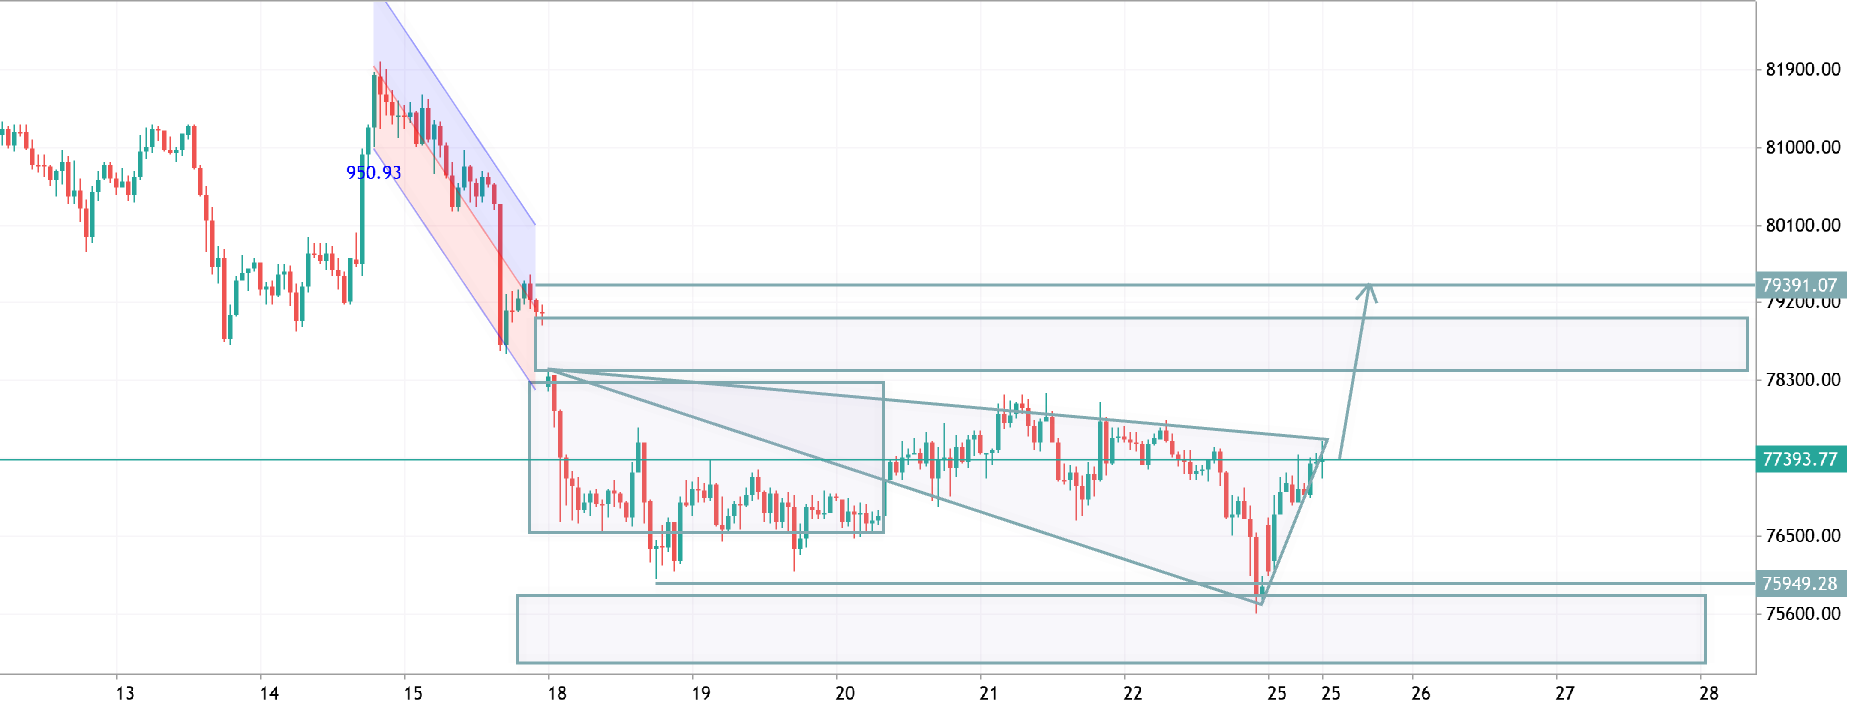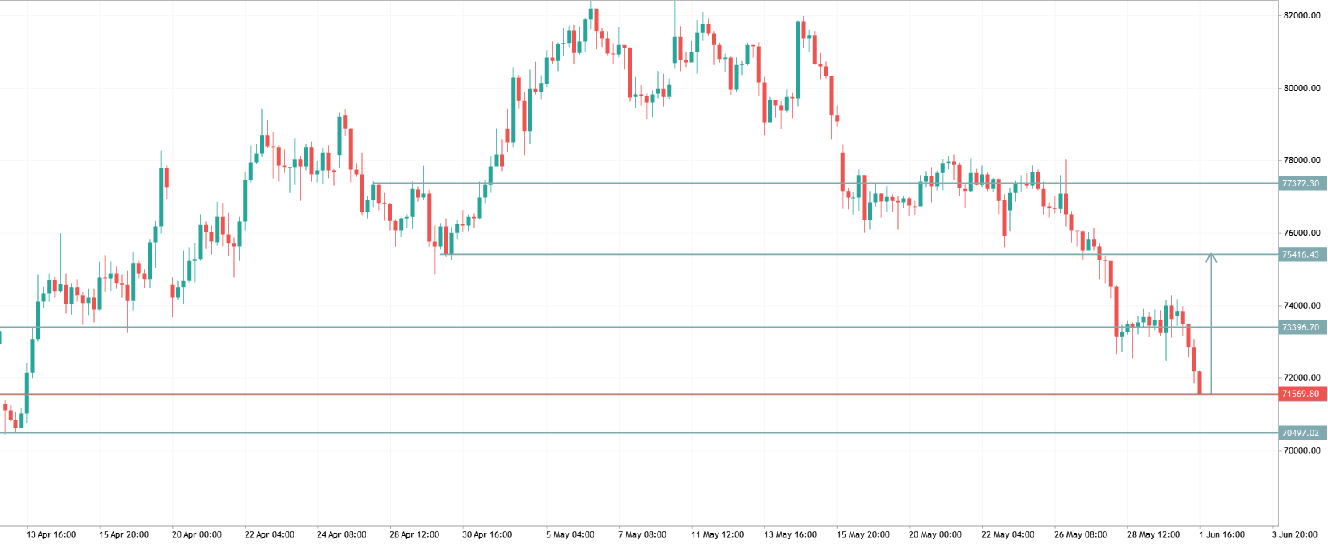
BTCUSD ANALYSIS BTCUSD Long Bitcoin vs US Dollar
BTCUSD ANALYSIS
BTCUSD ANALYSIS ₿ BTC is currently showing a bullish market structure, while forming a potential Bullish Flag / Pennant pattern in the short term. After a strong impulsive rally, price has entered a consolidation phase around the 80.8k - 81k zone, which often signals continuation if buyers remain in control. Bullish Confirmation: • Break & close above the 81,500 – 82,000 resistance zone • Strong momentum and volume continuation Target 1: 82,500 Target 2: 83,000+ Invalidation: If BTC closes strongly below the 80k support zone, the bullish setup weakens and a deeper pullback may follow. Key Observations: • Higher lows are still being respected • Market structure remains bullish overall • Current movement looks more like consolidation than reversal In simple terms: Break above 81k =
BTCUSD BTCUSD Long Bitcoin vs US Dollar
BTCUSD
Short Chart Analysis (BTC/USDT 4H): Trend: Bullish — price is moving inside a clear ascending channel (higher highs & higher lows). Current Behavior: Rejection from resistance around 82,200 , showing short-term selling pressure. Key Support: ~ 79,500 (channel support). Key Resistance: 82,200 → 83,500 zone. Scenarios: Bullish: If price holds above 81,000 and breaks 82,200 , next targets → 83,500 – 84,000 . Bearish: If price drops below 79,500 , it may fall toward 78,000 – 77,000 . Conclusion: Trend is still bullish, but current pullback suggests possible retest of support before next move.
“BTCUSD Liquidity Grab Before Dump? 📉 Smart Money Setup” BTCUSD Short Bitcoin vs US Dollar
“BTCUSD Liquidity Grab Before Dump? 📉 Smart Money Setup”
1. Market Structure (BOS & CHoCH) Price has been making higher highs & higher lows → bullish trend The recent push into ~80,300 zone is a strong impulsive move (BOS up) ⚠️ No confirmed CHoCH yet For a valid sell, you need: Break of last higher low (around 78k–77.5k) That would confirm trend shift (CHoCH) 👉 Right now: Still bullish — you're selling into strength 🧱 2. Order Block (OB) The zone you marked (~80k–80.3k) acts like a supply zone But: It’s not a strong higher timeframe OB More like short-term liquidity area / minor OB ✅ Better OB for sell: The last bearish candle before a strong drop Currently, no strong bearish displacement yet → weak OB confirmation ⚡ 3. Fair Value Gap (FVG) There is a bullish FVG below (approx 77k–75k zone) Price often returns to fill imbalance 👉
Bitcoin (BTCUSD) Analysis BTCUSD Long Bitcoin vs US Dollar
Bitcoin (BTCUSD) Analysis
Bitcoin is consolidating inside a range structure after an uptrend, with higher lows forming → bullish continuation bias. Price is currently testing the range resistance zone (~77000), with strong support held below → breakout pressure building. Momentum shows steady bullish recovery, indicating buyers gaining control. We are considering buying BTCUSD above 77000 breakout; Target 1: 78400 Target 2: 79200 A rejection and drop back below 76400 would invalidate the bullish setup