GOLD VS US DOLLAR (XAU/USD) 1H ANALYSIS XAUUSD Gold vs US Dollar
GOLD VS US DOLLAR (XAU/USD) 1H ANALYSIS
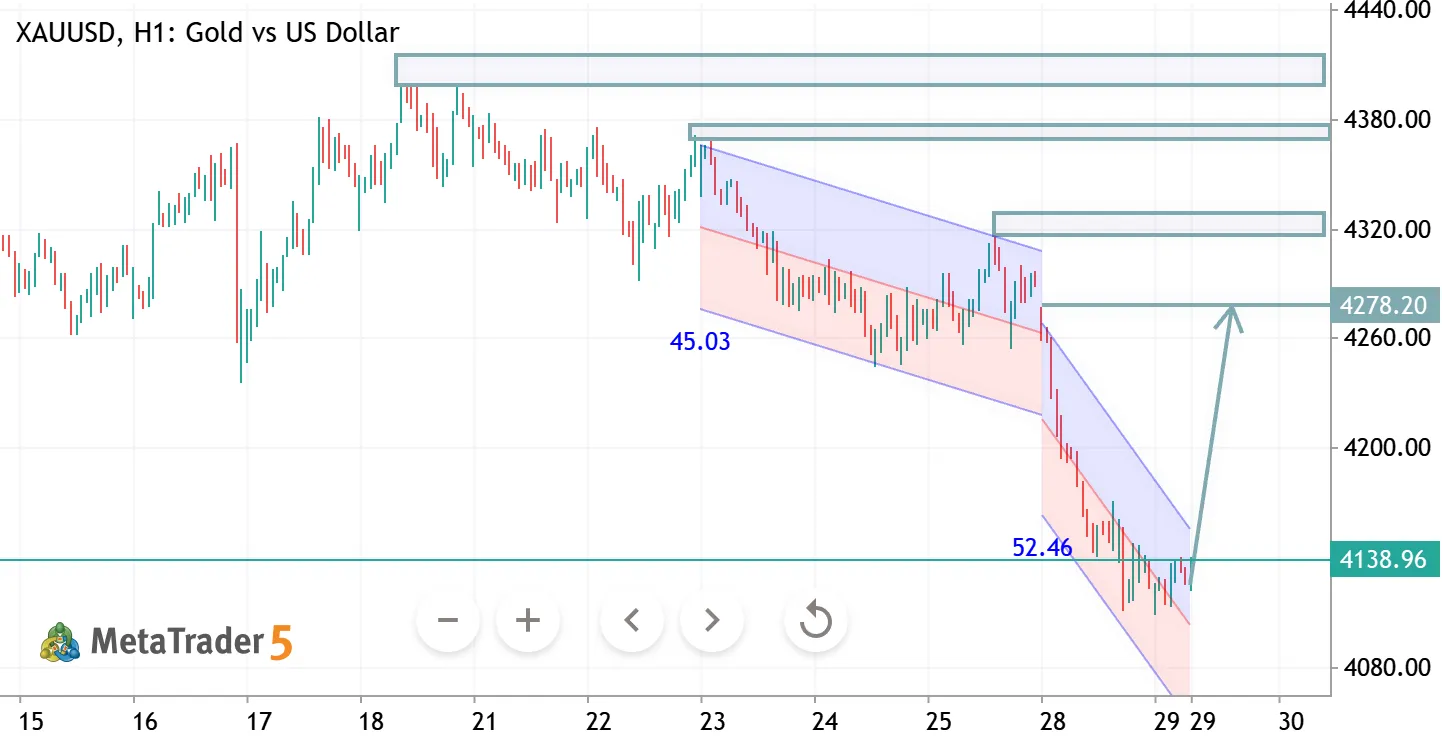
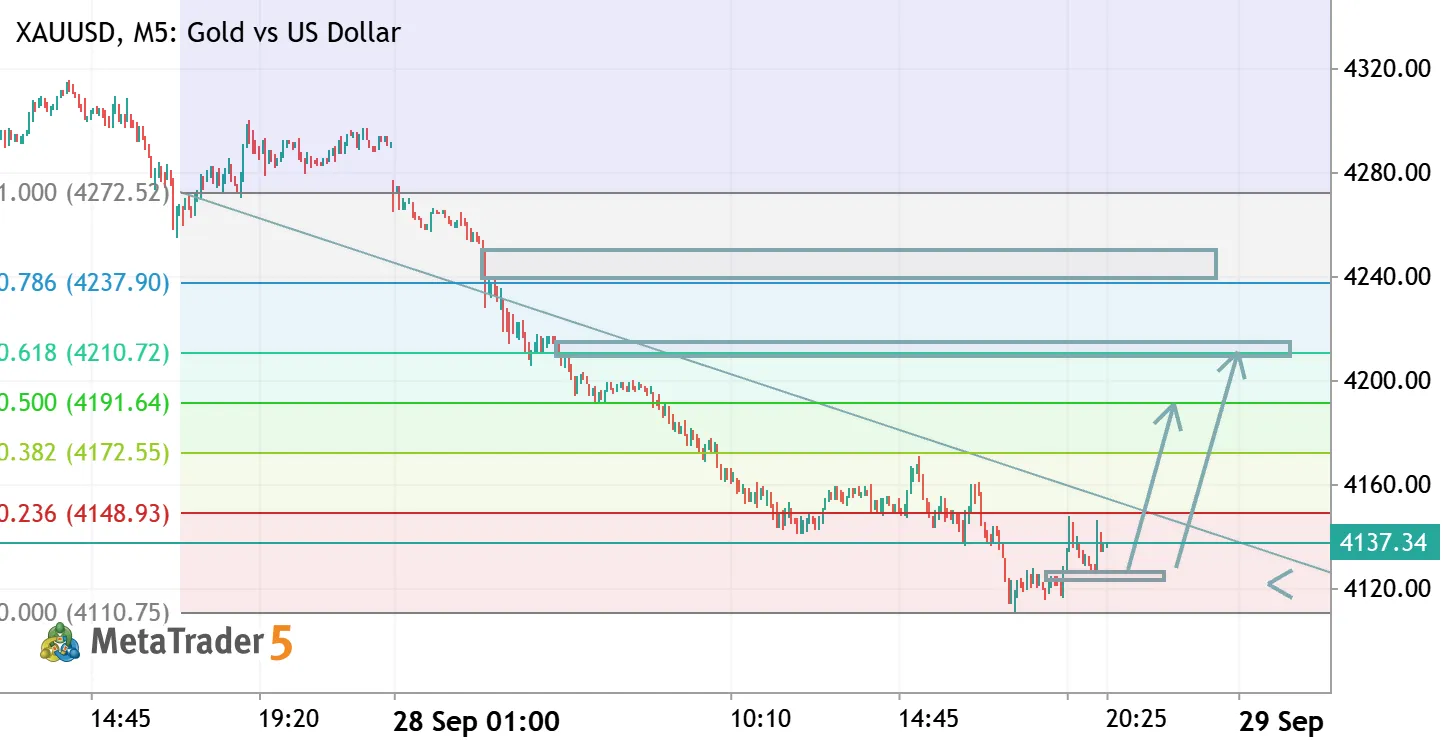
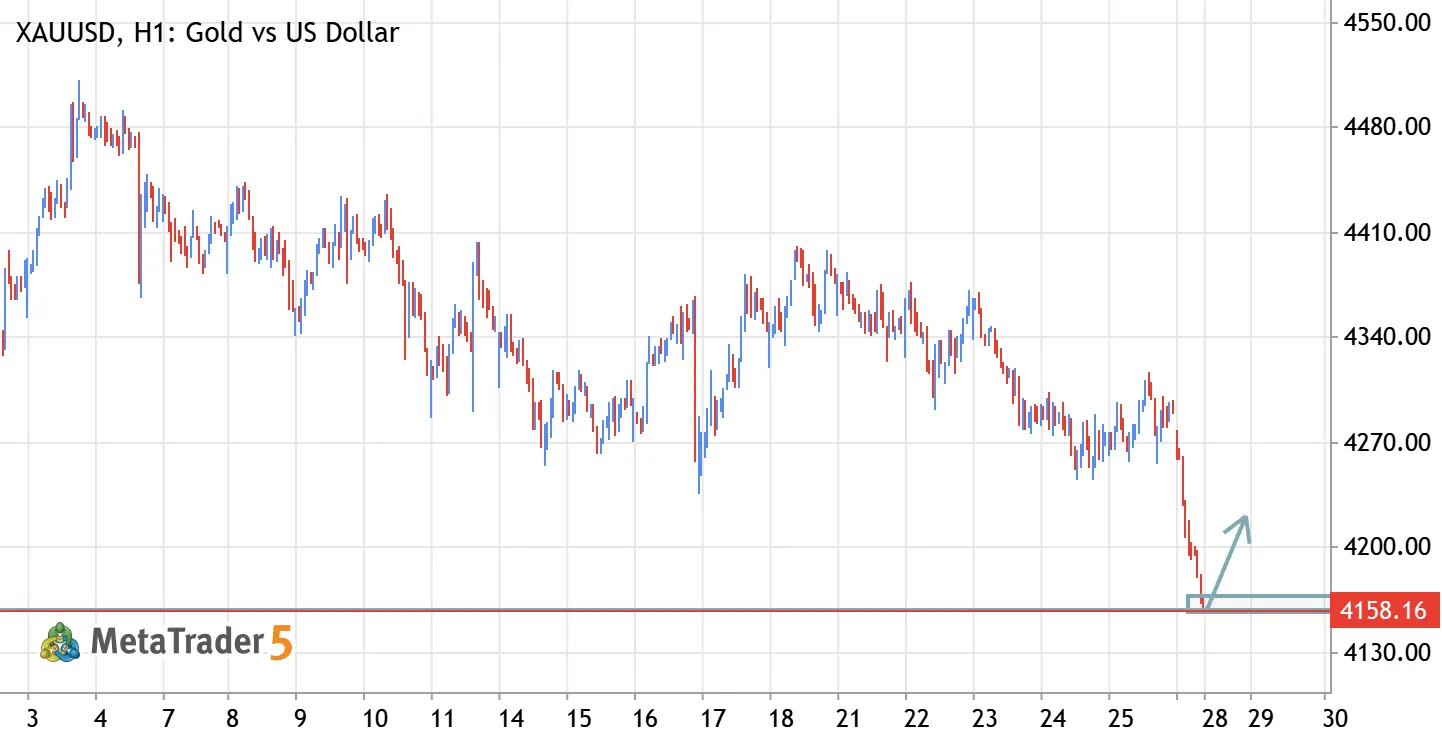
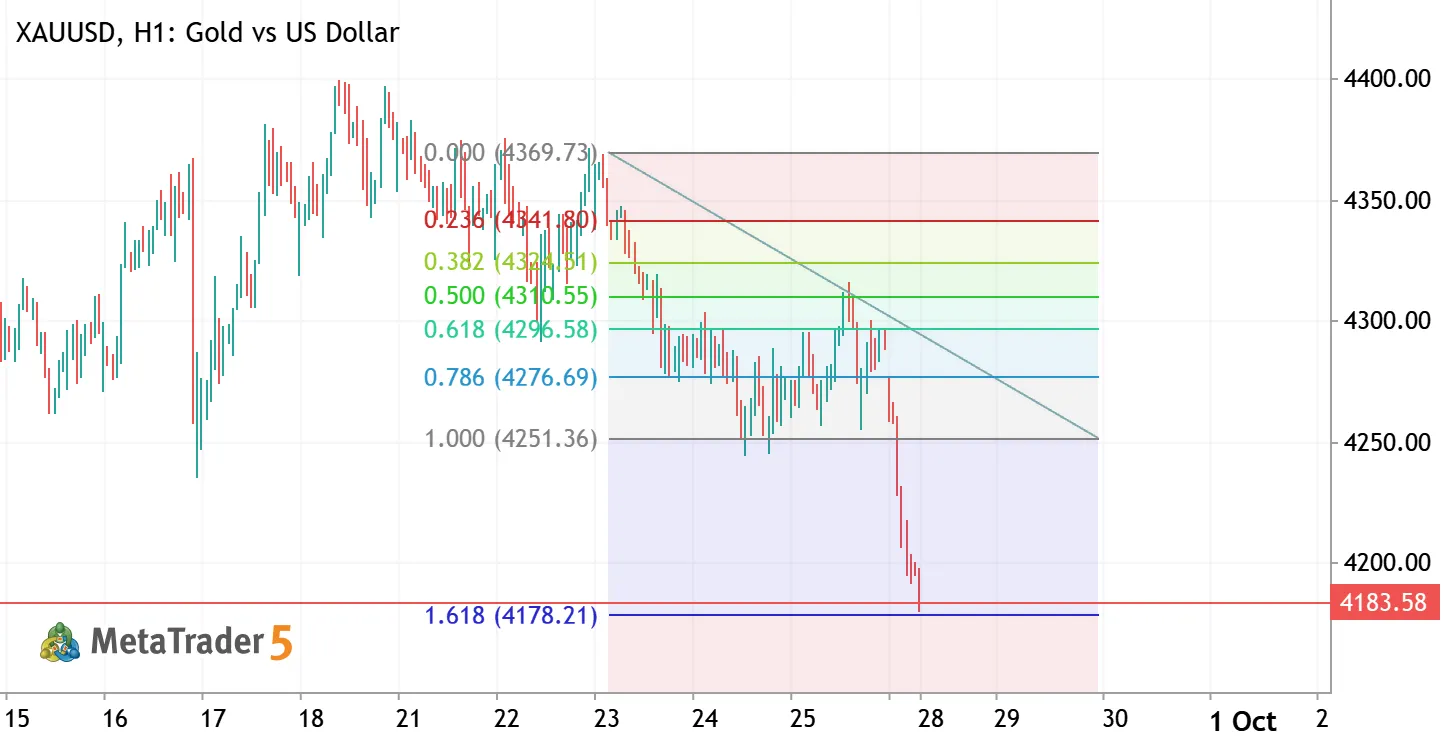
📉 Market Structure: Bearish Clear downtrend (lower highs + lower lows) Price is consistently respecting a descending structure No strong bullish reversal yet 👉 This is not a ranging market — it’s trending down 🔍 What Just Happened Price dropped strongly into a support zone (~4510–4520) Small bounce/rejection from that level Currently weak consolidation after a drop 👉 That bounce looks like a pullback, not a reversal (for now) 📊 Key Zones 🔴 Resistance (Sell Areas) 4550 – 4580 → recent lower high zone 4600+ → stronger supply if price pushes higher 🟢 Support (Buy Reaction Zones) 4500 – 4520 → current support Break below → next likely drop continues ⚠️ Important Signal 👉 The last move: Strong bearish push Weak bullish correction This usually means: Sellers are still in control 📉
2026.05.05 01:09 0
XAUUSD Next Target XAUUSD Short Gold vs US Dollar
XAUUSD Next Target
📊 Market Structure Market recently made a CHoCH (Change of Character) → signals shift from bullish → bearish. Before that, there was BOS (Break of Structure) to upside, but momentum is now weakening. Current price is forming lower highs → early bearish confirmation. 📉 Trend Bias: SELL (Short-Term) Price rejected from recent swing high (~4620 zone) Now moving inside a descending structure Your drawn trendline break also supports downside 🔑 Key Zones 🔴 Supply / Resistance Zone: 4600 – 4620 👉 Strong rejection area (sell zone) 🔵 Demand / Support Zone: 4550 – 4520 👉 Liquidity zone + previous base 🎯 Trade Setup (MetaTrader Style) 📉 SELL Entry: 4602 – 4607 (retest area) 🎯 Take Profits: TP1: 4590 TP2: 4580 TP3: 4550 🚫 Stop Loss: 4625 🧠 Logic Behind Trade CHoCH confirms bearish shift
2026.05.04 02:49 1
XAU/USD(Gold vs.UD Dollar) H1 Chart XAUUSD Short Gold vs US Dollar
XAU/USD(Gold vs.UD Dollar) H1 Chart
The chart shows a significant shift in market sentiment over the last few trading sessions: ​Bearish Breakout: After a period of consolidation between April 23rd and 28th, the price experienced a sharp breakdown below the previous support level (indicated by the horizontal red line around 4613.00). ​Trendline Interaction: There is a long-term ascending trendline (the blue diagonal line). The price has recently broken below this trendline, retested it from underneath, and failed to reclaim it, which is a classic technical signal for a trend reversal or a deeper correction. ​Current Momentum: The price is currently trading near 4603.38. After hitting a recent swing low near 4595, the market is seeing a minor corrective bounce, but the overall immediate structure remains bearish as long as it
2026.05.04 01:29 0
Gold Approaching Major Resistance – Potential Sell Setup XAUUSD Gold vs US Dollar
Gold Approaching Major Resistance – Potential Sell Setup
XAUUSD GOLD ANALYSIS (XAUUSD) Gold reacted strongly from the 4560 support zone and respected the rising trendline perfectly. Current price action shows bullish recovery momentum after sweeping liquidity from the lows. 📌 Key Support Zones: • 4560 – 4550 • 4540 major support 📌 Bullish Scenario: If price holds above 4590–4600, gold may continue pushing higher toward: 🎯 Targets: • 4610 • 4625 • 4635 • 4650 (major liquidity zone) 📌 Bearish Scenario: If gold fails to sustain above 4600 and breaks below 4560, bearish pressure can return with possible downside toward 4540.
0
B Bellaa10 2026.05.03 08:58
Market Structure (H4 – XAUUSD) XAUUSD Short Gold vs US Dollar
Market Structure (H4 – XAUUSD)
Gold (XAUUSD) Analysis Gold is trading inside a descending channel, confirming a sustained bearish trend with clear lower highs and lower lows. The price is currently testing the upper boundary of the channel, aligned with a horizontal resistance zone, creating strong confluence for a potential rejection. The Stochastic oscillator is turning down from the overbought zone, signaling increasing selling pressure. We are considering selling XAUUSD on rejection from 4615–4620; Target 1: 4510 Target 2: 4480 A confirmed breakout above the channel resistance would invalidate the bearish setup
0
XKing05 ArmanFx Trader 2026.05.01 06:03
XAGUSDN D1 Analysis XAGUSD Silver vs US Dollar
XAGUSDN D1 Analysis
Price is currently moving under a strong descending trendline, showing clear bearish pressure. Market also got rejected from a key resistance zone and is now consolidating. 🔻 Bias: Bearish 📉 Structure: Lower highs + trendline resistance 📍 Key Resistance: Trendline + horizontal zone 📍 Key Support: Recent low area below current price Outlook: If price stays below the trendline, a breakdown is likely, targeting the next support zone. Only a strong breakout above trendline would shift momentum bullish.
0
XKing05 ArmanFx Trader 2026.04.27 06:34