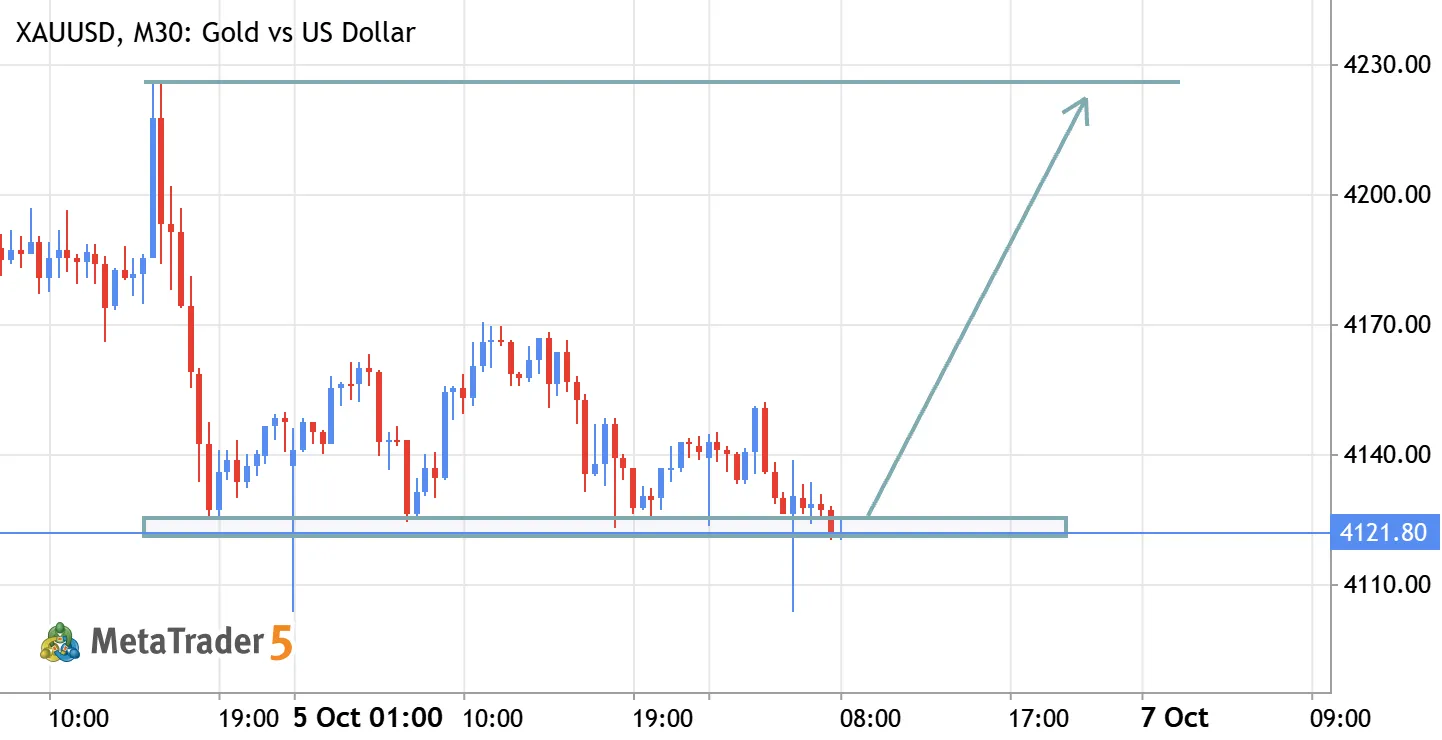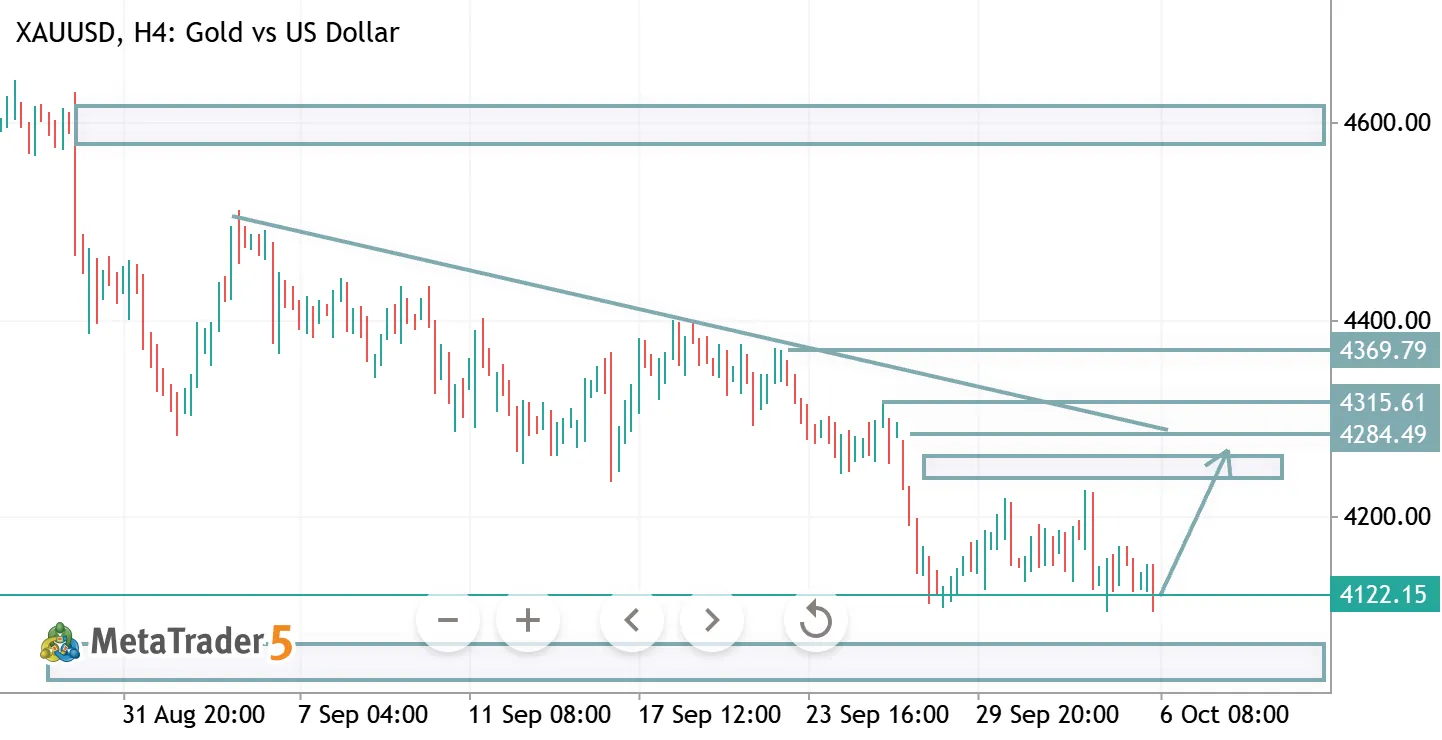
XUUUSD CHART ANALYSIS XAUUSD Short Gold vs US Dollar

XUUUSD CHART ANALYSIS

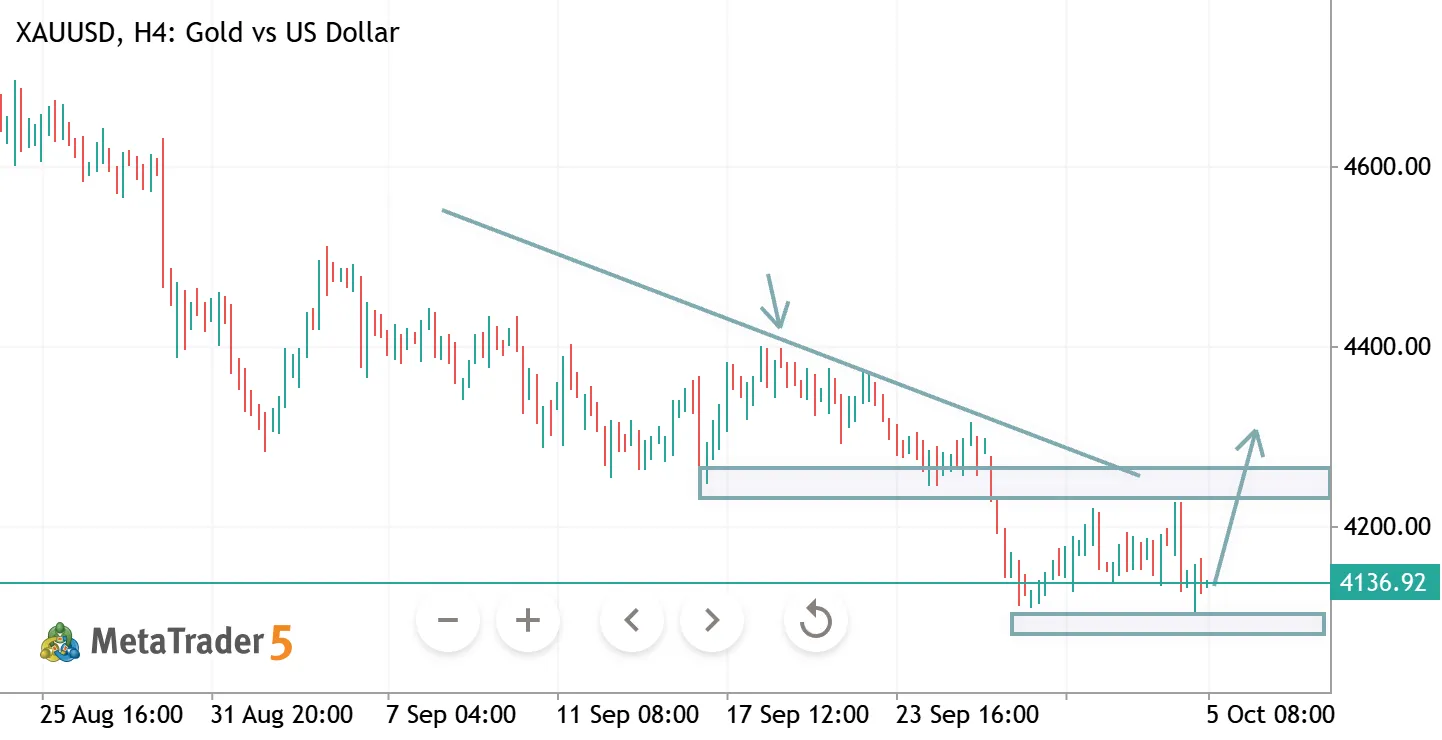
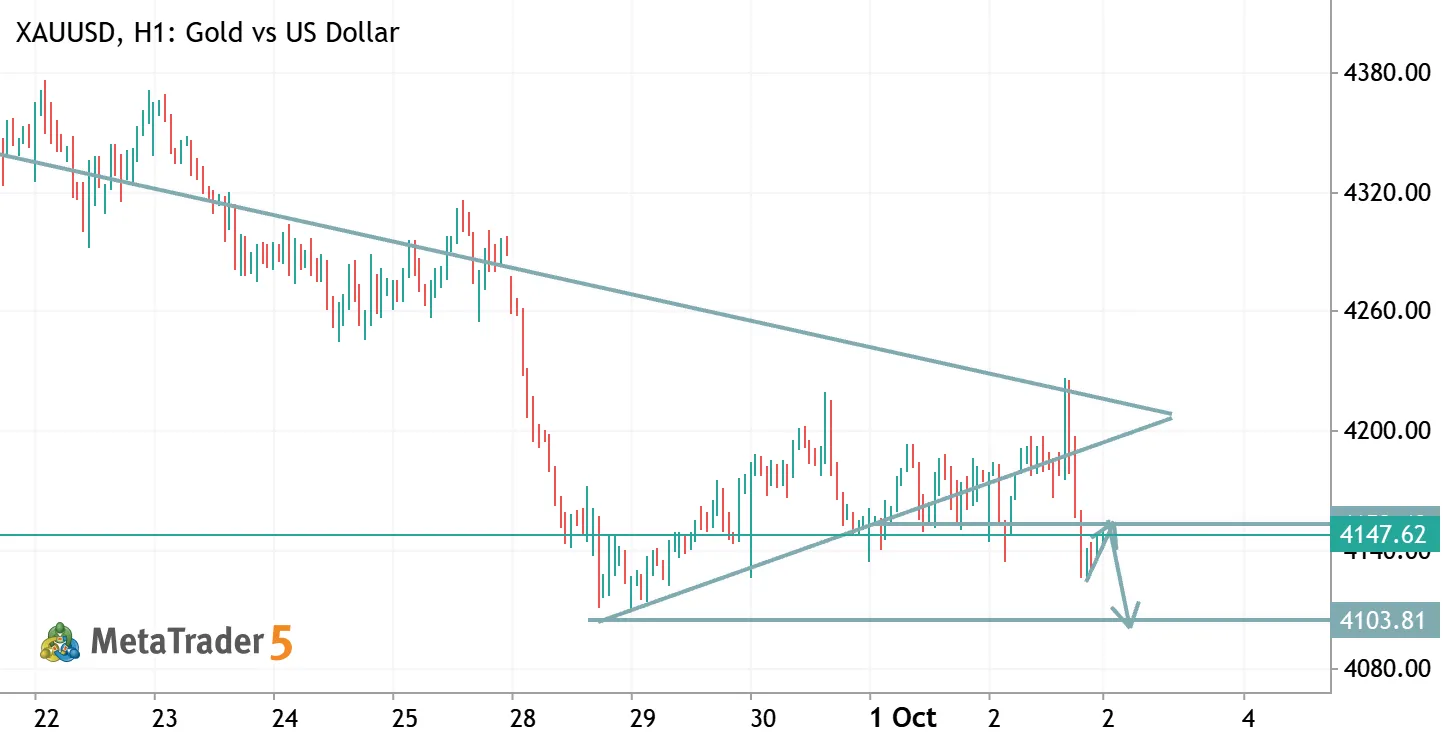
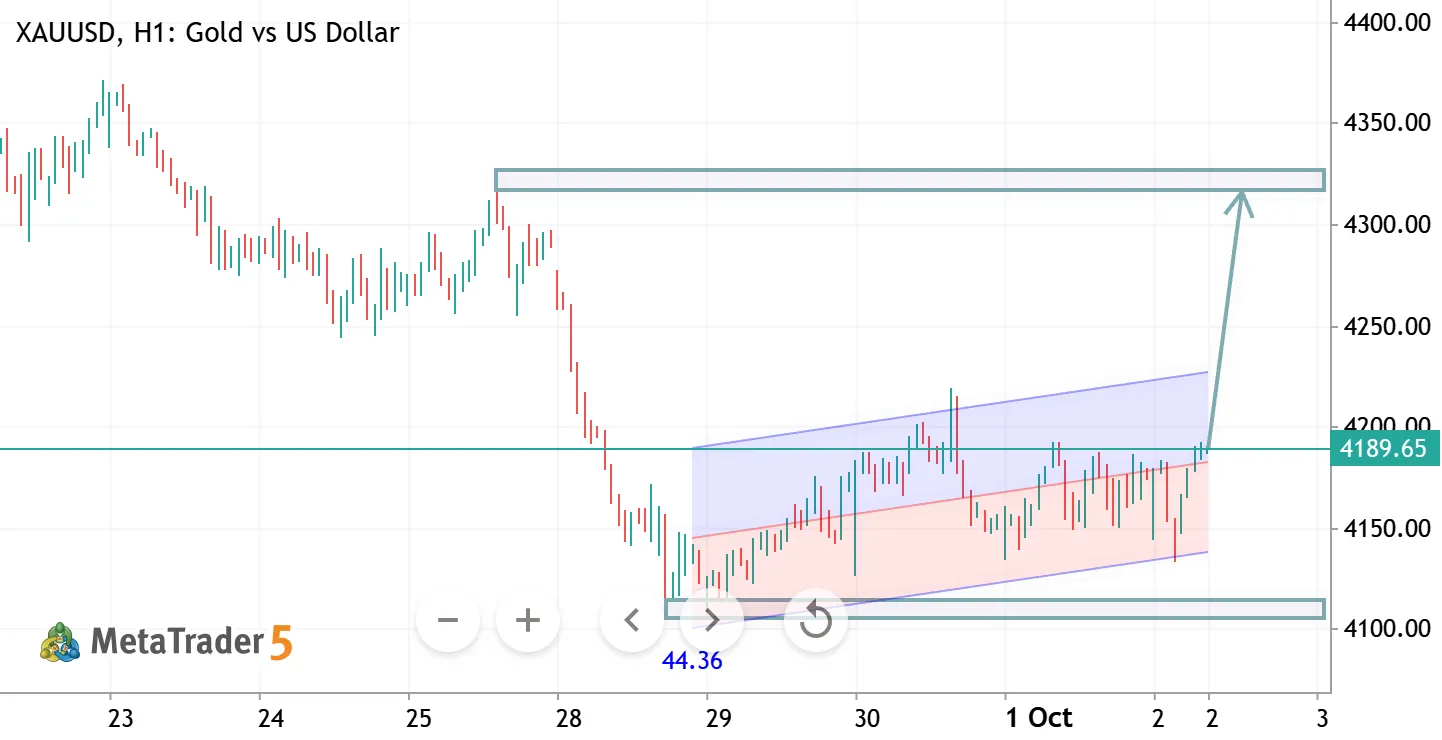
—XAUUSD Chart Analysis** Gold is moving inside an ascending channel, forming higher highs and higher lows after recovering from the marked horizontal support. Price is now near the channel’s upper boundary, where rejection or a pullback is possible. -Bullish scenario:As long as the lower channel boundary holds, the upward structure remains intact. A confirmed breakout above the upper boundary, followed by a successful retest, would favour further upside. - Bearish scenario: A clear candle close below the lower channel boundary, followed by a failed retest, would support a deeper correction toward the horizontal support marked on your chart. - Confirmation matters: The downward arrow shows a possible move—not a confirmed sell signal. Selling before the channel breaks would be trading

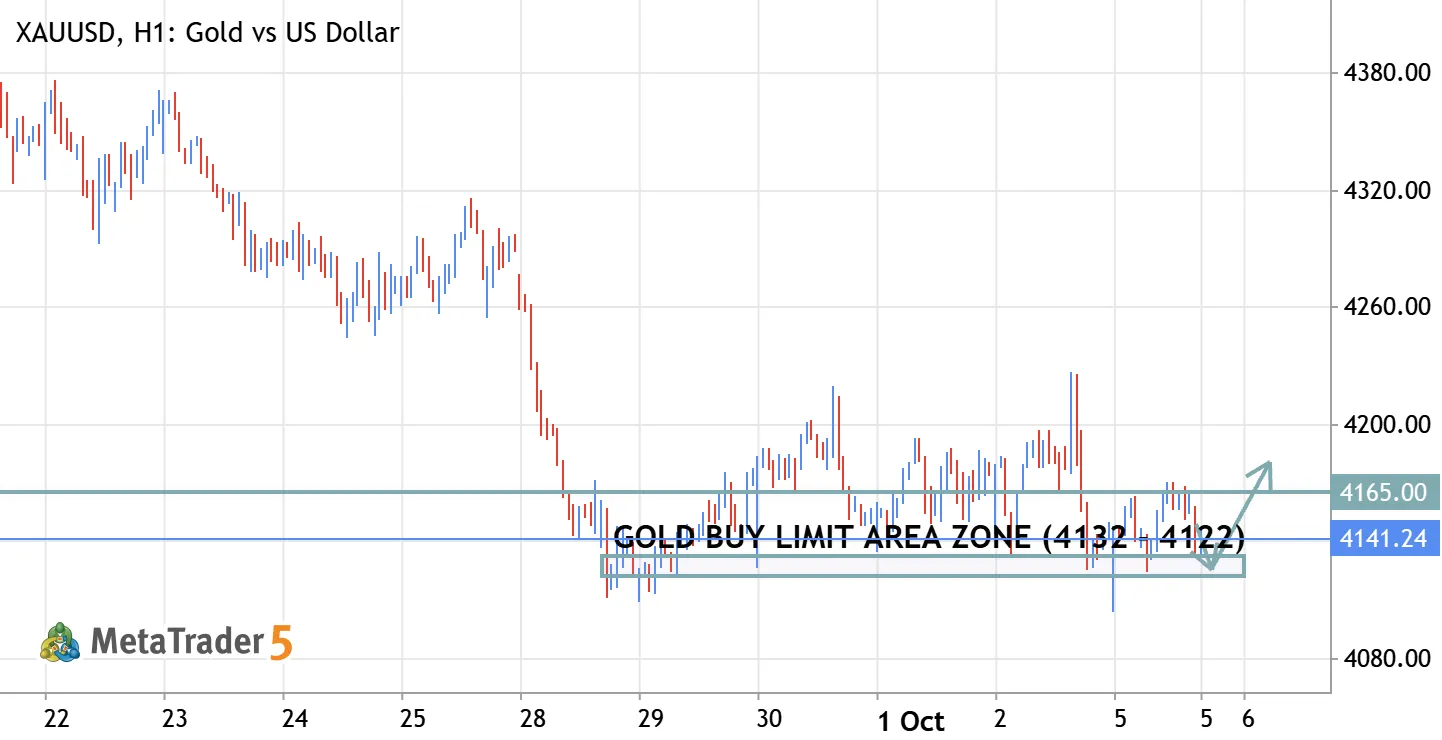
XAU/USD (Gold) – Buy Zone Limit Area XAUUSD Long Gold vs US Dollar

XAU/USD (Gold) – Buy Zone Limit Area

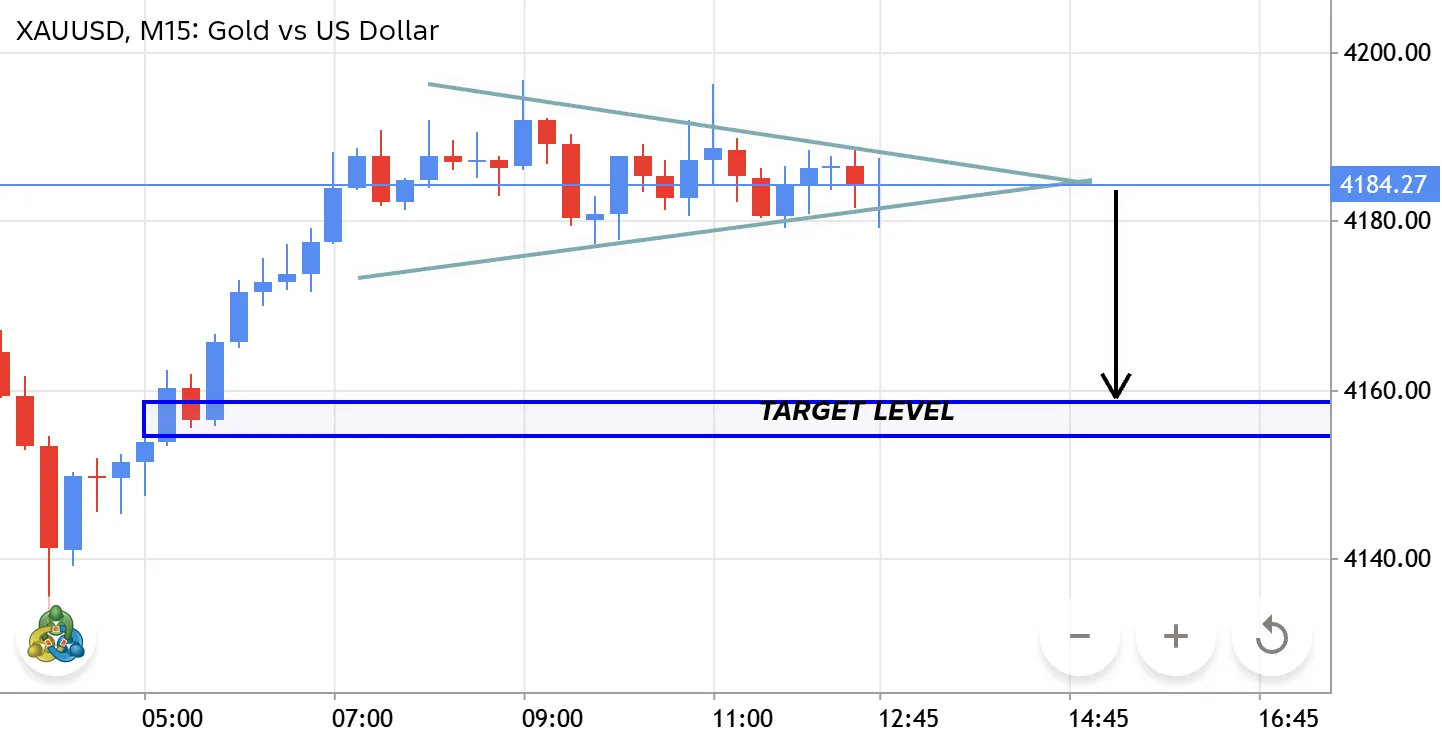
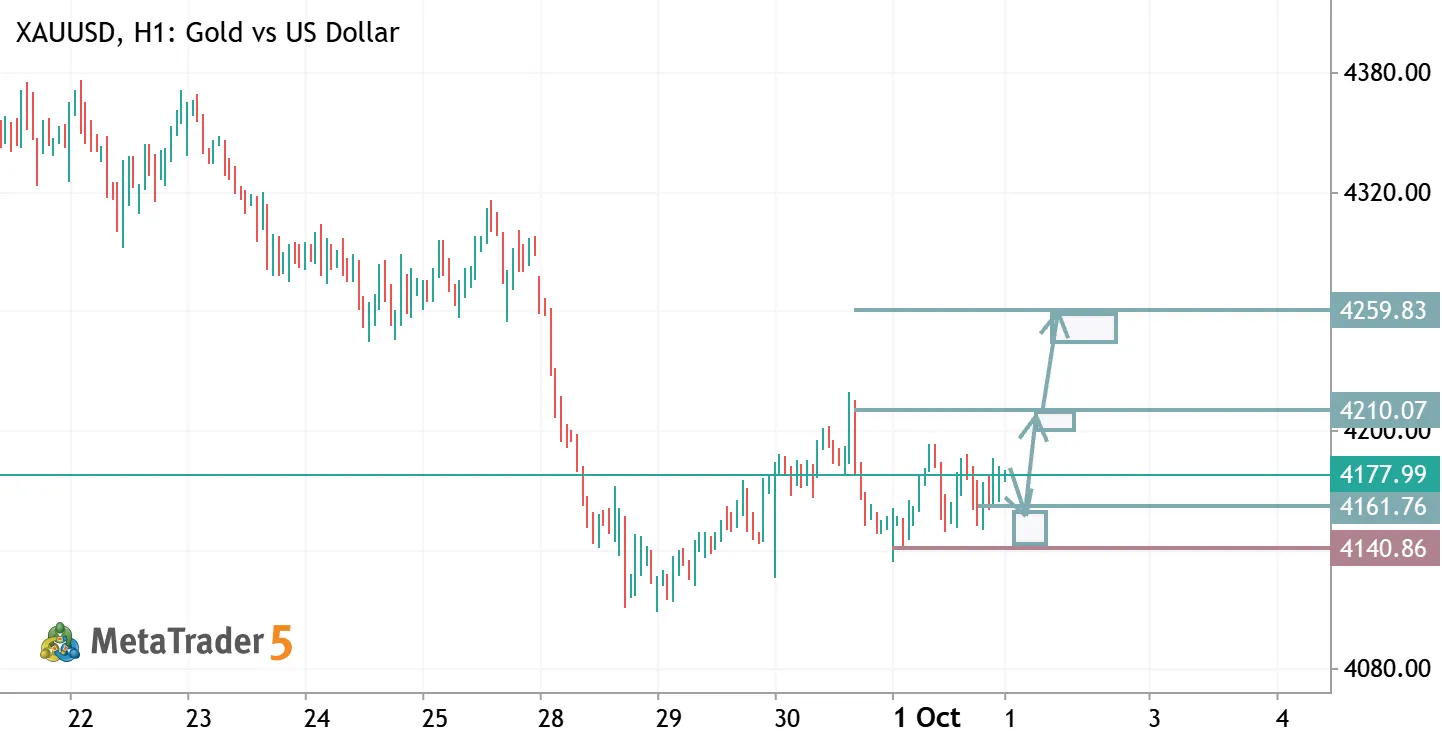
🟢 XAU/USD Buy Limit Signal Buy Zone: 4132 – 4122 Stop Loss: 4105 Take Profit 1: 4140 Take Profit 2: 4160 Take Profit 3: 4180 Open Target: Open 📚 Educational Market Idea: Gold is expected to test the 4132–4122 area, which may act as a potential support zone. The Buy Limit setup is designed to catch a bullish reaction from this area. If price holds the zone and buyers step in with bullish price action, Gold could move toward 4140, followed by 4160 and 4180. Wait for confirmation around the entry zone, such as a strong bullish candle, bullish engulfing pattern, or a clear recovery in price action before adding further risk. 📌 Trade Management: Consider securing partial profits at TP1 and TP2. After TP1, consider protecting the position by moving SL toward breakeven. The remaining position
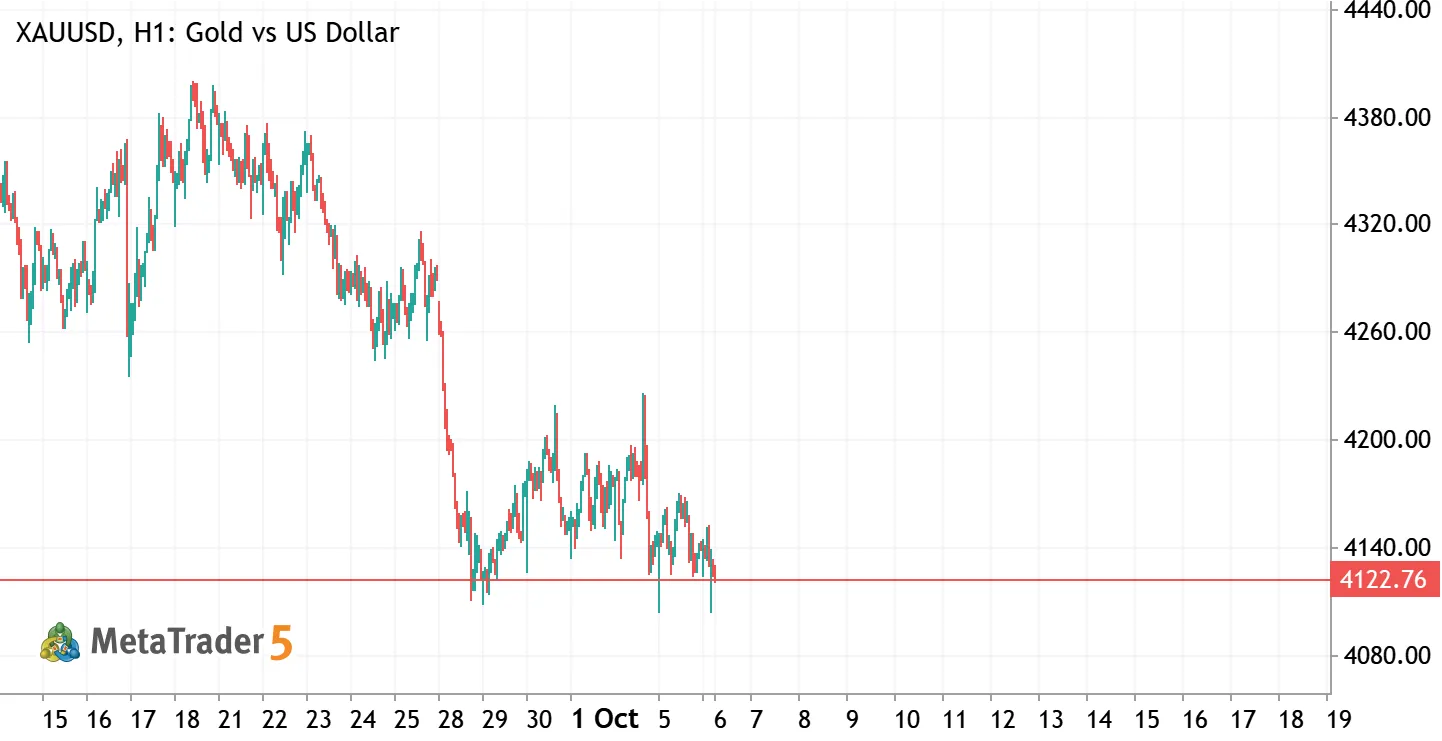
XAUUSD - Potensi Pullback ke Zona Buy Sebelum Bearish Continuation? XAUUSD Gold vs US Dollar

XAUUSD - Potensi Pullback ke Zona Buy Sebelum Bearish Continuation?

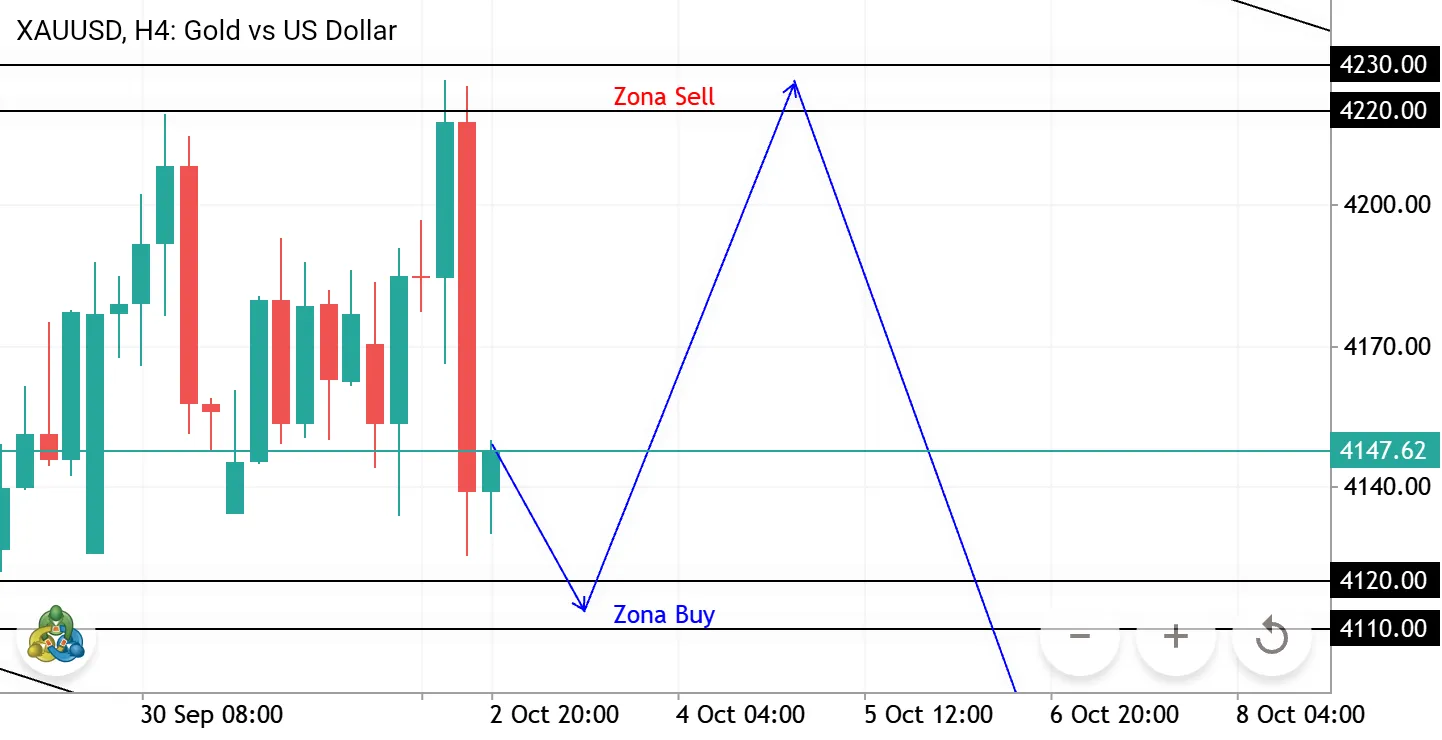
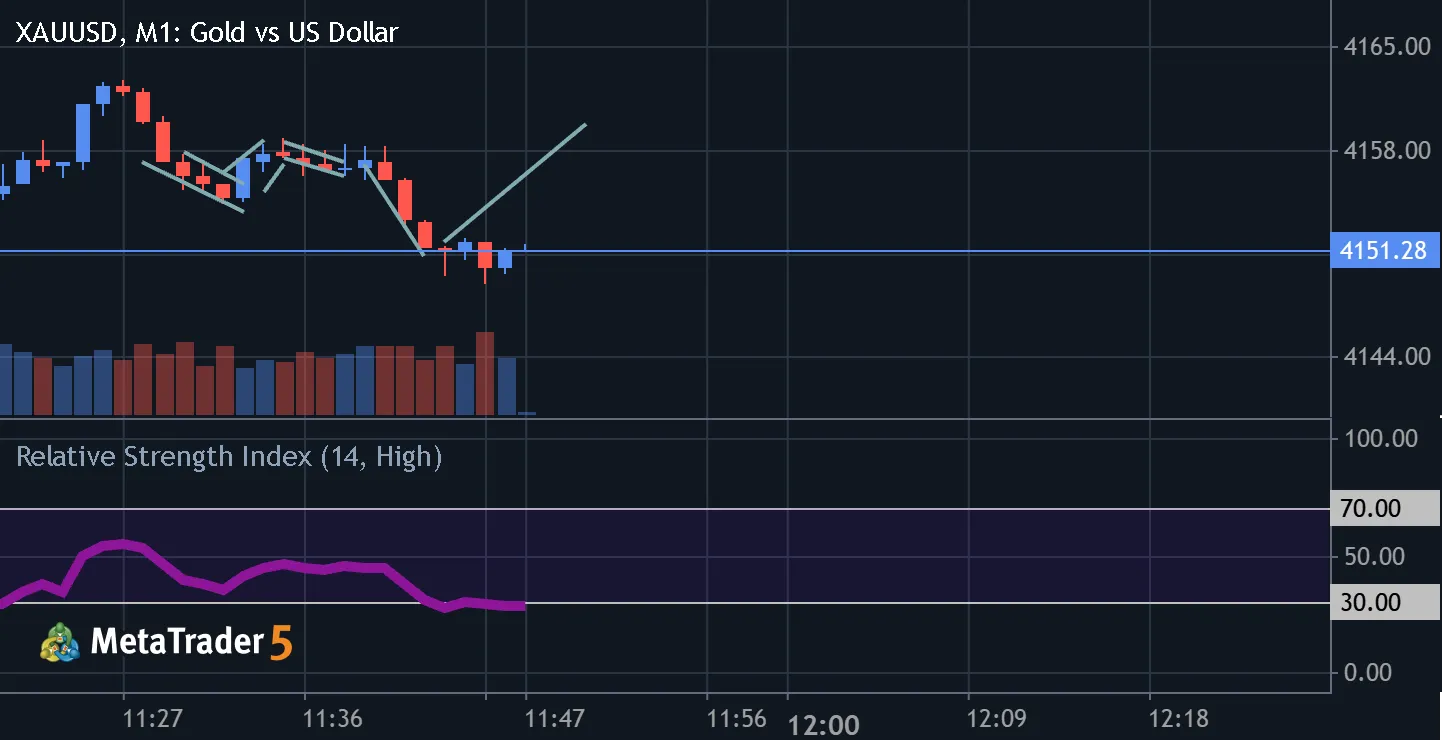
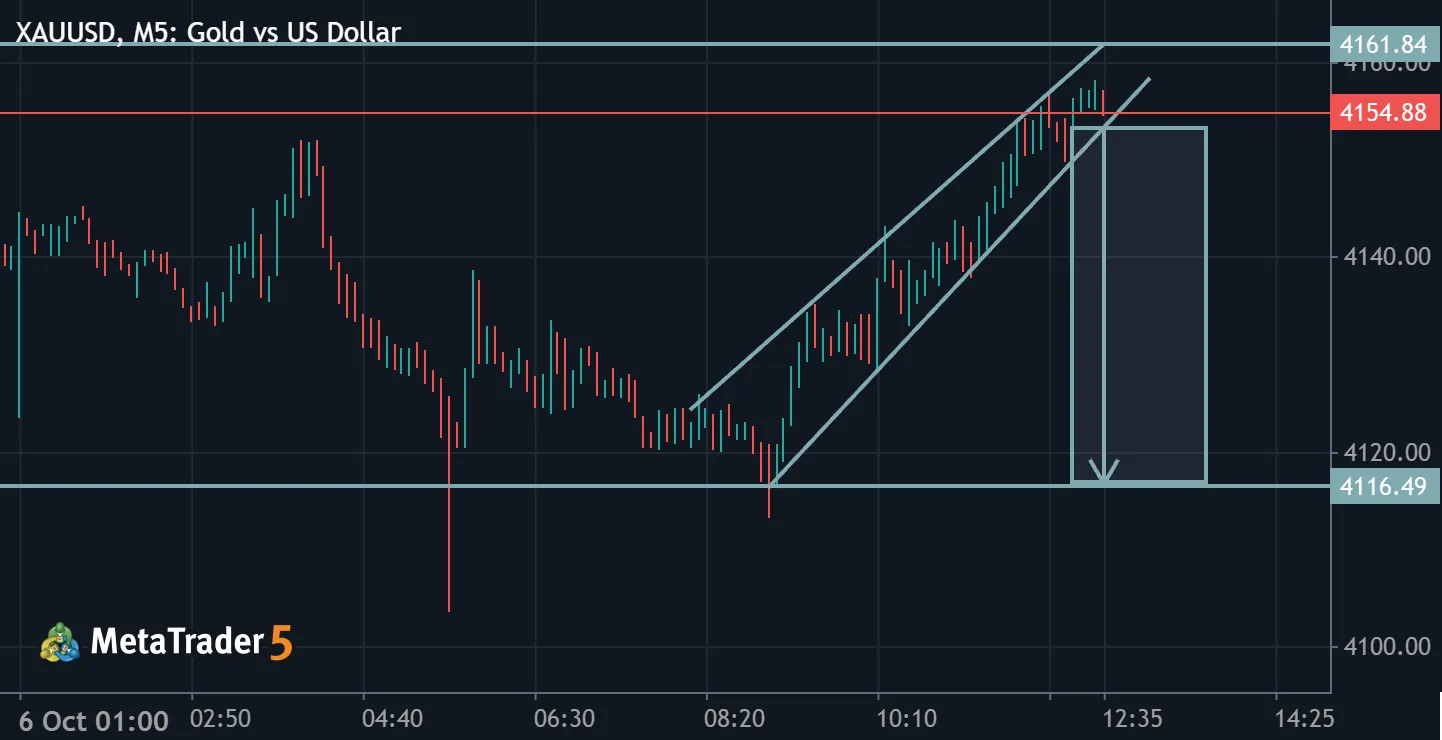
XAUUSD - Potensi Pullback ke Zona Buy Sebelum Bearish Continuation? XAUUSD - H4 MARKET ANALYSIS Pada timeframe H4, XAUUSD masih menunjukkan struktur pergerakan yang cenderung bearish. Harga mengalami penurunan cukup signifikan dan saat ini bergerak di area 4.138. Saya melihat adanya peluang pergerakan korektif sebelum harga melanjutkan penurunan. Skenario yang saya perhatikan: 1.Zona Buy: 4.110-4.120 Area ini menjadi support potensial yang perlu diperhatikan. Saya menunggu reaksi harga di zona ini untuk melihat apakah terdapat penolakan harga (rejection) yang dapat mendorong terjadinya pullback bullish. 2.Zona Sell: 4.220-4.230 Apabila harga berhasil memantul dari zona Buy, area 4.220-4.230 menjadi resistance potensial sekaligus area yang perlu diperhatikan untuk mencari konfirmasi peluang