
Ethereum is pushing back toward $2,400 as the market finds its footing after weeks of uncertainty, with buyers gradually reasserting control and the price beginning to build momentum from the consolidation range. The move higher is drawing attention — and a CryptoQuant analyst has identified a signal in the demand data that suggests the current strength may have more institutional backing than the price chart alone reveals.
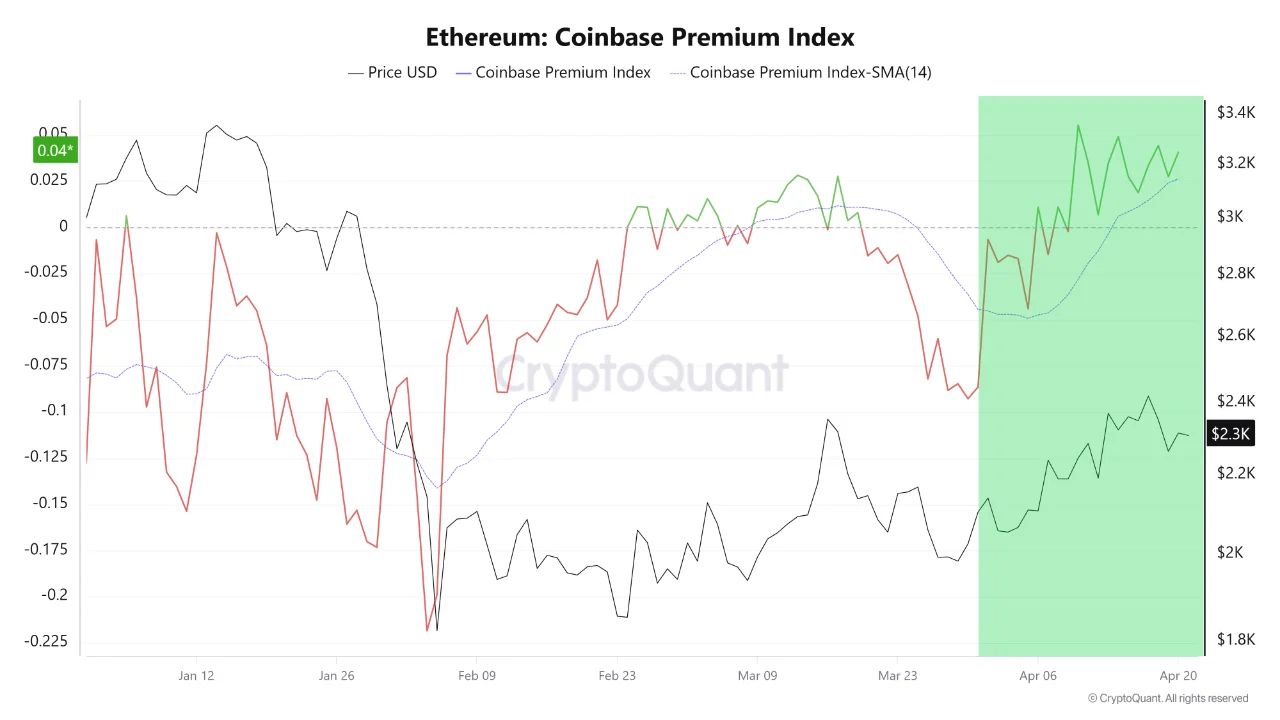
The Coinbase Premium Index measures the price difference between Ethereum on Coinbase and Ethereum on Binance. When ETH trades at a higher price on Coinbase than on Binance, it reflects stronger demand on the US-based platform — and since Coinbase is the primary venue for American institutional investors and high-net-worth buyers, a sustained positive premium is widely interpreted as a signal that sophisticated, deep-pocketed capital is actively bidding for the asset rather than simply riding broader market momentum.
Right now, the index is not just positive — it is trading above its 14-day moving average, a threshold that historically separates noise from a more sustained shift in institutional demand . That distinction matters because short-lived premium spikes can reflect temporary activity. A reading that holds above its moving average over multiple sessions reflects something more durable: a change in the posture of the participants who tend to move markets rather than follow them.
The Signal Is Still On — and It Has Already Proven Itself
The CryptoQuant analyst’s read on the current setup is straightforward but significant. The Coinbase Premium Index, sitting above its 14-day moving average while holding in positive territory, is not a neutral condition — it reflects US investor sentiment, particularly among whale-sized participants, leaning actively toward buying.
When the largest and most informed buyers on America’s primary institutional venue are paying a premium for Ethereum relative to the global market, it tends to mean something specific: demand is coming from participants who have done the analysis and are positioning with conviction rather than reacting to price.
The track record since this signal triggered makes the current reading more urgent. Ethereum has already rallied 22% from the level where the alarm first fired, pushing as high as $2,400. That move happened while this signal was active. The signal has not turned off.
ETH is currently trading at $2,389 — below that $2,400 high, but within a range that still reflects the structural improvement the signal identified. The analyst’s framework is precise about what to watch: as long as the Coinbase Premium Index holds in positive territory and remains above its 14-day moving average, the conditions that produced the initial 22% rally remain intact.
The setup is not guaranteed to continue. No signal is. But the specific condition that drove the most recent leg of Ethereum’s recovery is still present — and until it turns, the weight of the evidence points in one direction.
Ethereum Presses Into Resistance
Ethereum is trading just below the $2,400 level after a steady recovery from the February capitulation, where price briefly dipped into the $1,800 range. The current structure shows a clear transition from impulsive selling to controlled upward movement, with ETH forming higher lows and gradually reclaiming short-term momentum.
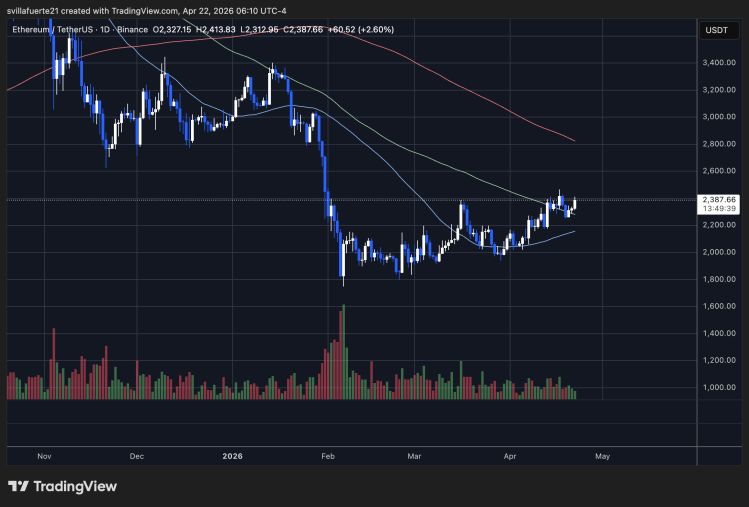
The key technical development is the interaction with the 50-day moving average, which price has now reclaimed and is attempting to hold as support. This marks a shift from the earlier phase of the downtrend, where the same level consistently acted as resistance. However, the broader context remains unresolved. The 100-day and 200-day moving averages are still trending downward above the current price, creating a layered resistance zone between $2,400 and $2,800.
Price action reflects this tension. Each push higher is being met with supply, particularly as ETH approaches the $2,400 region, suggesting that market participants who were trapped during the earlier breakdown are using this recovery to exit positions.
Volume dynamics reinforce the interpretation. The February spike signals forced liquidations, while the current advance is unfolding on declining participation, indicating a lack of aggressive follow-through.
Featured image from ChatGPT, chart from TradingView.com