Crypto analyst Cyclop has provided insights into when the Bitcoin price could hit a new all-time high (ATH) above $120,000. This came as the analyst alluded to historical data indicating that BTC could bottom in this bear cycle by the last quarter of this year.
Analyst Reveals When Bitcoin Price Will Hit New ATH Based On Historical Data
In an X post , Cyclop alluded to historical BTC cycles to show when the Bitcoin price will hit a new all-time high. He noted that between 2015 and 2017, BTC enjoyed a bull run for 1,065 days, while between 2017 and 2018, it took 365 days for BTC to bottom in the bear market . Similarly, BTC enjoyed another bull run lasting 1,065 days between 2018 and 2021 before entering a bear market that lasted 365 days.
Furthermore, between 2022 and 2025, the Bitcoin price experienced another bull run lasting 1,065 days, with BTC rallying to an ATH of 126,000. The leading crypto then topped in October 2025 and has since been in a bear market. Based on this historical data, BTC may be on course to be in this bear market until October 5, which will complete the 365-day cycle.
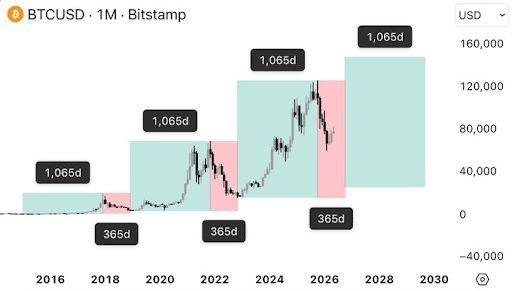
The analyst’s accompanying chart showed that the Bitcoin price could rally to between $140,000 and $150,000 in the next bull run before the leading crypto tops in 2030 and enters another bear market. Meanwhile, this historical data suggests that the Bitcoin bottom isn’t in, despite BTC’s recent rally above $80,000. Bitcoin is once again in a downtrend amid inflation concerns and fears that the U.S.-Iran war could begin soon following stalled peace talks.
BTC Local Top Is In
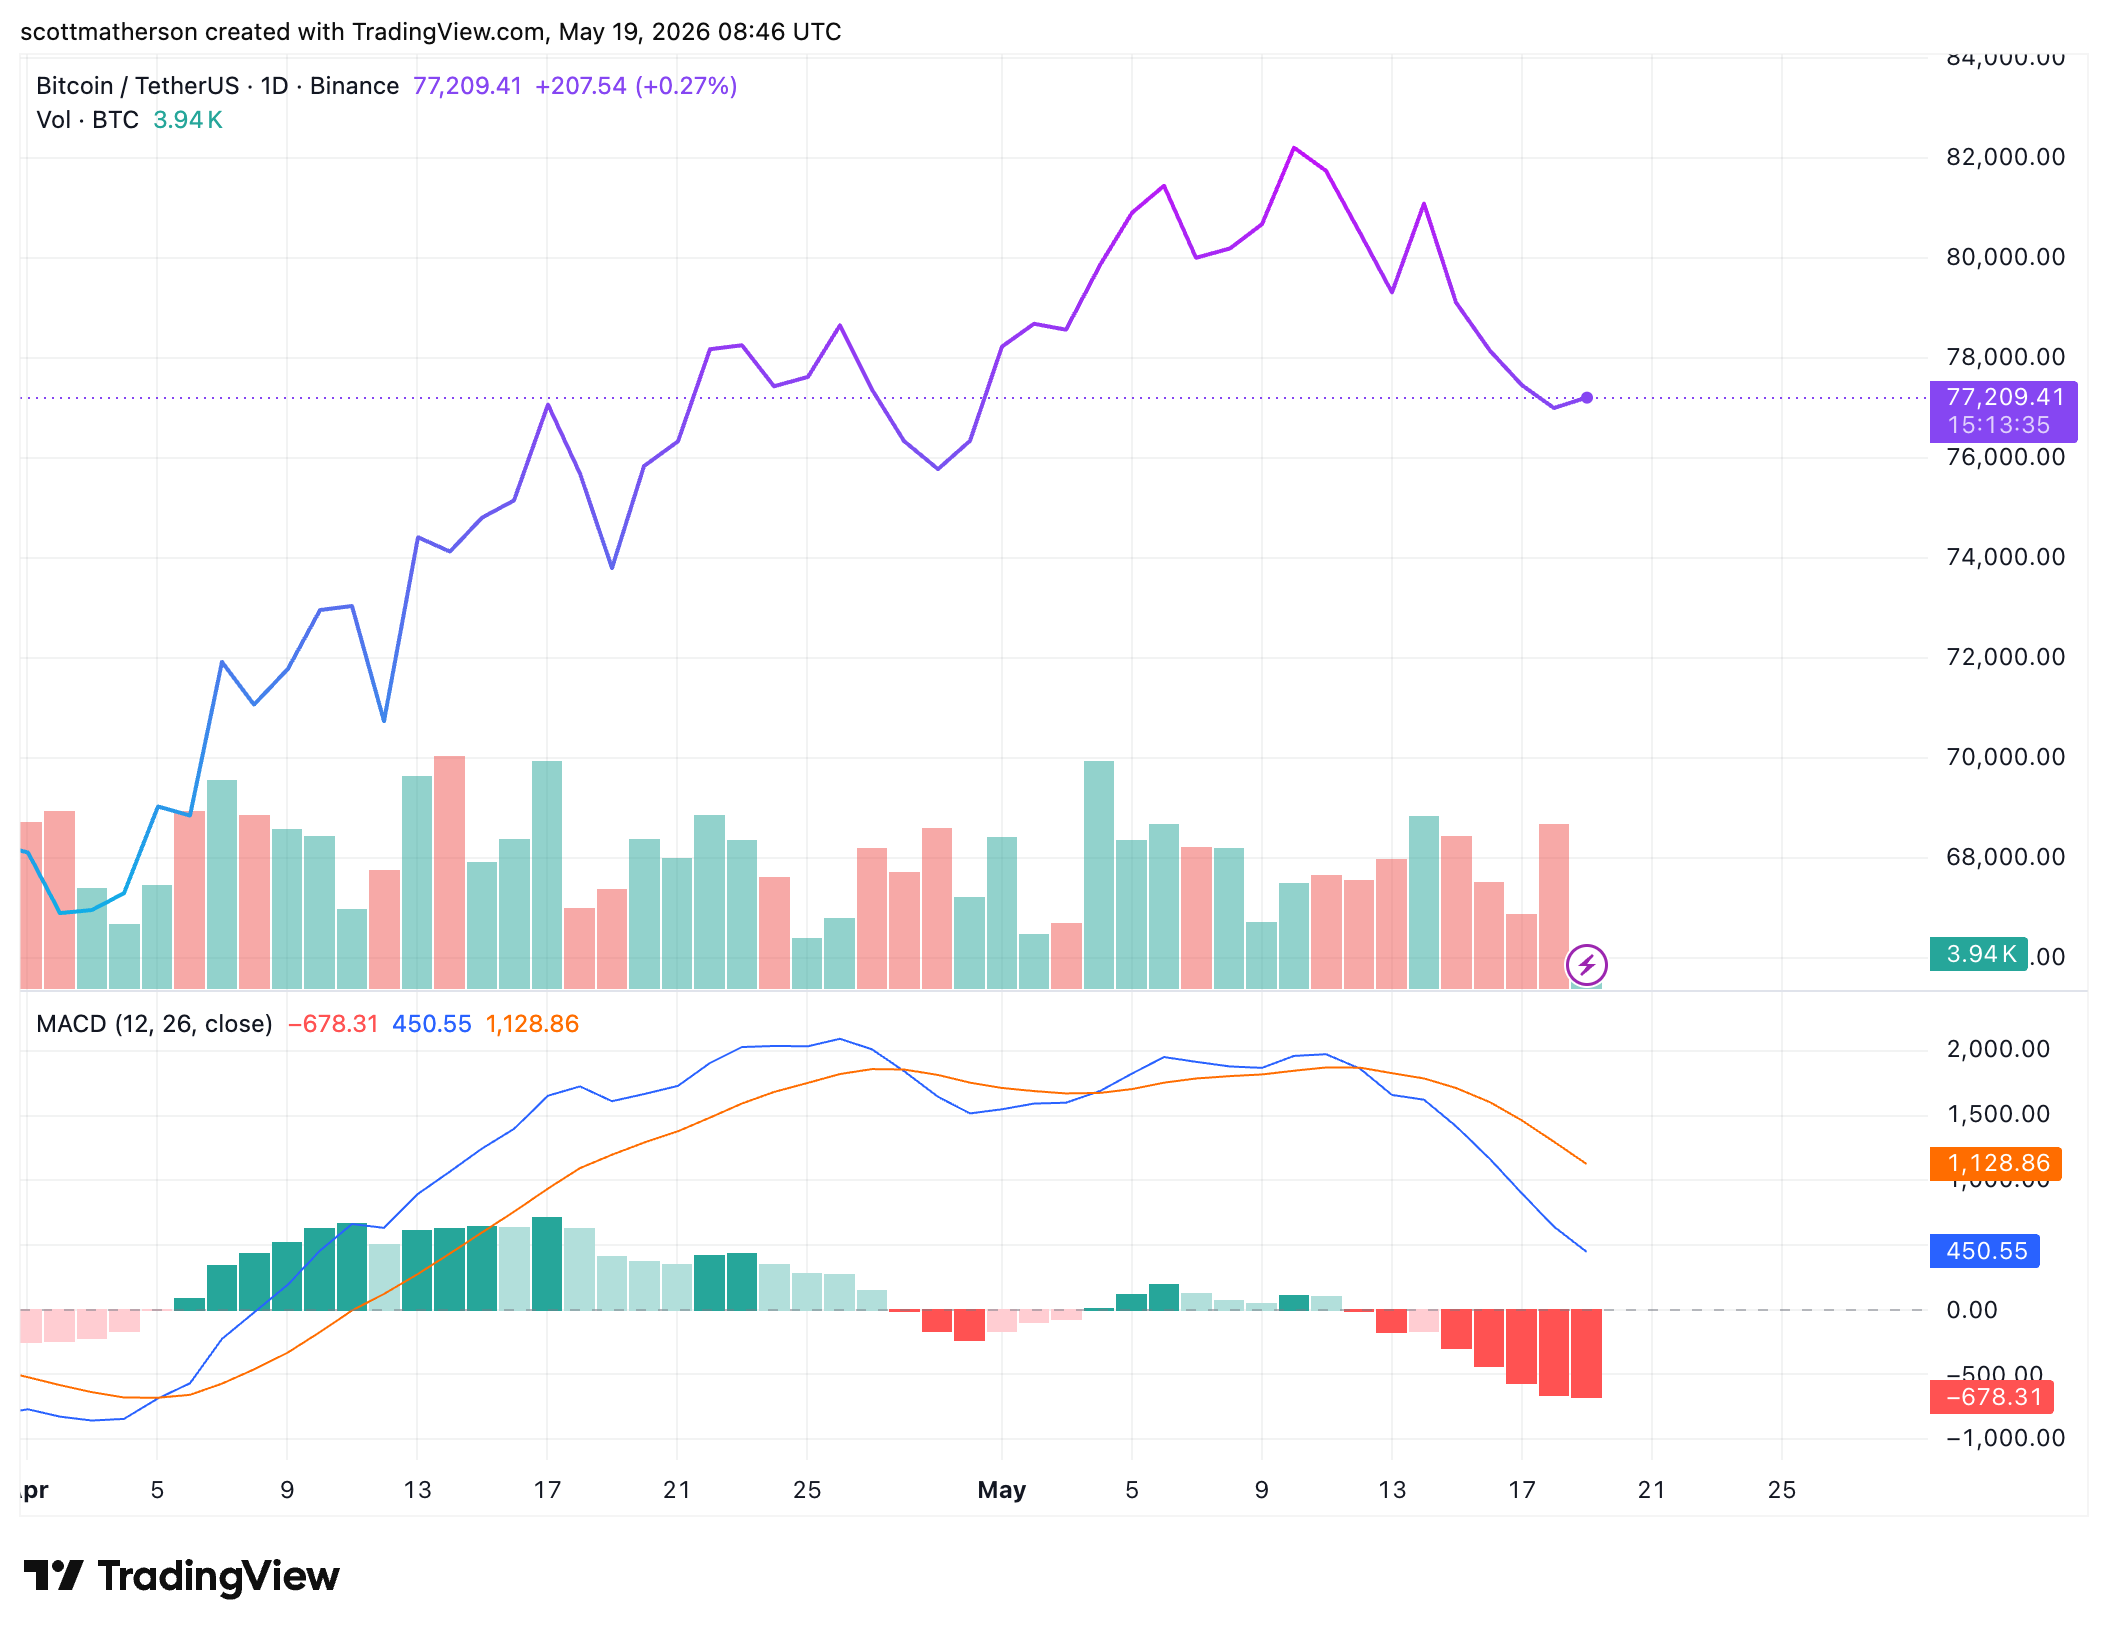
Crypto analyst Colin stated that the local top is in for the Bitcoin price, with BTC now eyeing new lows. He noted how the current price action is bearish as the leading crypto rejected the upper channel of a trend line, the 200-moving average , and the underside of the trend line. This underside has been respected as both resistance and support many times, but has now broken to the downside.
In another X post , Colin echoed Cyclop’s sentiments, noting that on a purely time basis, it is extremely unlikely that the BTC borrow was in just after four months, since the Bitcoin price topped last October. The analyst had previously stated that BTC could bottom around $40,000 based on historical data, as the lowest decline the crypto asset has ever suffered in a bear market is 77%. Meanwhile, Bitcoin has only seen a 53% drop to the February 2026 low of $60,000.
At the time of writing, the Bitcoin price is trading at around $76,600, down in the last 24 hours, according to data from CoinMarketCap.