BTCUSD H4 ANALYSIS BTCUSD Bitcoin vs US Dollar

BTCUSD H4 ANALYSIS

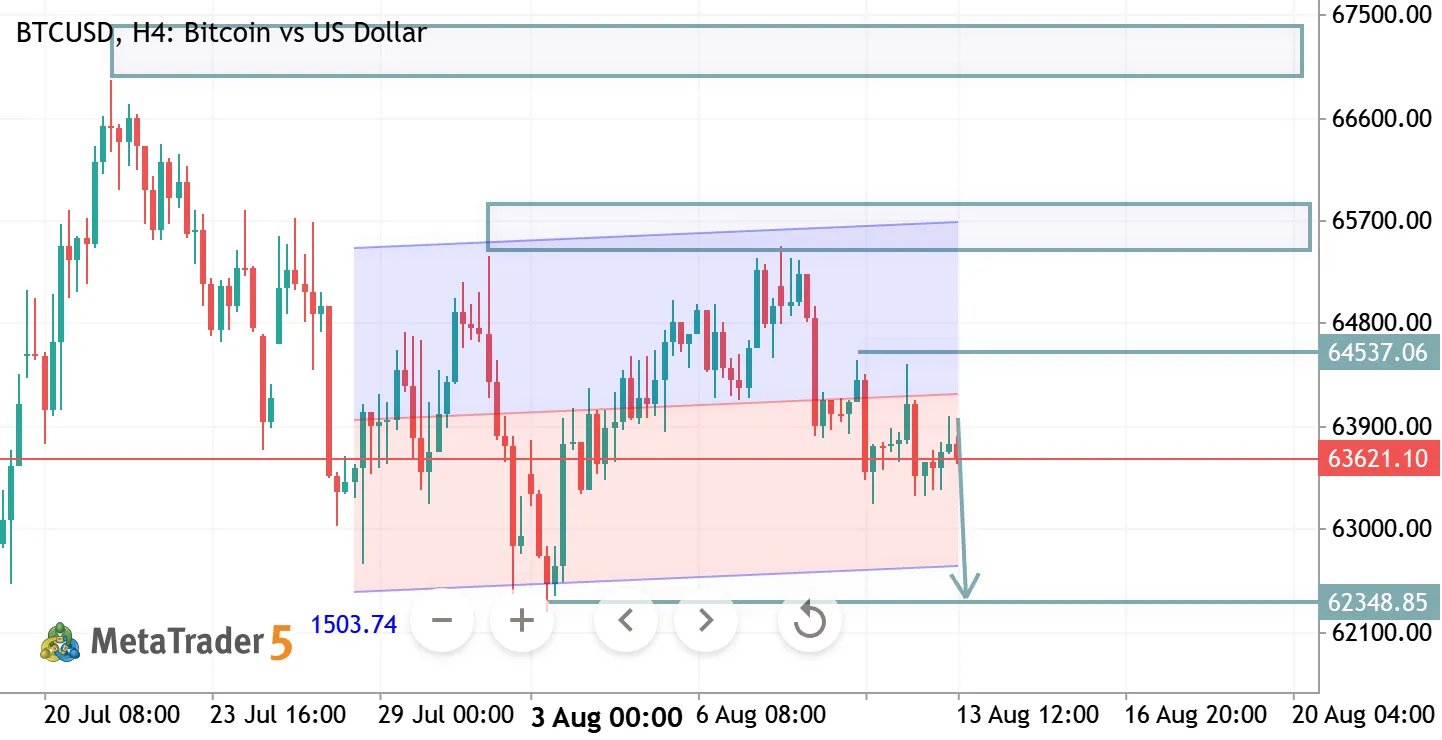
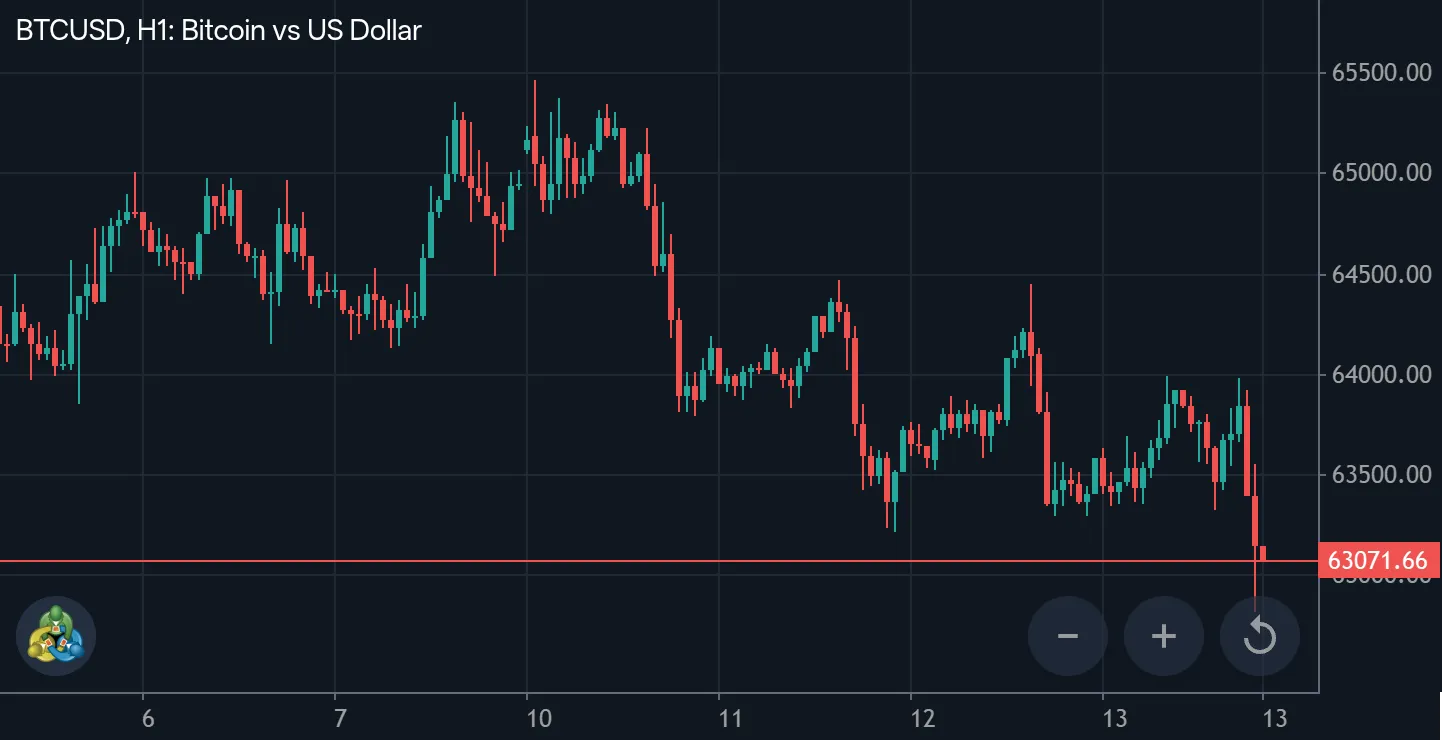
📊 BTCUSD H4 – Technical Analysis Bias: Bearish / Range-bound 📉 BTCUSD is consolidating below the 64,500–66,000 resistance zone. Recent rejection suggests downside pressure remains. 🔹 Resistance: 64,500–66,000 🔹 Support: 62,350 🔹 Bearish Scenario: A break below 63,500 could lead toward 62,350. 🔹 Bullish Invalidation: A strong H4 close above 66,000 may shift momentum bullish. Plan: Wait for confirmation and manage risk carefully. ⚠️ Educational analysis only — not financial advice.
BTCUSD H4 ANALYSIS BTCUSD Bitcoin vs US Dollar

BTCUSD H4 ANALYSIS

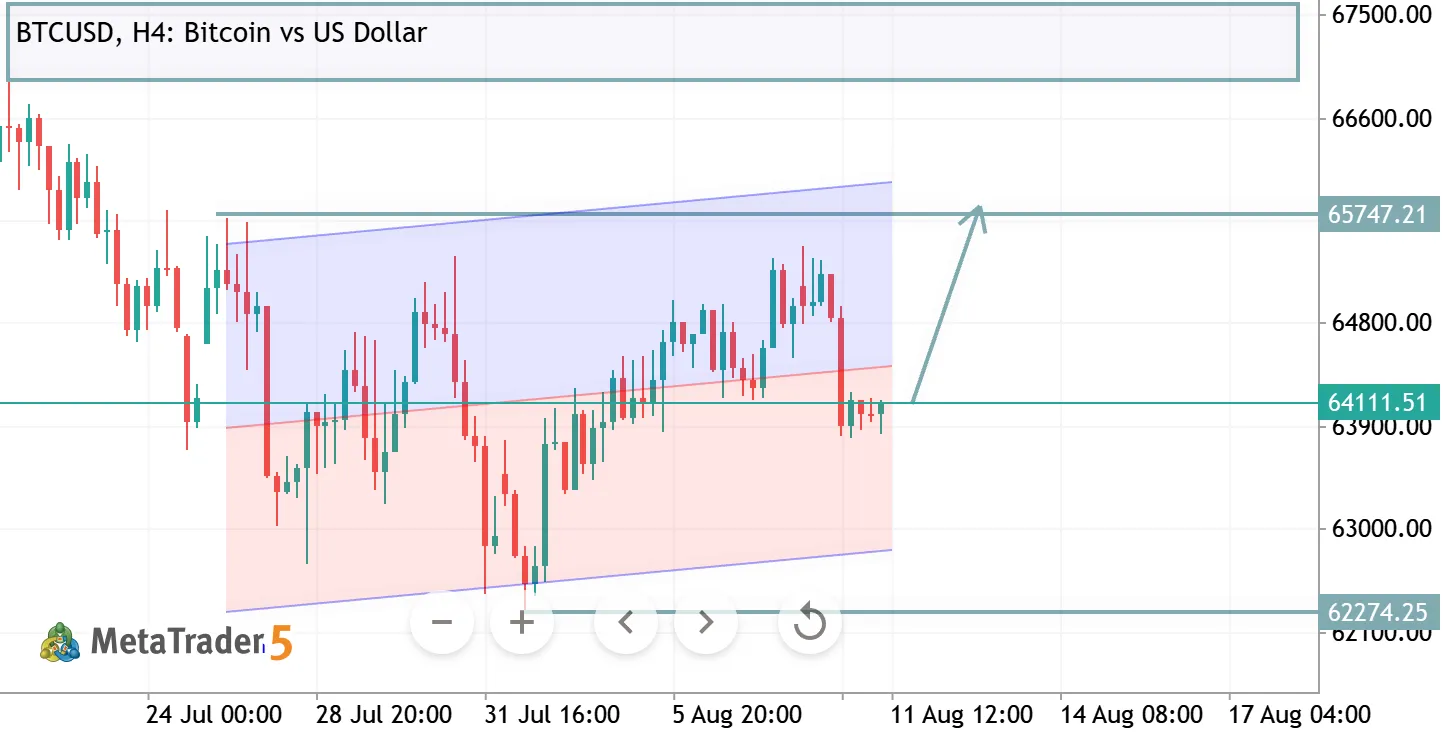
📊 BTCUSD – H4 Analysis 🟢 Bias: Bullish BTCUSD is consolidating inside an ascending structure. Price is holding around 64,100, with buyers defending the lower zone. 🔹 Support: 64,000–63,800 🔹 Major Support: 62,274 🔹 Resistance: 65,747 🚀 A confirmed H4 breakout above 65,747 could open the way toward 66,500–67,000. 📌 Prefer buy-on-dips while price holds above the support zone. ⚠️ Wait for H4 confirmation and use proper risk management.
BTCUSD H4 ANALYSIS BTCUSD Bitcoin vs US Dollar

BTCUSD H4 ANALYSIS

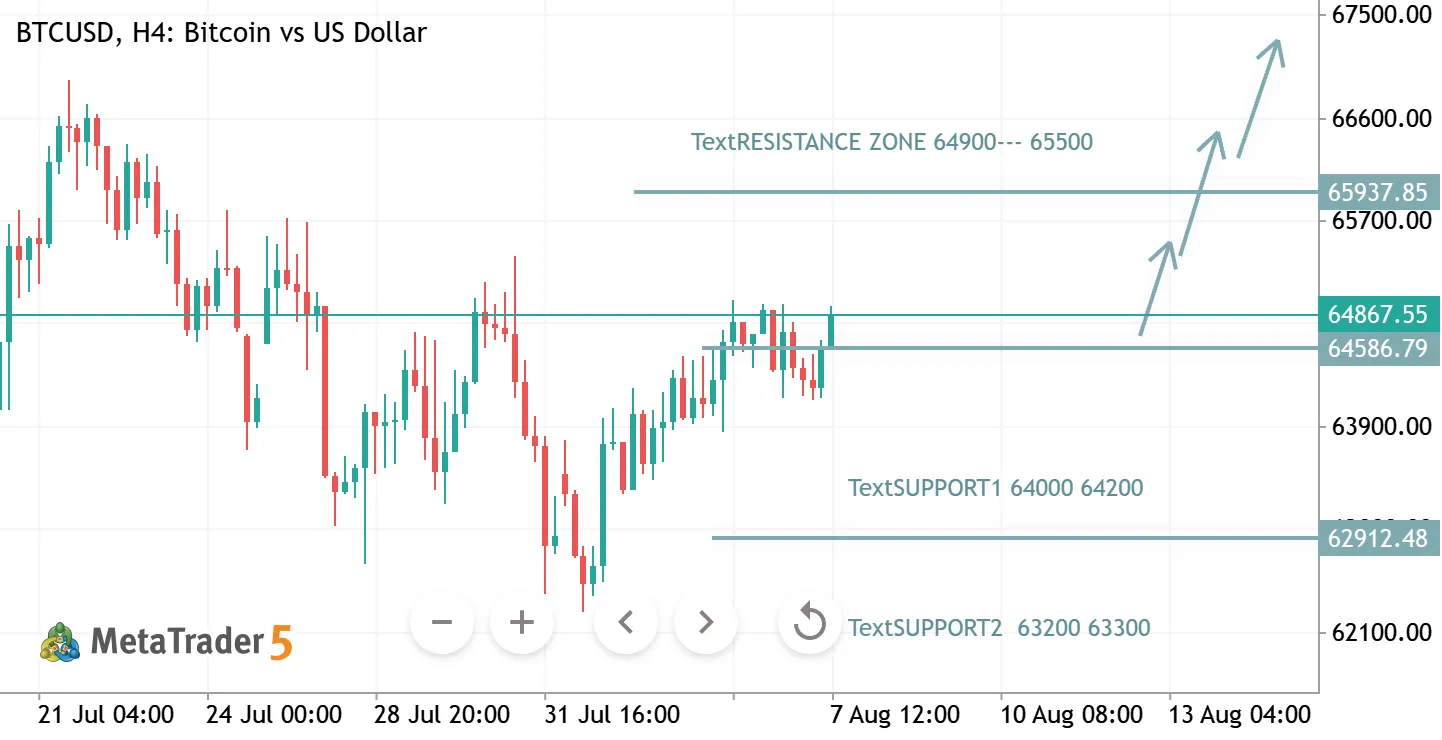
📊 BTCUSD – H4 Analysis BTCUSD is consolidating just below a key resistance zone after a strong recovery. Price action remains bullish as long as it holds above the 64,000–64,200 support area. A confirmed H4 breakout above 64,900–65,500 could trigger the next bullish leg toward higher levels. 🔹 Bias: Bullish 🟢 🔹 Support: 64,000–64,200 🔹 Resistance: 64,900–65,500 Trade with proper risk management and wait for candle confirmation before entering.
BITCOIN (BTC/USD) BREAKDOWN & DEMAND RE-ENTRY SETUP BTCUSD Bitcoin vs US Dollar

BITCOIN (BTC/USD) BREAKDOWN & DEMAND RE-ENTRY SETUP

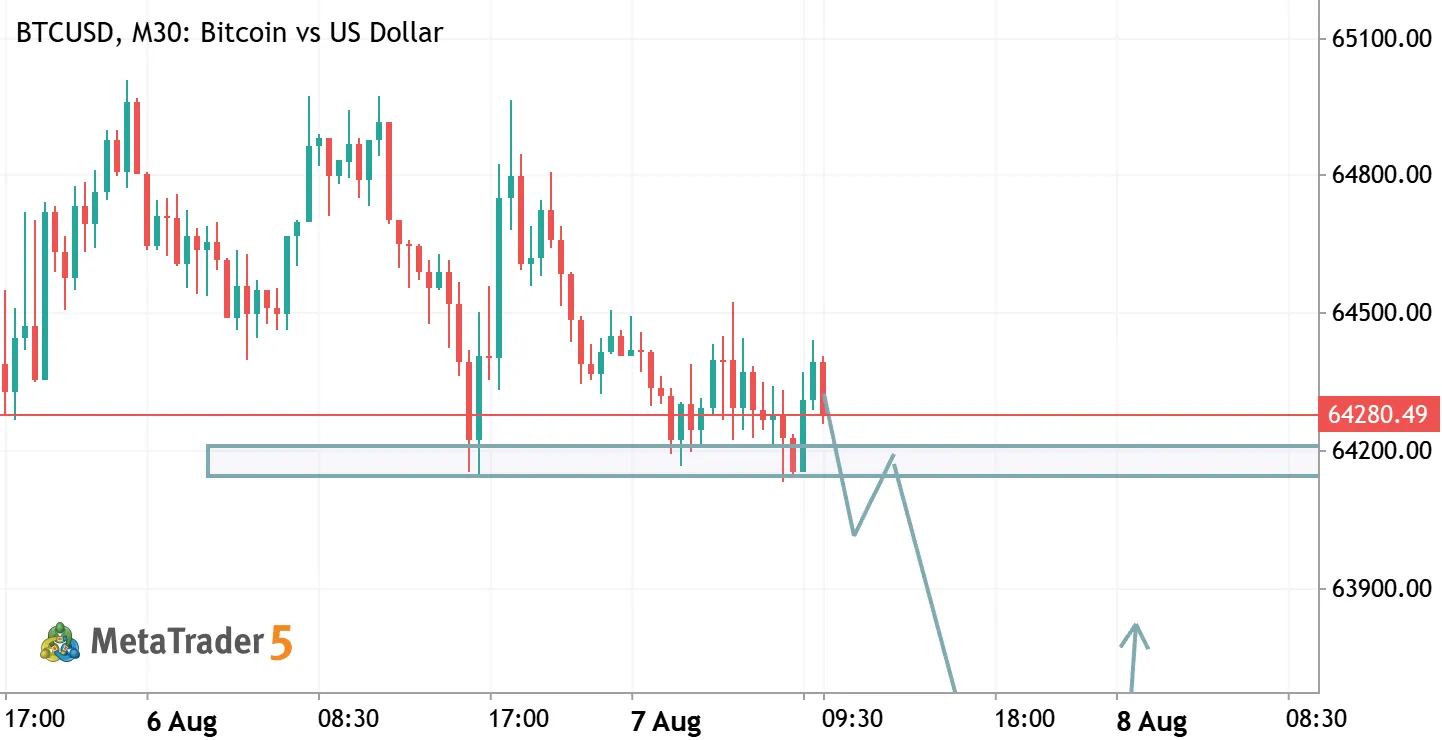
Executive Summary & Technical Overview On the 30-minute timeframe (M30) for BTC/USD (Bitcoin vs US Dollar) , price action exhibits a distinct multi-phase technical structure. Bitcoin has been consolidating near immediate support at the $64,200 level. The primary trade hypothesis maps out a short-term breakdown below this structural support, followed by a bearish retest to capture downside momentum toward a key lower Demand Zone between $62,400 – $62,600 . Once price reaches this major higher-timeframe interest area, a strong bullish reaction is anticipated to initiate a trend reversal back toward higher price levels. Detailed Technical Analysis & Trade Rationale Support Breakdown & Retest Phase (Short / Bearish Leg): Structural Failure: Repeated tests of the horizontal support
Bitcoin at a Major Rejection Zone – High-Probability Sell Setup! BTCUSD Bitcoin vs US Dollar

Bitcoin at a Major Rejection Zone – High-Probability Sell Setup!

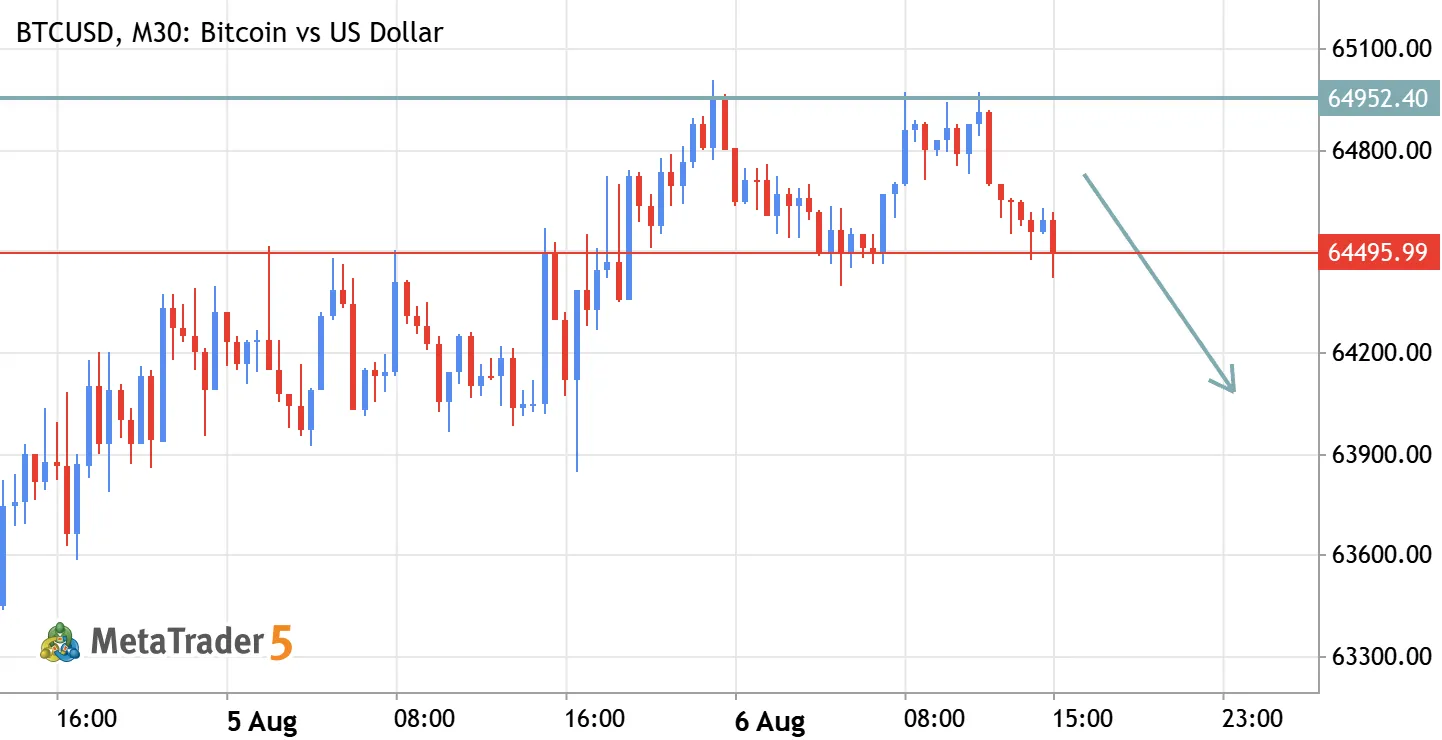
BTCUSDT Sell Signal Entry 1: 64,610 - 64,730 Stop Loss: 64,980 Take Profit 1: 64,400 Take Profit 2: 64,080 📉 Bitcoin is approaching a key resistance zone, presenting a potential high-probability selling opportunity. The first target is set at 64,400, with an extended target of 64,080. If bearish momentum continues to strengthen, BTC could extend its decline beyond the second target. Trade Management: If the second entry at 64,730 is activated and price retraces to Entry 1 (64,610), close the first position and move the second position's stop loss to breakeven (B.E.). This strategy helps protect profits while allowing the remaining position to continue toward the final target. Risk Disclaimer: Cryptocurrency trading involves substantial risk and high volatility. Always use proper risk
BTCUSD H4 ANALYSIS BTCUSD Bitcoin vs US Dollar

BTCUSD H4 ANALYSIS

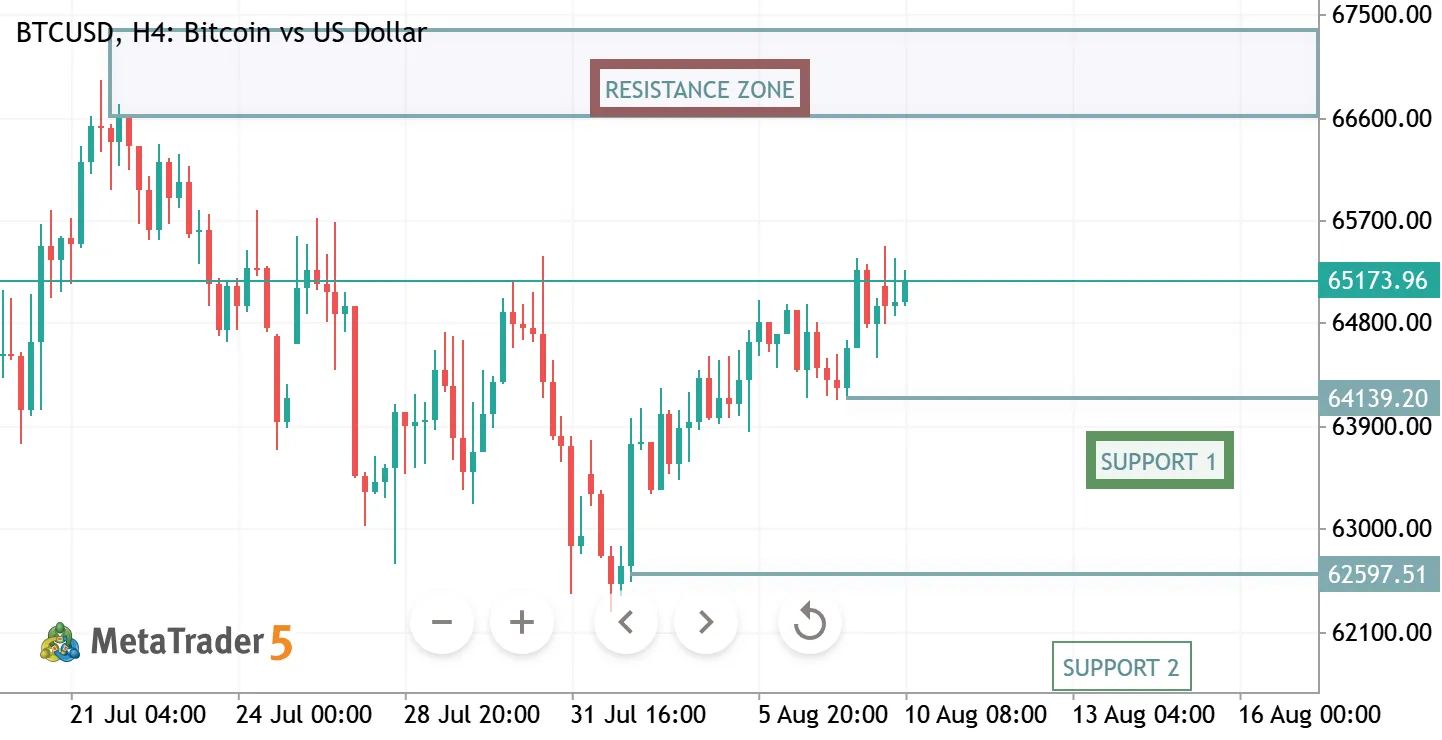
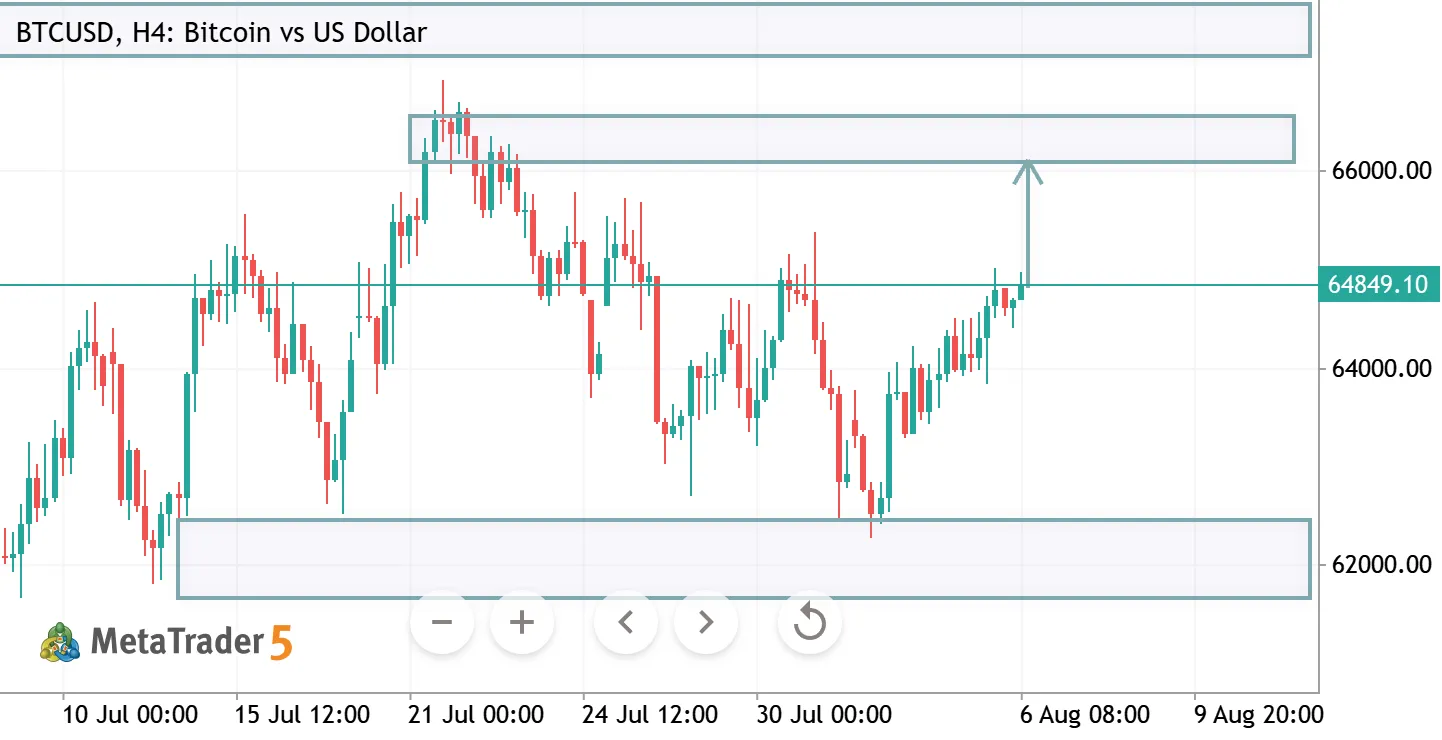
📊 BTCUSD H4 Analysis Bitcoin is approaching a major resistance zone after a steady bullish recovery. Price is testing the 64.8K–66K supply area, where a breakout could trigger the next leg higher. 🔹 Bias: Bullish 🟢 🔹 Resistance: 65,500 – 66,000 🔹 Support: 62,000 – 61,000 🔹 Outlook: A confirmed breakout above resistance may open the path toward new highs, while rejection could lead to a healthy pullback before continuation. Wait for confirmation and always trade with proper risk management. 📈
BTC BULLISH BREAKOUT: Market Structure Shift + Bull Flag In Play! BTCUSD Long Bitcoin vs US Dollar

BTC BULLISH BREAKOUT: Market Structure Shift + Bull Flag In Play!

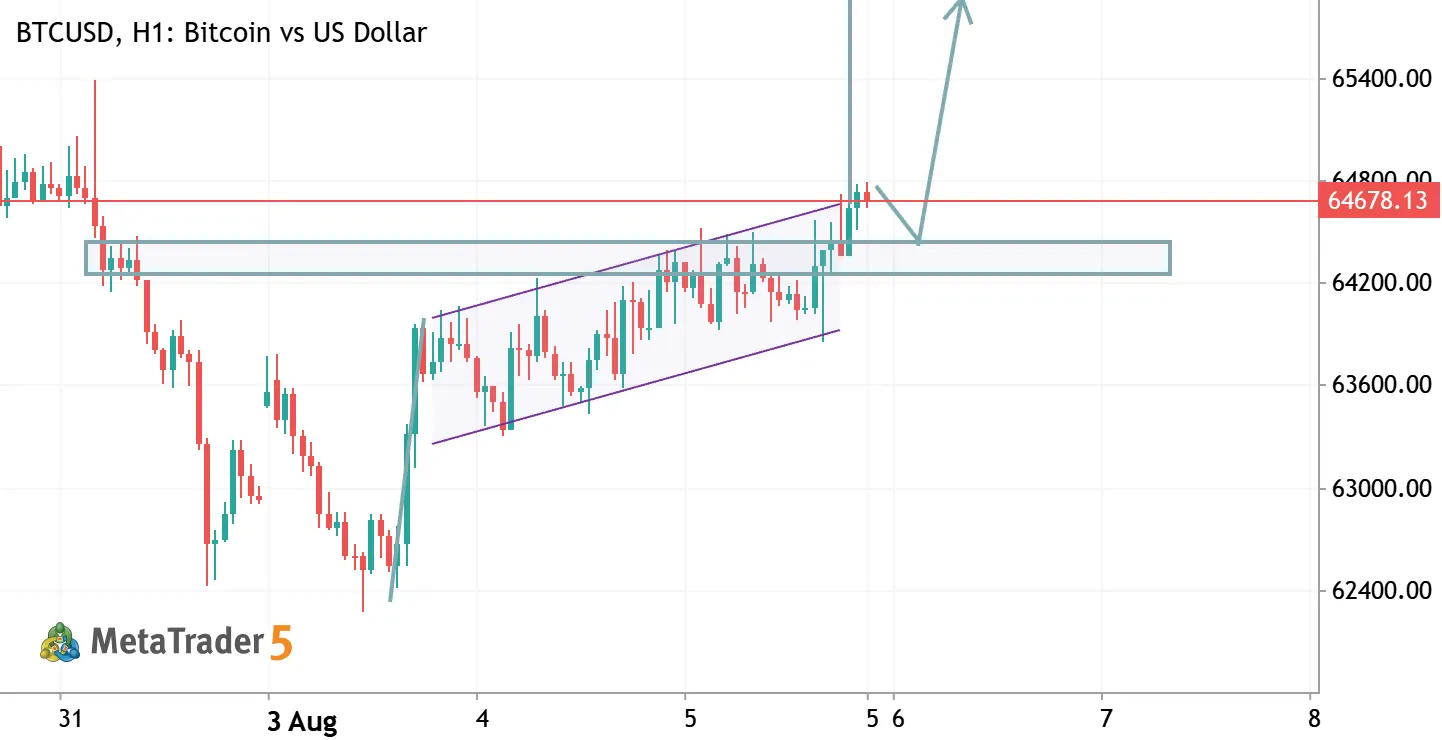
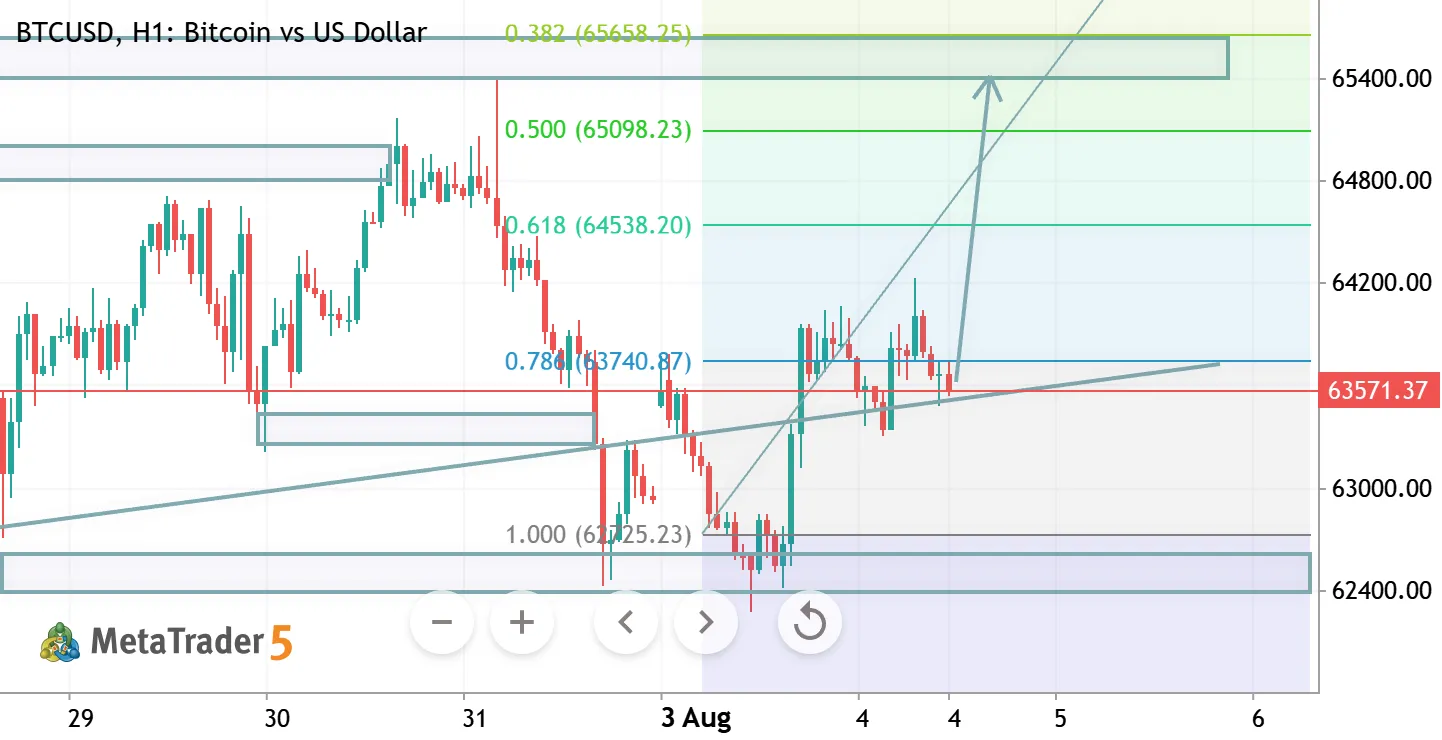
📊 Trade Setup: BTC/USD (H1 Timeframe) Entry Zone (Buy Limit / Retest): $64,300 – $64,500 (Waiting for a retest of the broken flag boundary / horizontal support zone) Stop Loss (SL): $63,800 (Placed safely below the ascending flag structure and local order block) Take Profit (TP): $66,000 – $66,200 ( targeting the major overhead liquidity pool and previous high supply zone) Risk/Reward Ratio: ~2.5:1 🔑 Key Analysis & Confluence Factors Market Structure Shift (MSS): Price swept liquidity around $62,000 and violently shifted to the upside, creating higher highs and breaking minor resistance levels. Bull Flag Pattern Breakout: The consolidation pattern (ascending channel/flag) between $63,300 and $64,400 has broken out upward, signaling bullish continuation. Key Retest Strategy: The arrow
BTCUSD H4 ANALYSIS BTCUSD Bitcoin vs US Dollar

BTCUSD H4 ANALYSIS

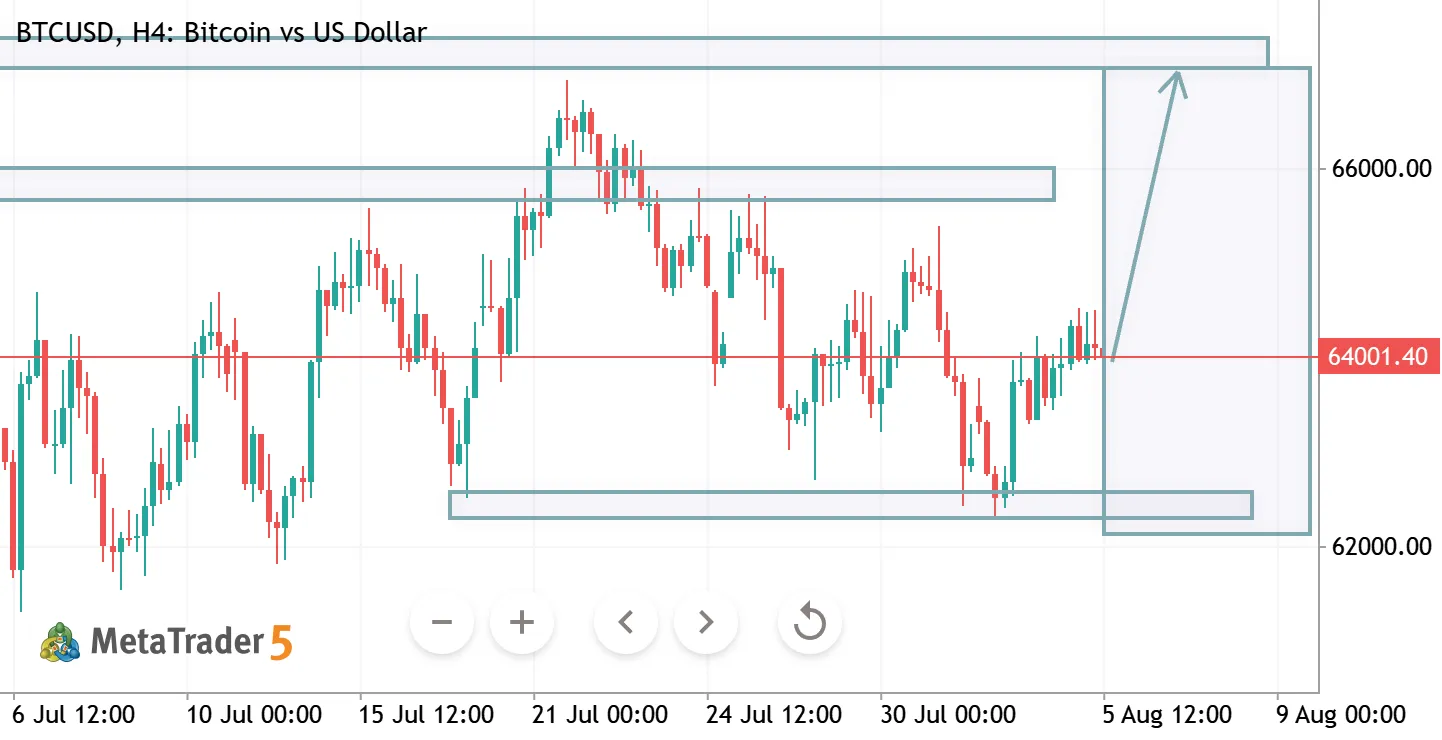
BTCUSD H4 Analysis BTCUSD is trading inside a well-defined range and holding above a key demand zone. Buyers are defending support, increasing the probability of a breakout toward the upper resistance if bullish momentum continues. Bias: Bullish Key Support: 62,000 – 62,300 Key Resistance: 65,500 – 66,800 Watch for a confirmed breakout above resistance for continuation. Manage risk and wait for price confirmation before entering.
BTCUSD H1 ANALYSIS BTCUSD Bitcoin vs US Dollar

BTCUSD H1 ANALYSIS

BTCUSD H1 Analysis BTCUSD is holding above a key demand zone after a strong rebound from recent lows. Price is attempting to break higher, with the 64.8k–65.1k resistance area acting as the next major target. A sustained move above this zone could accelerate bullish momentum. Bias: Bullish Key Support: 63,200 – 63,000 Key Resistance: 64,800 – 65,100 Wait for confirmation before entry and always use proper risk management.