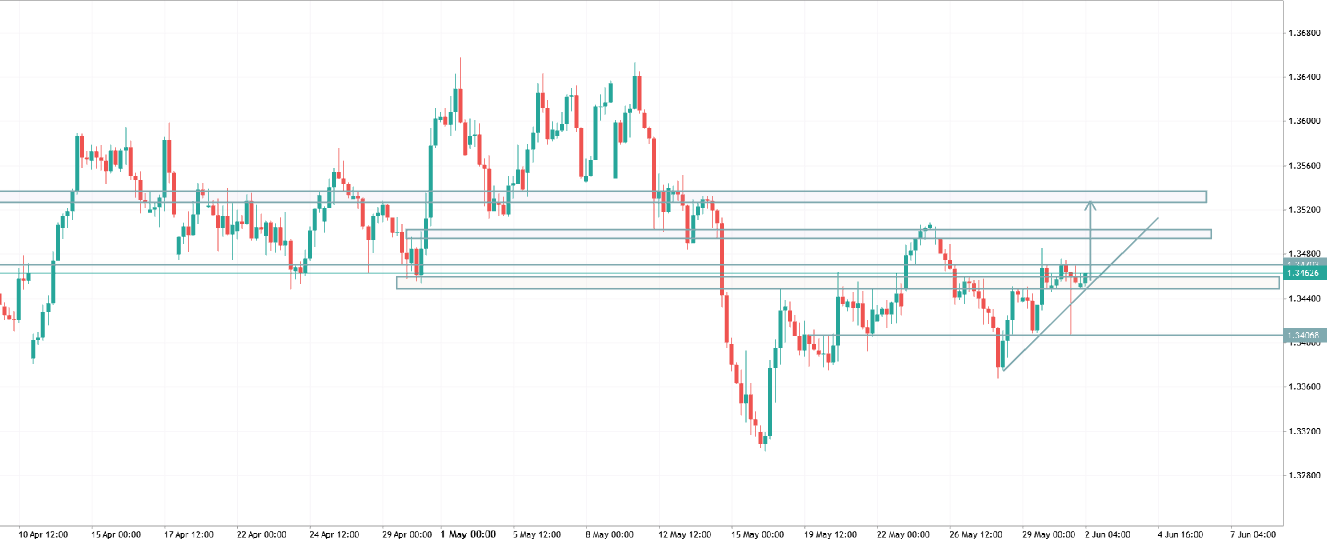
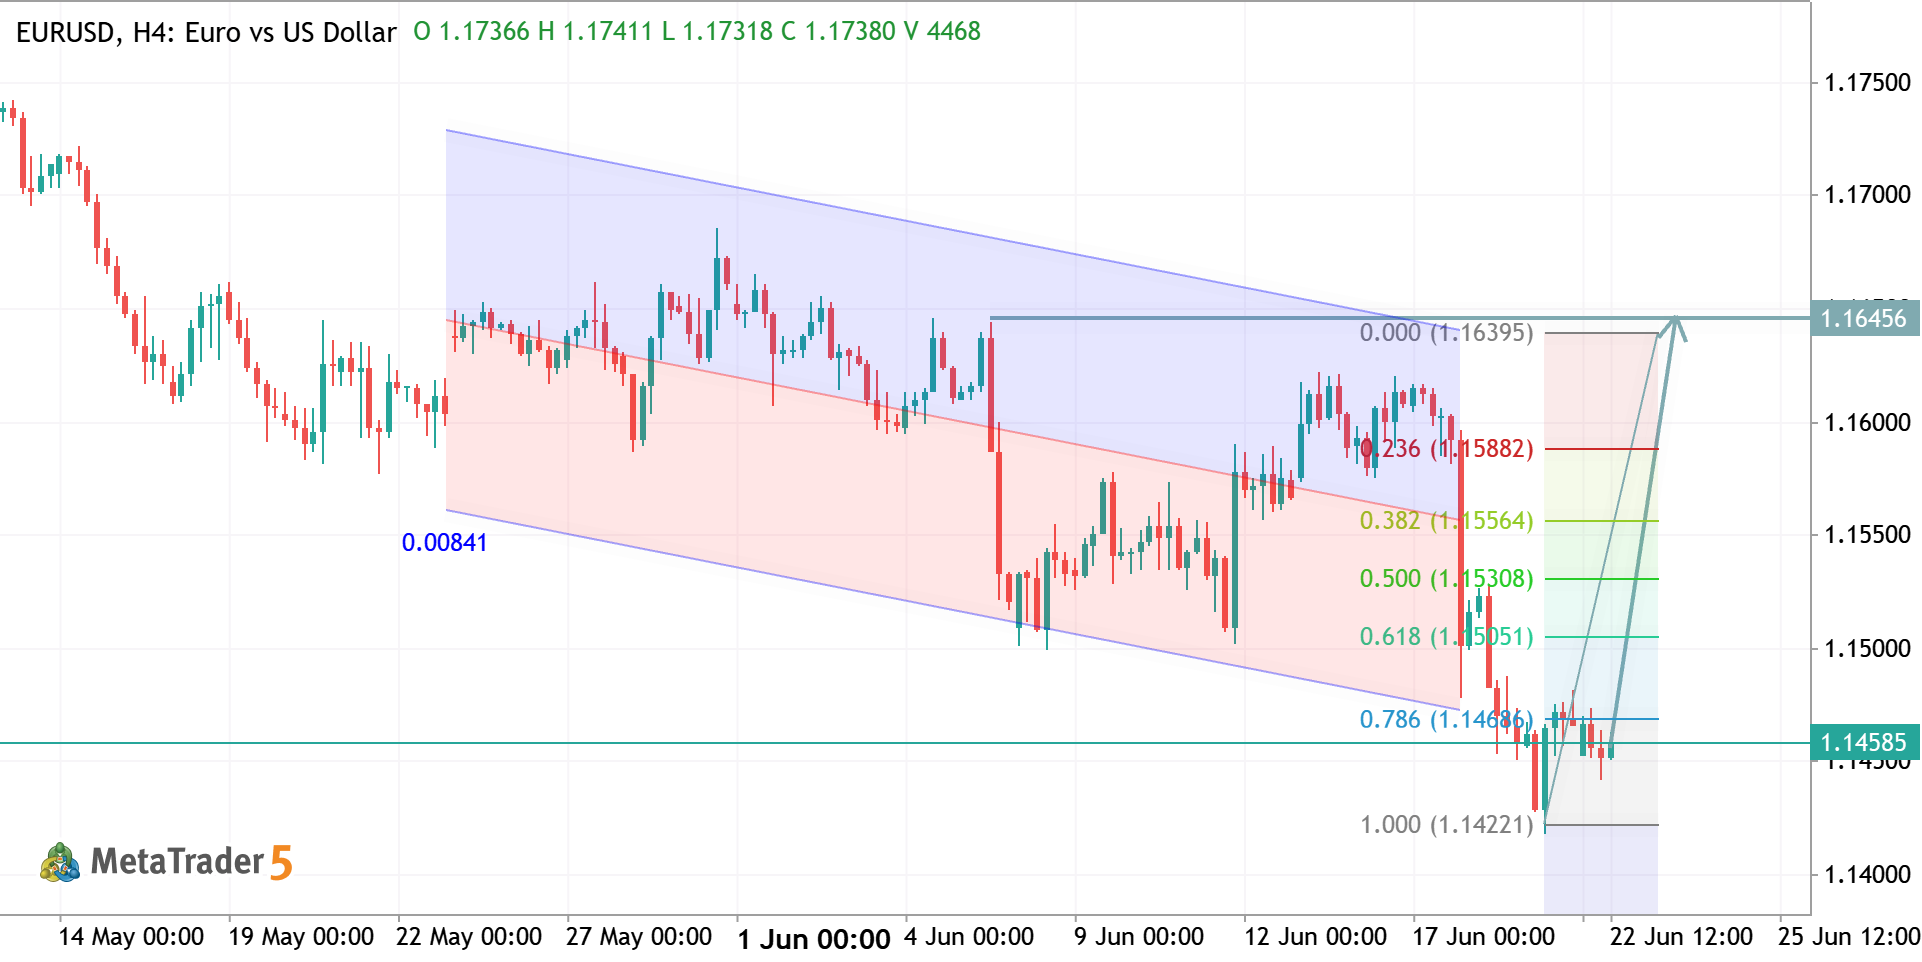
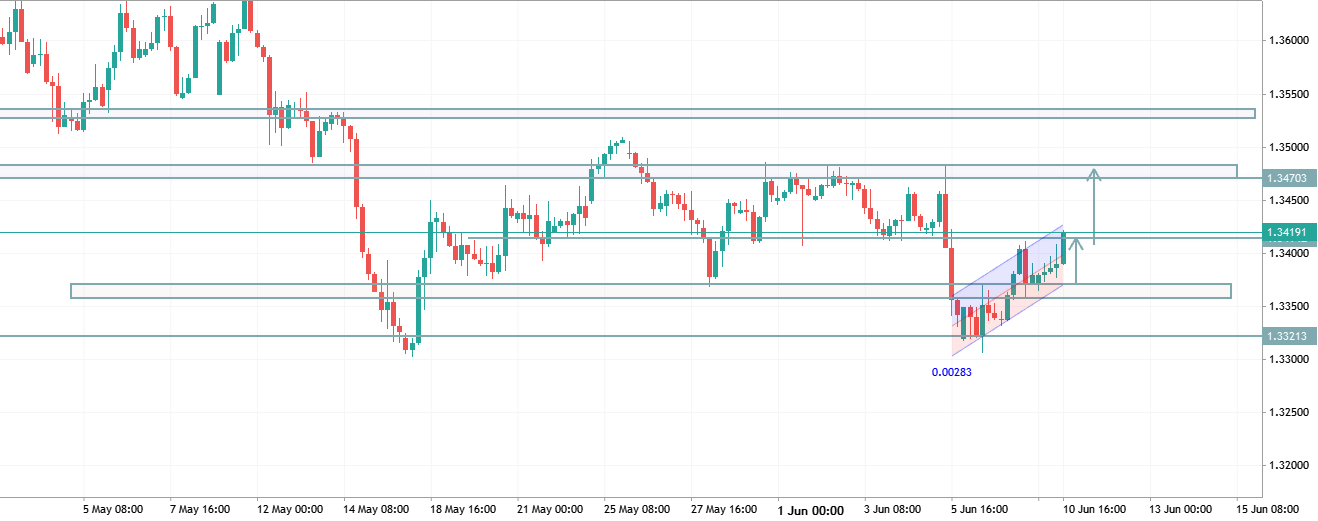
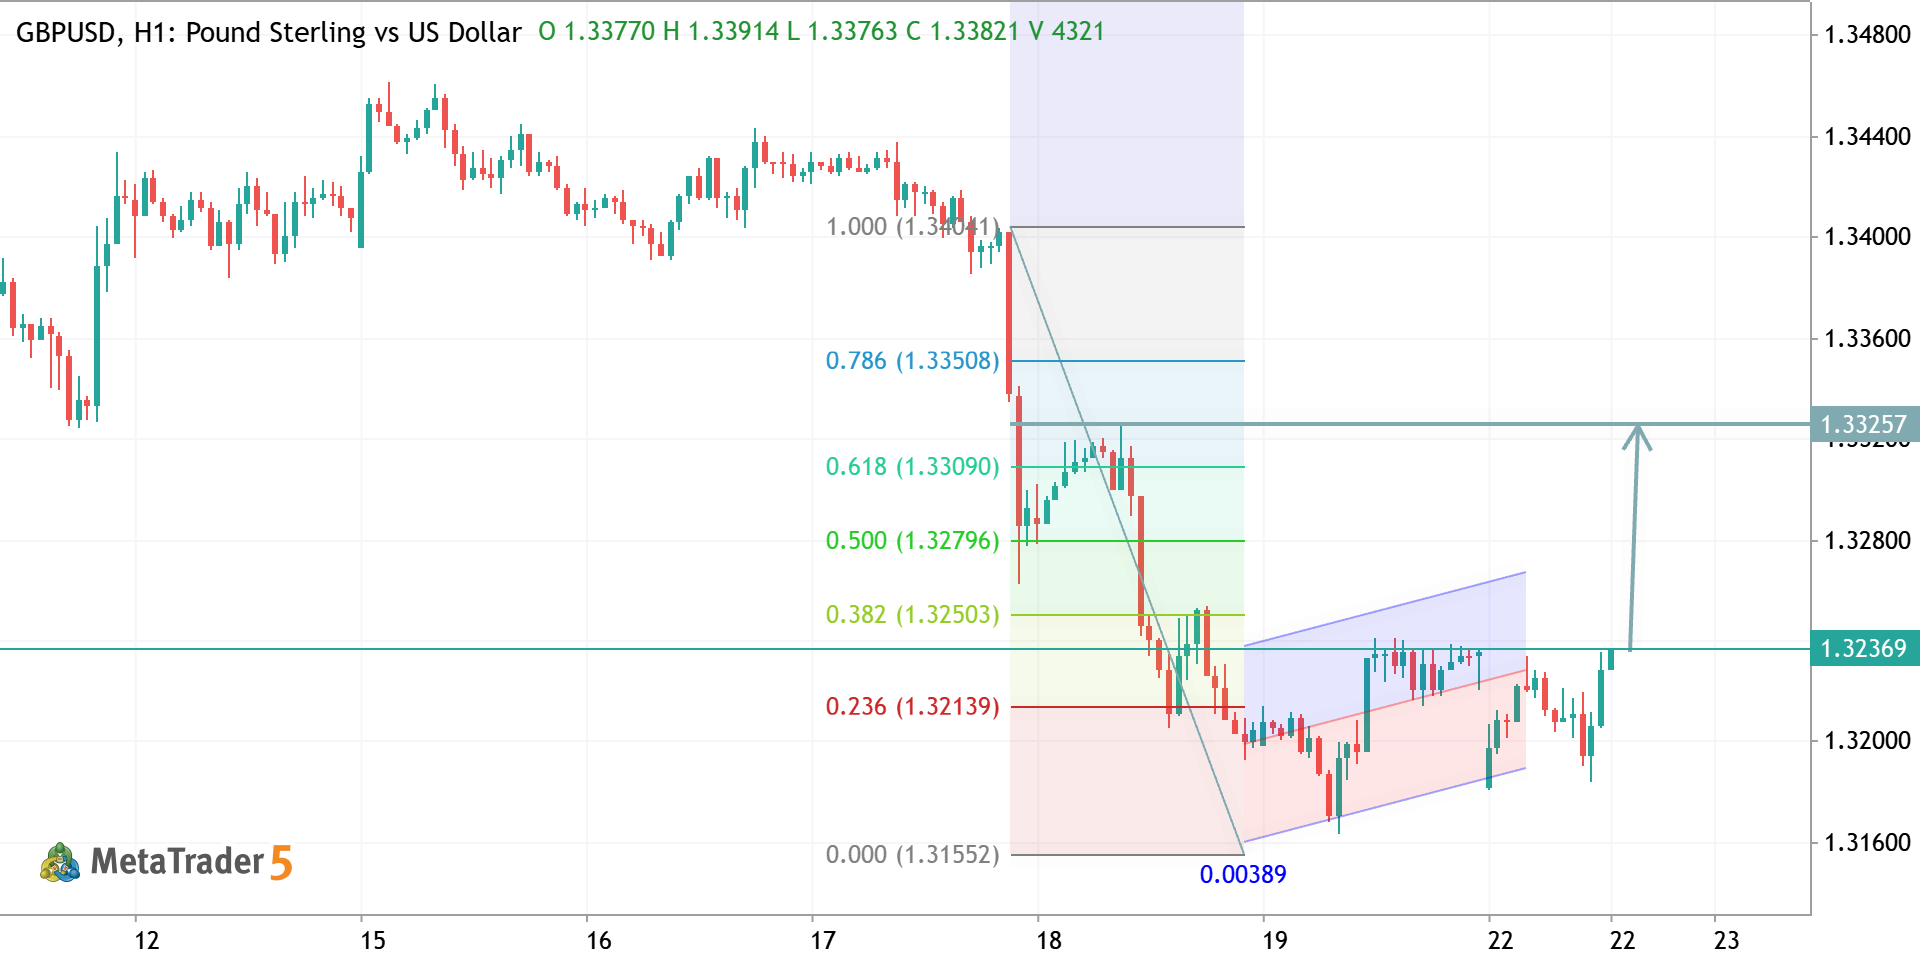
Trading Ideas for 2026: USDMXN - Technical Forecast and Levels USDMXN US Dollar vs Mexican Peso
Trading Ideas for 2026: USDMXN - Technical Forecast and Levels
MN1 price is located below Ichimoku cloud by moding along the lower border of Ichimoku channel - for the bearish trend to be continuing or for the primary bullish reversal to be started in the secondary ranging way. And chinkou Span line is almost ready to break the historical price to below for possible breakdown in the future for example. If the price breaks support level at 17.868 to below on monthly close bar so the primary bearish trend to be resumed with the good possible breakdown on lower timeframes; alternatively, the price will be on secondary ranging for direction waiting for the high impacted news events.
1
newdigital Sergey Golubev 2026.01.08 16:35
Trading Ideas for 2026: GBPUSD - Technical Forecast and Levels GBPUSD Pound Sterling vs US Dollar
Trading Ideas for 2026: GBPUSD - Technical Forecast and Levels
Weekly price is above 200 SMA on the bullish area of the chart. 100 SMA together with 55 SMS are indicator for the price the ranging market condition for trying to the primary bullish trend to be resumed. Ascending triangle pattern was formed, and if the price breaks resistance at 1.3534 to above so the bullish trend will be resumed. Alternatively, the price will be on secondary ranging within the primary bullish market condition. Recommendation: wait for the price to break 1.3534 resistance for possible buy position; otherwise - ranging.
2
newdigital Sergey Golubev 2026.01.08 10:38
Trading Ideas for 2026: EUR/USD - Technical Forecast and Levels EURUSD Euro vs US Dollar
Trading Ideas for 2026: EUR/USD - Technical Forecast and Levels
Weekly price is located above Ichimoku cloud in the primary bullish area of the chart. The price was bounced from 1.1808 resistance level to below for the ranging to the secondary correction to be started. - if the price breaks resistance level at 1.1808 on weekly close bar to above so the bullish trend will be continuing; - if the price breaks 1.1490 support to below so we ay see the the primary bearish reversal to be started; - if not so the price will be on ranging within wide support/resistance channel waiting for the direction of the strong trend. Recommendation: watch the close weekly price to break resistance at 1.1808 to above for possible buy position with 1.1918 as re-enter; otherwise - ranging.
2
newdigital Sergey Golubev 2026.01.06 10:10
Trading Ideas for 2026: GBP/USD - Technical Forecast and Levels GBPUSD Pound Sterling vs US Dollar
Trading Ideas for 2026: GBP/USD - Technical Forecast and Levels

Weekly price is located to be above 200 SMA and 100 SMA as well in the bullish area of the chart. The price was bounced from 55 SMA to above for the primary bullish trend to be started. For now, the price is trying to break the symmetric triangle pattern to above together with resistance at 1.3438 on the weekly close bar. Alternatively, the price will be on secondary ranging within s/r levels waiting for direction of the strong trend to be started. Recommendation: watch the weekly price to break the resistance level on close bar, otherwise - ranging for direction.

2
newdigital Sergey Golubev 2025.12.18 16:31
USDJPY: end of the year trading ideas USDJPY US Dollar vs Yen
USDJPY: end of the year trading ideas
The daily price is on secondary ranging within the primary bullish market condition: the p[rice is ranging within 154.35/156.95 support/resistance channel for waiting for the direction of the bullish tred to be continuing if the resistance at 156.95 is broken, or to the primary bearish reversal to be started for 154.35 support to be broken to below on daily close bar. Recommendation: watch the daily price 154.35/156.95 s/r channel to be broken for possible buy or sell position in the short or medium term situation for example.
2
newdigital Sergey Golubev 2025.12.18 09:58
Trading Ideas for 2026: USD/JPY - Technical Forecast and Levels USDJPY US Dollar vs Yen
Trading Ideas for 2026: USD/JPY - Technical Forecast and Levels
Weekly price broke Ichimoku cloud to above for the good weekly breakout. The price was bounced from resistance line at 157.96 to below for the secondary ranging within 150.27/157.96 s/r channel to be started. - if the price breaks resistance level at 157.96 on weekly close bar to above so the strong primary bullish trend will be continuing up to the beginning or in the middle of 2026; - if the price breaks 150.27 support to below so the primary bearish reversal will be started with the secondary ranging market condition; - if not so the price will be on ranging within 150.27/157.96 support/resistance channel. Recommendation: watch the price with s/r levels for possible buy or sell on lower timeframe in 2026 for example.
2
newdigital Sergey Golubev 2025.12.18 09:44
USDCHF: end of the year trading ideas USDCHF US Dollar vs Swiss Franc
USDCHF: end of the year trading ideas
Daily price broke Ichimoku cloud to below for the good daily breakdown. The price is trying to cross the support level at 0.7923 to below for the primary bearish trend to be continuing. If the price is bounced from support level to above to be back to the bullish area so we should want about resistance level at 0.8085 for possible target to be near at 0.8124 resistance. Otherwise - the price will be on ranging within s/r channel waiting for direction. Recommendation: watch the price concerning 0.7923 support level for possible sell trade, otherwise - ranging for direction.
2
newdigital Sergey Golubev 2025.12.17 12:59
EURUSD: end of the year trading ideas EURUSD Euro vs US Dollar
EURUSD: end of the year trading ideas
The daily price is located near and above Ichimoku cloud in the bullish area of the chart. The price was bounced from 1.1804 resistance level to below for the secondary ranging to the possible correction to be started. If the price breaks the border of Ichimoku to below together with 1.1615 support so the primary daily bearish reversal will be started. If the price breaks the resistance level at 1.1804 to aboive so the primary bullish trend will be continuing. Otherwise - the secondary ranging market condition to be near or inside Ichimoku cloud waiting for the direction of the strong trend to be started. Recommendation: watch the price with 1.1615/1.1804 s/r levels for possible direction.
2
newdigital Sergey Golubev 2025.12.17 12:42
GBPUSD Daily: waiting for the bullish trend to be continuing, otherwise - ranging GBPUSD Pound Sterling vs US Dollar
GBPUSD Daily: waiting for the bullish trend to be continuing, otherwise - ranging
The daily GBPUSD price is located above Ichimoku cloud in the bullish area of the chart. Chinkou Span line crossed the price on historical data indicating the strong bullish trend as well. The price is located within 1.3286/1.3436 s/r channel for trying to break the resistance to above for the strong bullish trend. If the price bounces from resistance at 1.3436 to below on daily close bar so the secondary ranging condition within the primary bullish trend may be started. If the price breaks the support level to below so we may see the primary bearish reversal to be started in the near future for example. Recommendation: waiting for direction.
2
newdigital Sergey Golubev 2025.12.16 16:54
EURUSD Daily Idea: waiting for the bullish daily trend to be continuing EURUSD Euro vs US Dollar
EURUSD Daily Idea: waiting for the bullish daily trend to be continuing

EURUSD Daily price is located above SMA with period 100 (100-SMA) and above SMA with the period 200 (200-SMA) for breaking the resistance levet at 1.1767 to above for the primary bullish trend to be continuing, other wise the price will be in secondary ranging within 1.1612/1.1767 support/resistance levels waiting for the direction of the secondary correction to the bearish trend to be started or for the bullish trend to be resumes. Recommendation: wait for the next daily bar to be closed above 1.1767 resistance for possible bullish.

2
newdigital Sergey Golubev 2025.12.16 16:38