

 Apri profilo MQL5
Grafici & Idee

Trading Ideas for 2026: SMCI - Technical Forecast and Levels
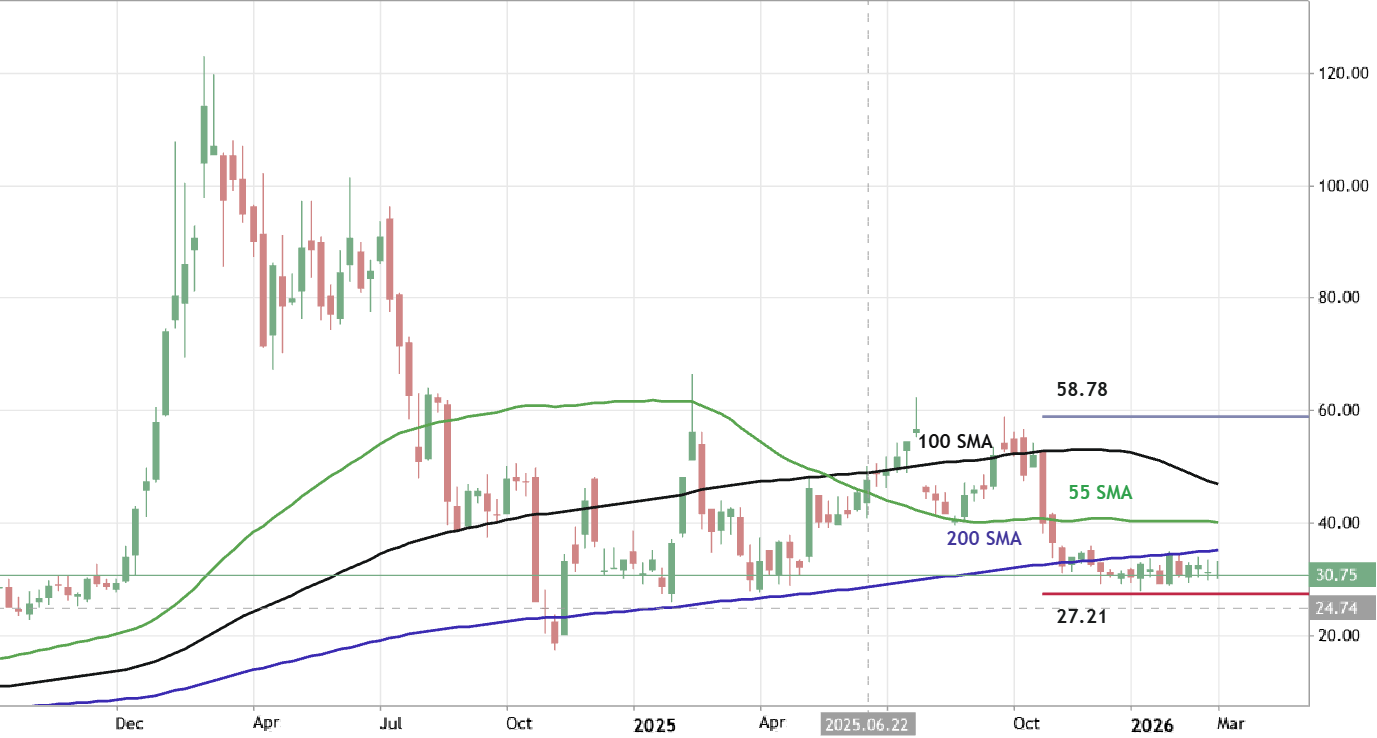
Daily price broke 200 SMA to below for the primary weekly bearish reversal to be started. The price is located near and below 200 SMA trying to cross the support level at 27.21 to below for the primary bearish trend to be continuing. Alternatively, the price will be on ranging waiting for direction of the bearish trend to be continuing or for the bullish trend to be resumed. Recommendation: waiting for direction

Trading Ideas for 2026: PHO - Technical Forecast and Levels
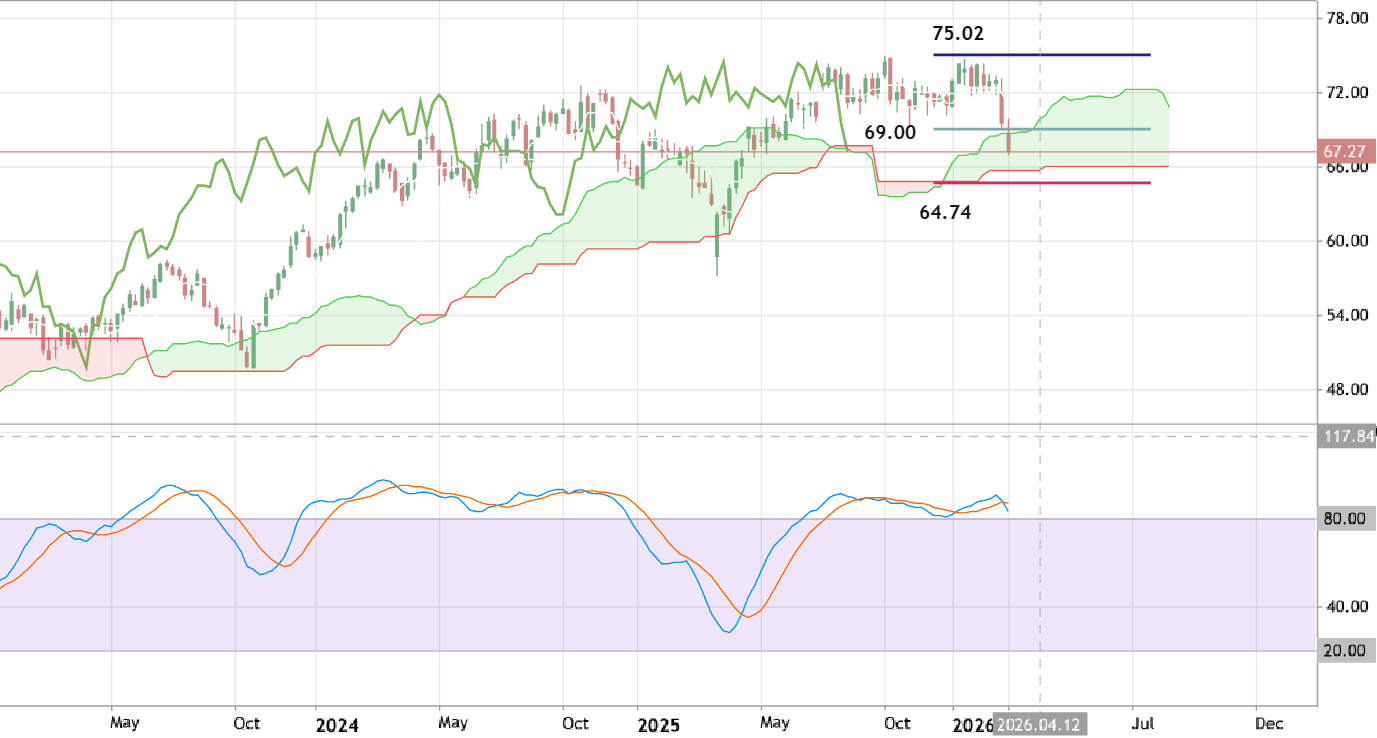
Chinkou Span line of Ichimoku indicator broke the historical price to below for the good breakdown to be started. The price broke the upper border of Ichimoku cloud to below together with support level at 69.00 for the breakdown with the primary weekly bearish reversal. The Stochastic oscillator is indicating the overbought level of the price to the bearish reversal to be continuing. If the price breaks 64.74 support level so we may see the weekly primary bearish reversal. Alternatively, the price will be on ranging waiting for direction. Trading Summary: breakdown with the bearish reversal

Trading Ideas for 2026: BABA - Technical Forecast and Levels
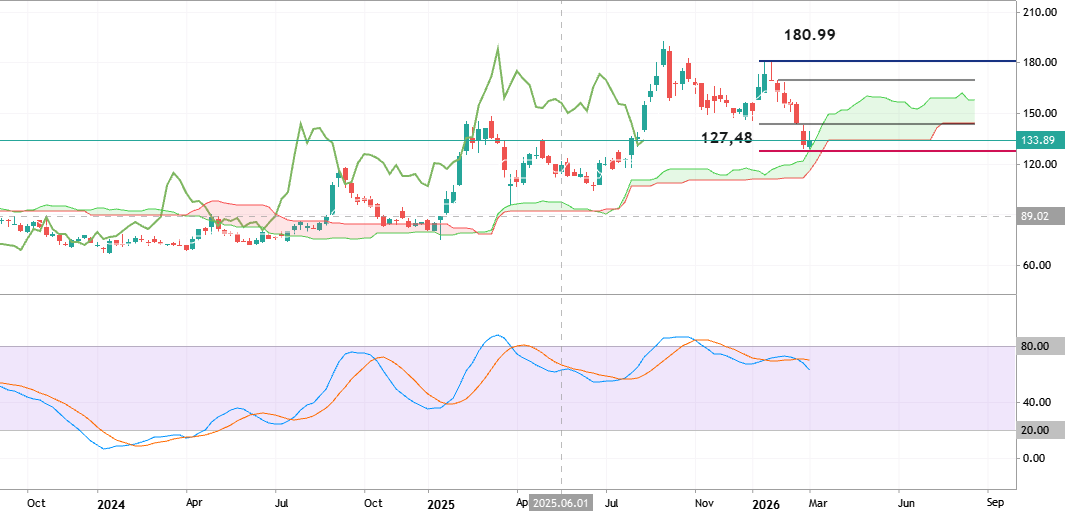
Weekly price is secondary correction to the primary bearish breakdown: the price is testing the upper border of Ichimoku cloud to below. Chinkou Span of Ichimoku indicator which is crossing the historical price for the good breakdown. Besides, the Stochastic oscillator is indicating the downtrend to be continuing. If the price breaks support level at 127,48 to below so the primary weekly bearish reversal will be started with the next support level at 103.63. If the price is bounced from support levels to above so we may see the bear market rally with 143.27 and 169.48 targets to re-enter. Alternatively, the price will be on ranging within the levels waiting for direction. Trading Summary: waiting for direction - watch for the weekly bearish reversal or for the secondary rally to be started.
Trading Ideas for 2026: USD/COP - Technical Forecast and Levels
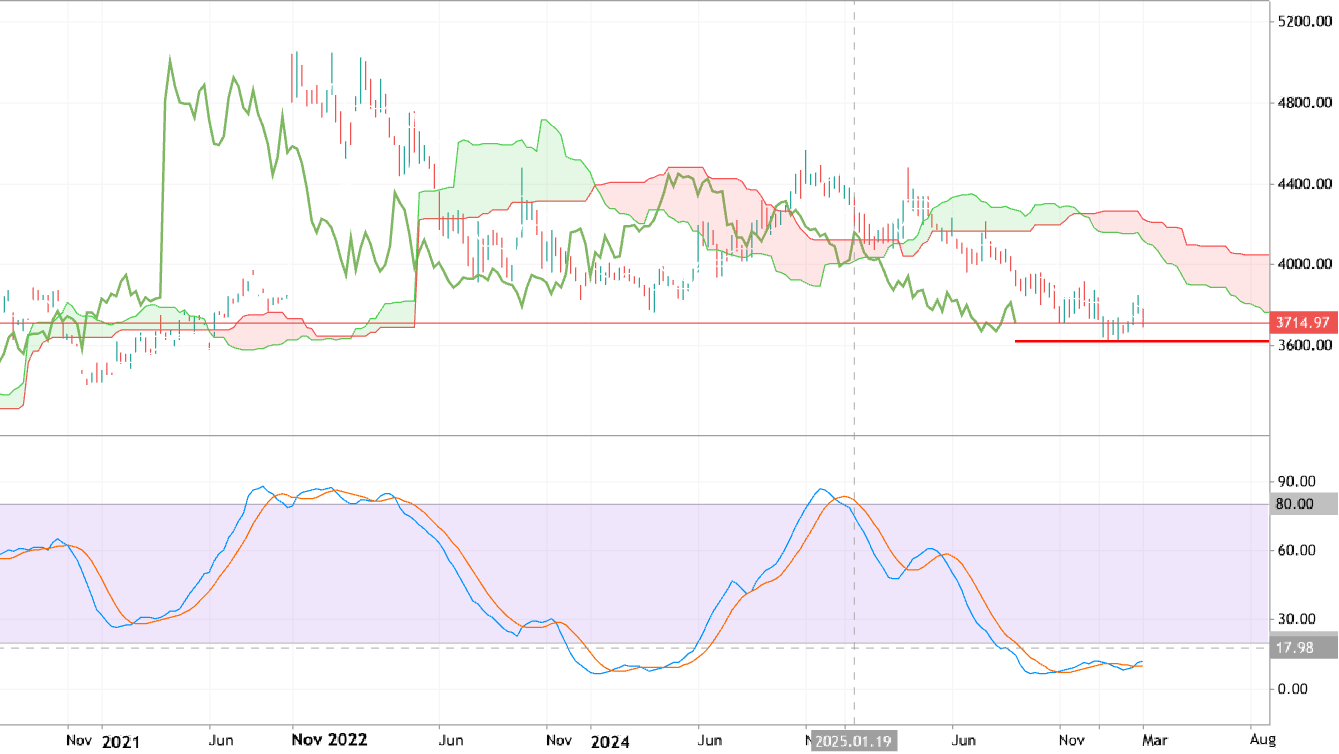
Weekly price broke Ichimoku cloud and it is located in the bearish area of the chart for now: Chinkou Span line of Ichimoku indicator broke historical price to below for the good weekly breakdown. But the Stochastic oscillator is showing the oversold market condition indicating the possible bear market rally in the future. Price is testing the support level at 3618 to below for the primary bearish trend to be continuing. Alternatively, the price may be bounced from support to above for the bear market rally to be started with the secondary ranging condition. Trading Summary: bearish breakdown; waiting for the bearish trend to be continuing or for the ranging with bear market rally to be started; possible bullish reversal in the long-term.
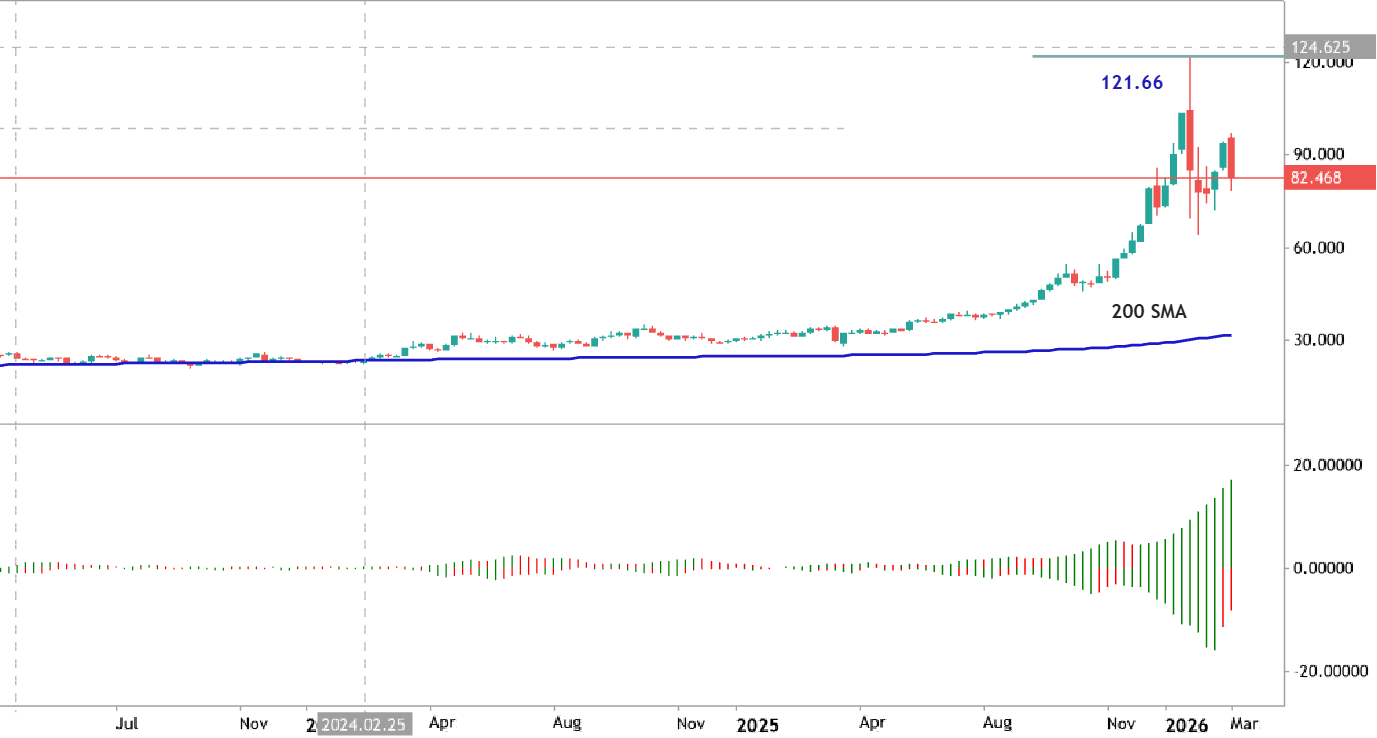
Gator Oscillator - traditional general approach
Gator Oscillator indicator was developed by Bill Williams to identify the market condition about the trend or ranging. Besides, the oscillator is measuring trend strength and identifies market phases: sleeping, awakening, eating, sated. Sleeping: Both bars are red, indicating no trend. Awakening: One bar is green, the other is red, signalling a new trend. Eating: Both bars are green, suggesting a strengthening trend. Sated: A red bar appears after an eating phase, suggesting the trend is ending. Trading Summary: The indicator is mostly used as a confirmation tool to avoid trading during consolidation.
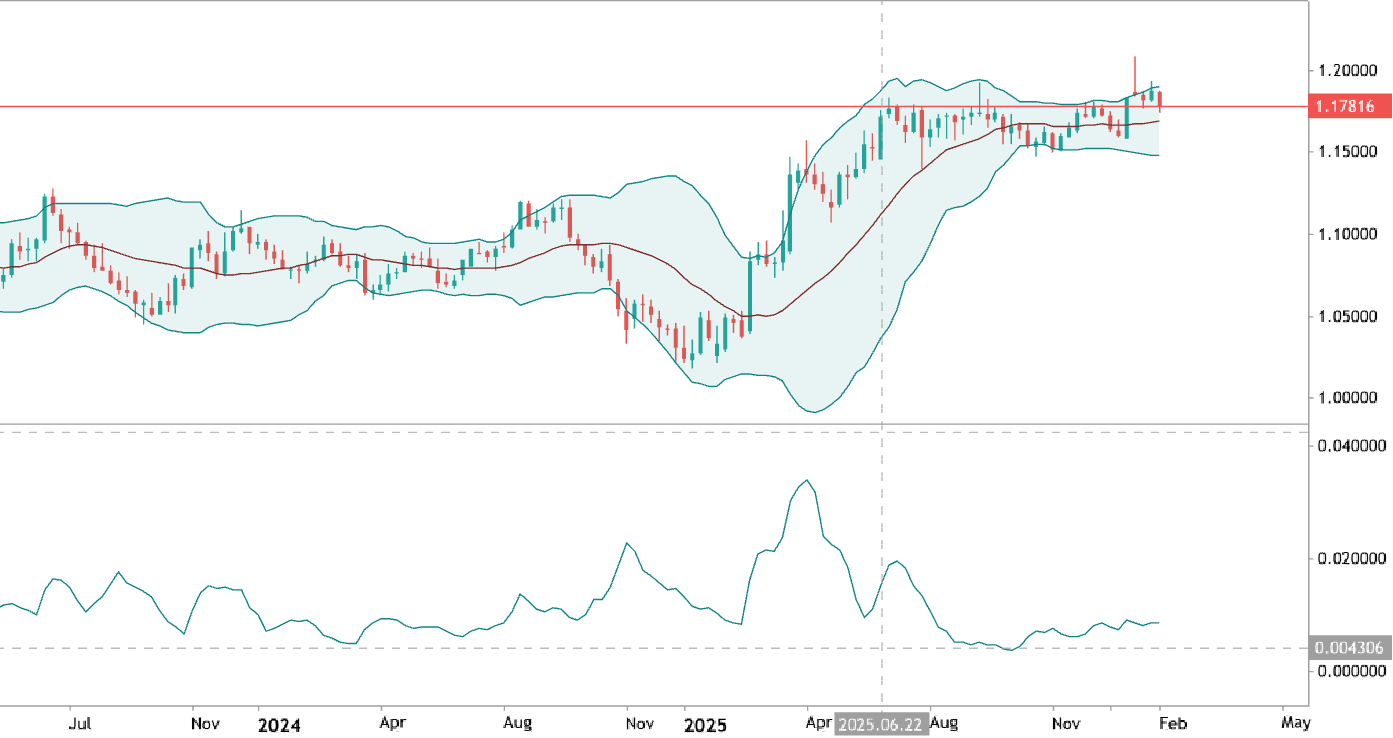
Standard Deviation - traditional general approach
Standard deviation is frequently used to measure the volatility: higher standard deviation indicates greater variability, and lower standard deviation is related the less variability. "Standard deviation is a key tool for traders to quantify the uncertainty and risk in the market. It allows us to better understand the potential variability of returns and make informed decisions to manage our portfolios effectively." – John Bollinger. We can use standard deviation to place stop loss and take profit levels: a wider stop loss with the high standard deviation for example.
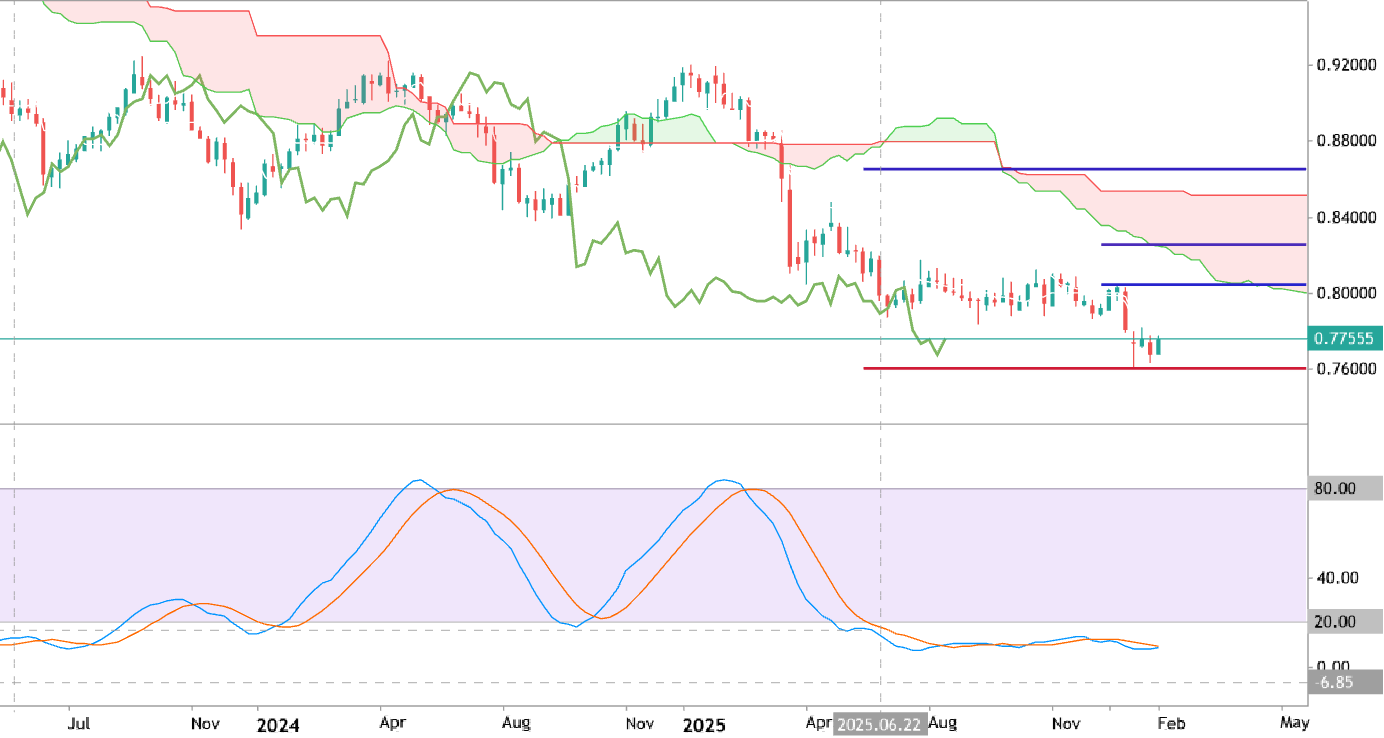
USDCHF - Long-Term Forecast
Weekly price is located below Ichimoku cloud in the bearish area of the chart. The price is on ranging within 0.7603/0.8040 support resistance channel for direction of the breakout with the bullish reversal or for the bearish trend to be continuing. Stochastic Oscillator is showing the oversold market condition so the breakour or at least the bear market rally is very likely in the near future for example. If the price breaks 0.8040 resistance to above so the primary bullish reversal will be started with 0.8249 target to re-enter. If the price crosses the support level at 0.7603 to below so primary weekly bearish trend will be continuing. Trading Summary: waiting for direction of the strong trend to be started.
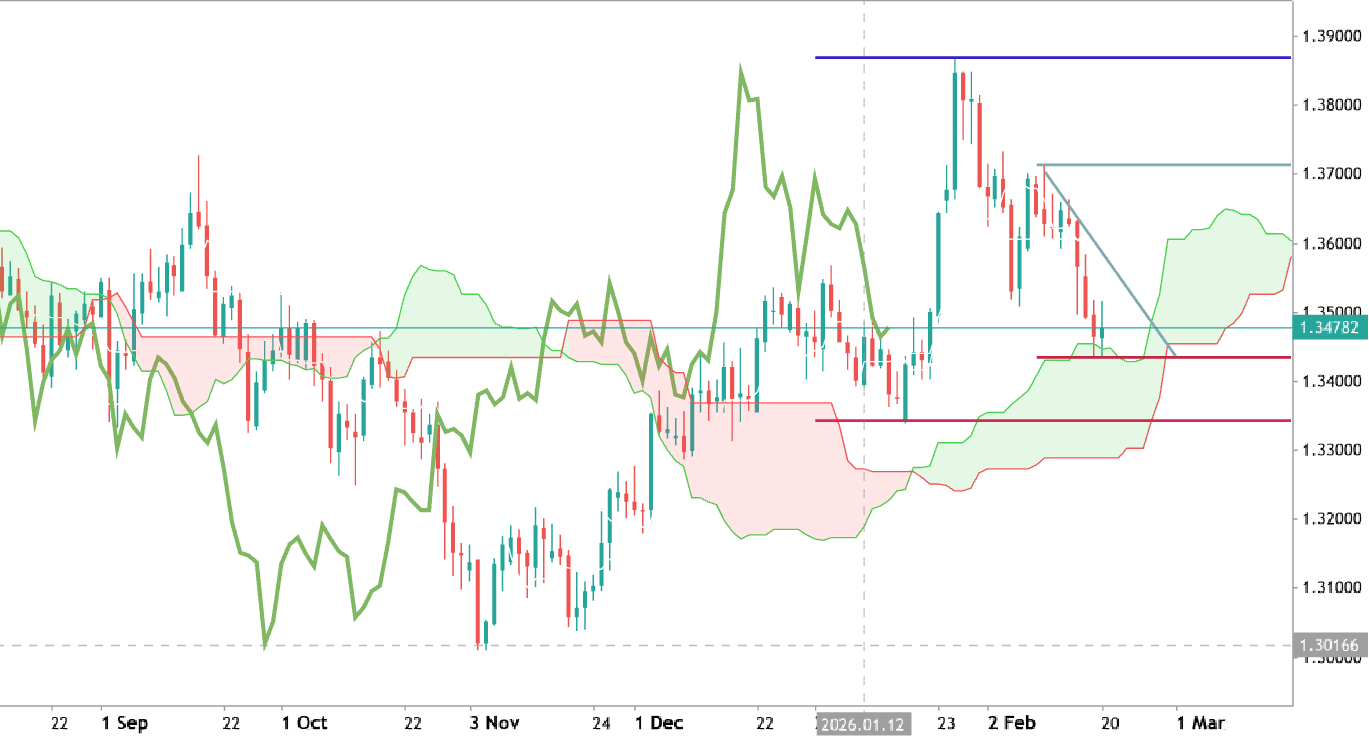
GBPUSD: Correction to the Bearish Reversal
Daily price was bounced from resistance level at 1.3712 to below for the secondary correction within the primary bullish trend to be started. The price is testing descending triangle pattern with 1.3433 support ot below for the support level at 1.3343 as the next possible target for the primary bearish reversal. Alternatively, the price will be on secondary ranging near and above Ichimoku cloud waiting for direction of the strong trend to be started. Trading Summary: correction to the possible bearish reversal.
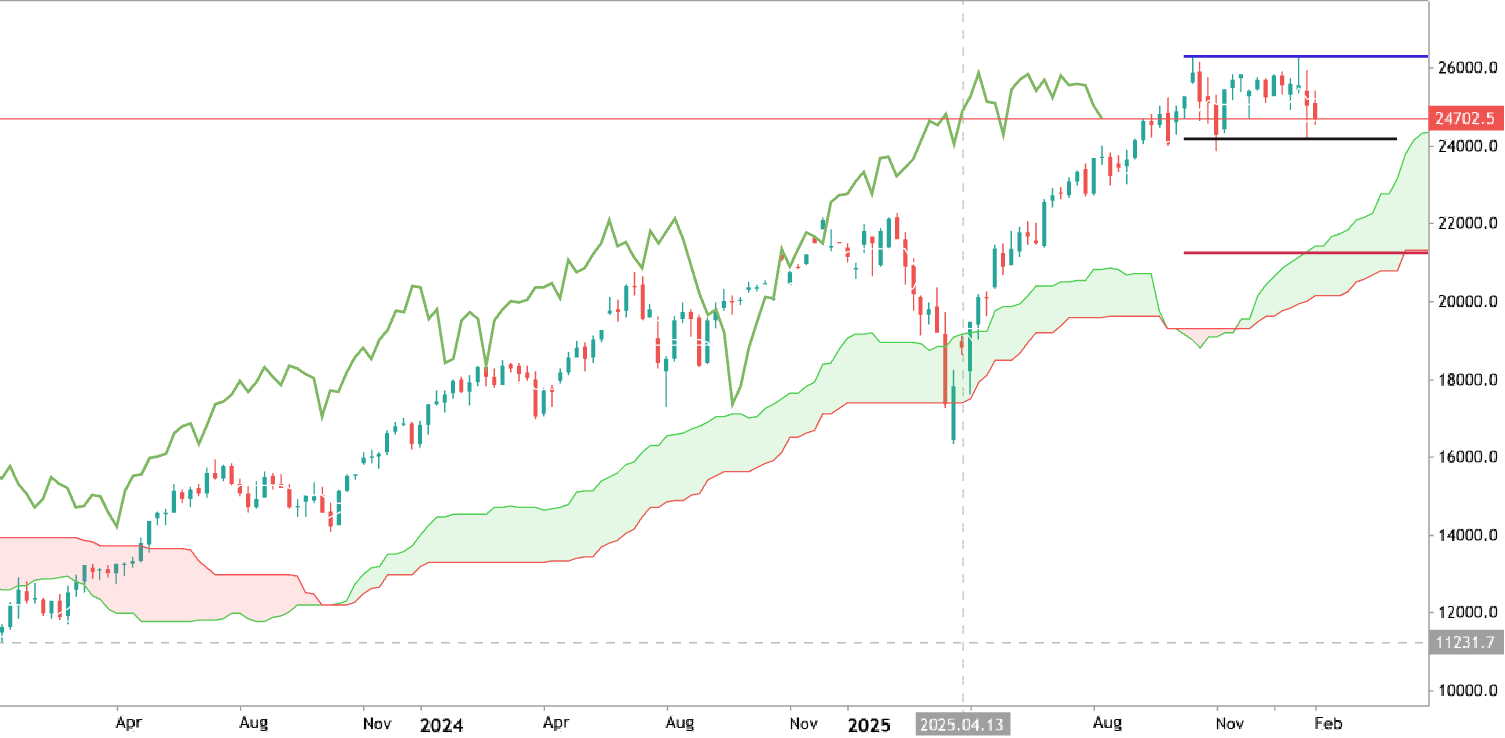
Trading Ideas for 2026: USTECH100mini - Technical Forecast and Levels
The weekly price is located above Ichimoku cloud in the bullish area of the chart. The price is on ranging within 24161/26288 support/resistance channel. If the price breaks 26288 resistance to above so the primary bullish trend will be continuing. If the price crosses 24161 support to below so the secondary correction will be started with 21250 support as good target to re-enter for the possible bearish reversal for example. Recommendation: watch Chikou Span like for possible bearish breakdown; otherwise - ranging
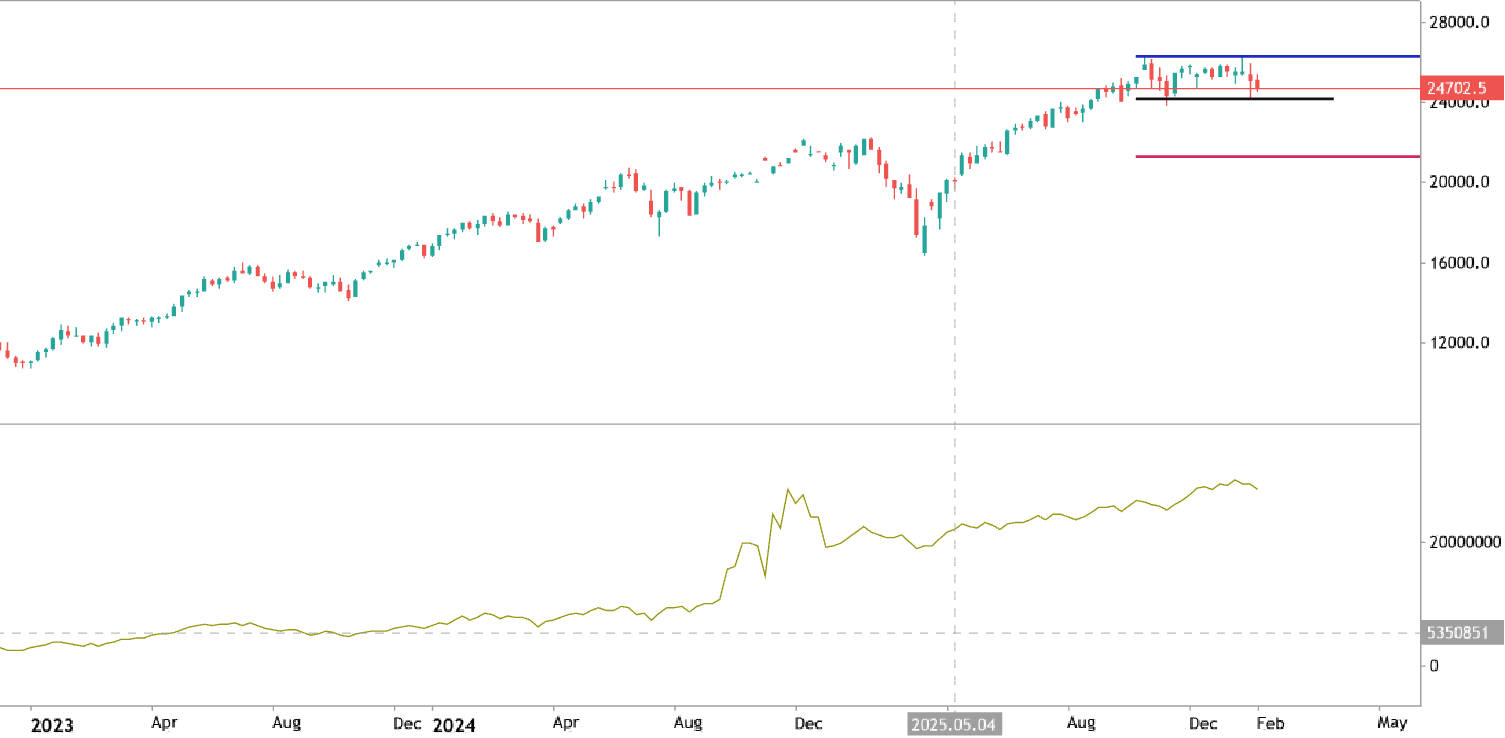
Accumulation/Distribution - traditional general approach
Accumulation Distribution uses volume to confirm price trends or warn of weak movements that could result in a price reversal. - Accumulation: Volume is considered to be accumulated when the day's close is higher than the previous day's closing price. Thus the term "accumulation day". - Distribution: Volume is distributed when the day's close is lower than the previous day's closing price. Many traders use the term "distribution day." The main use of the Accumulation Distribution Line is to detect divergences between the price movement and volume movement. Besides, Accumulation Distribution Line is a very effective tool to confirm price action and show warnings of potential price reversals.
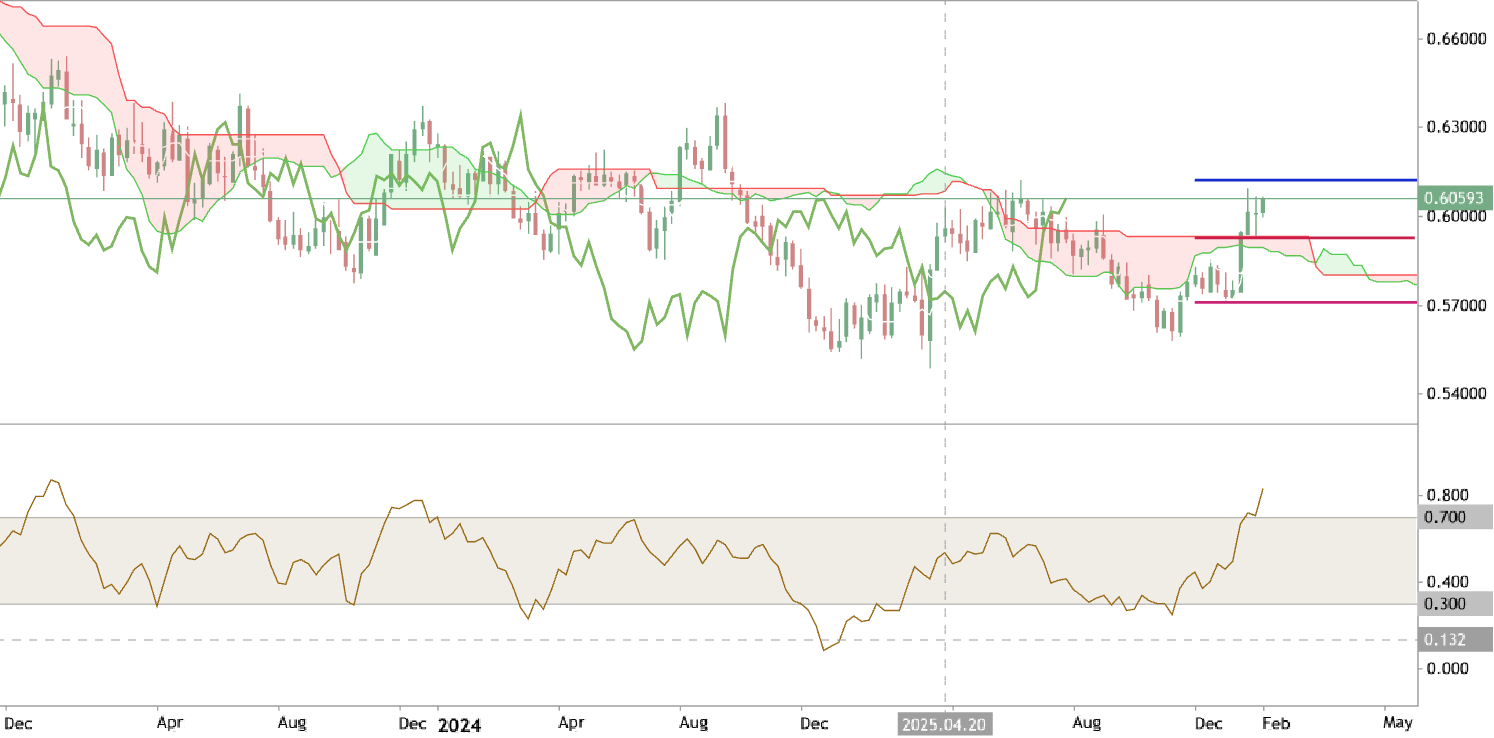
Bullish Breakout for NZDUSD
Chinkou Span line broke historical price to above on close weekly bar for the good bullish breakout. The price crosses Ichimoku cloud to be located in the bullish area of the chart. If the price breaks resistance at 0.6120 so the primary bullish trend will be continuing; if the price crosses 0.5927 support level to below for 0.5710 as the possible target to re-enter so the primary bearish reversal will be started; alternatively, the price will be ranging waiting for direction.
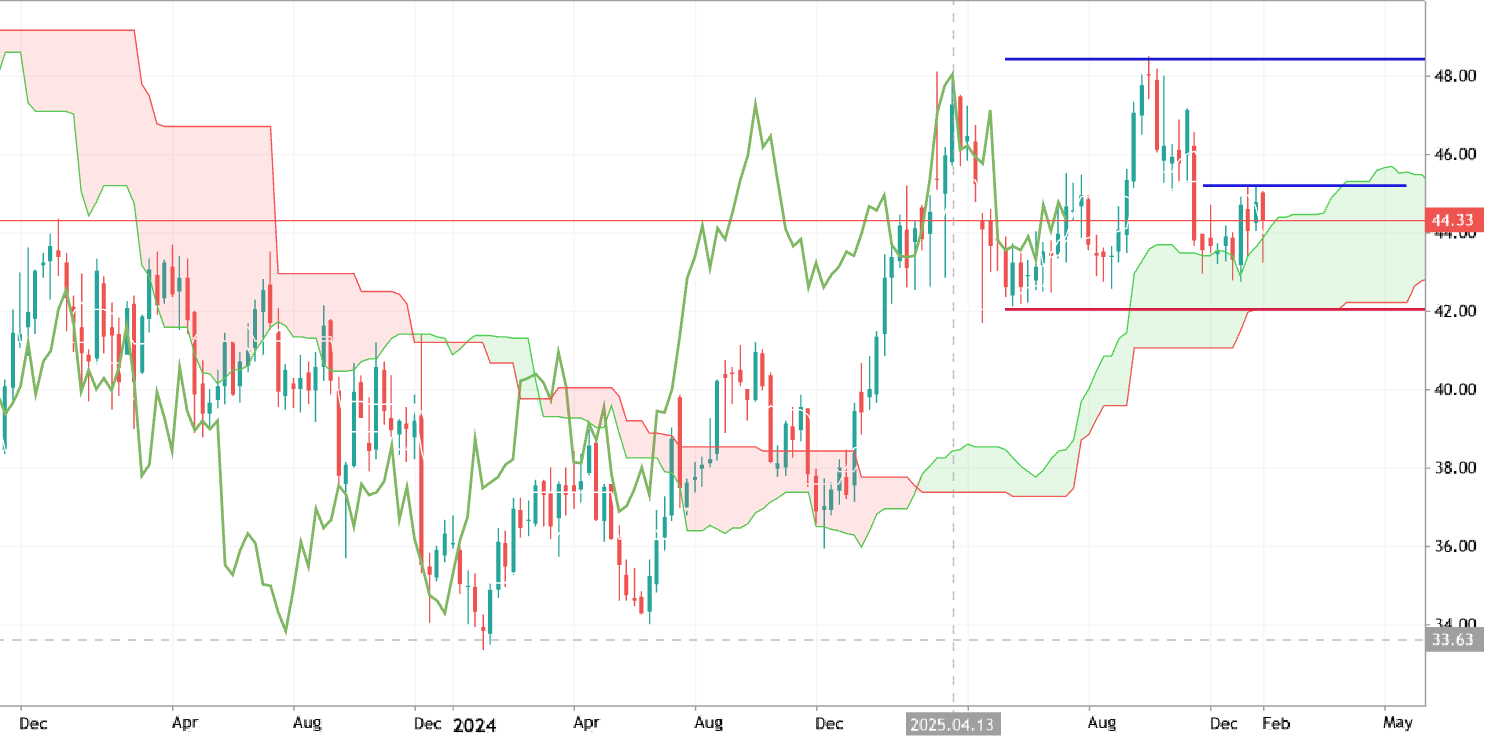

Trading Ideas for 2026: EXC - Technical Forecast and Levels
The weekly price is located near and inside Ichimoku cloud for the ranging waiting for direction. If the price breaks resistance level at 45.19 to above with 48.44 as the next possible target so the primary bullish trend will be continuing. If the price crosses 42.05 support to below so the weekly bearish reversal will be started. Trading Summary: waiting for direction