

 Apri profilo MQL5
Grafici & Idee
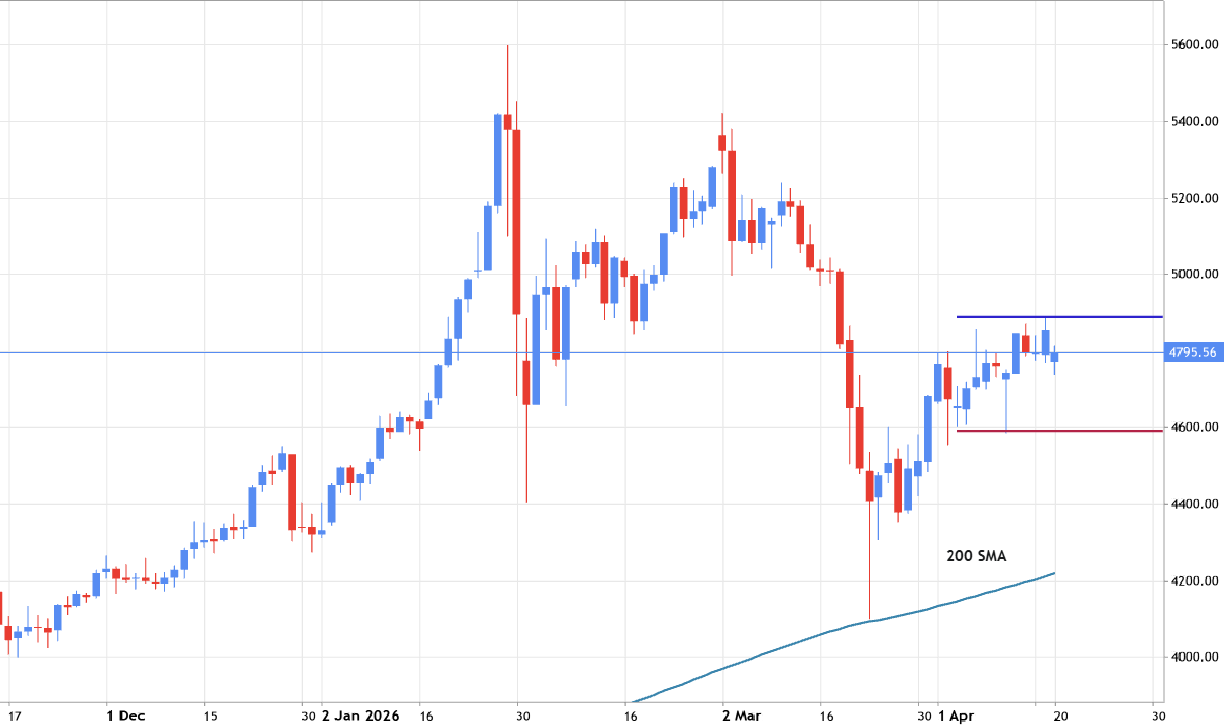
XAUUSD - Daily Bullish Ranging for Direction
The daily price is located above 200 SMA in the bullish area of the chart. The price is on ranging within 4589/4889 s/r channel waiting for the secondary correction to be started or for the strong bullish trend to be continuing. Trading Summary: waiting for direction
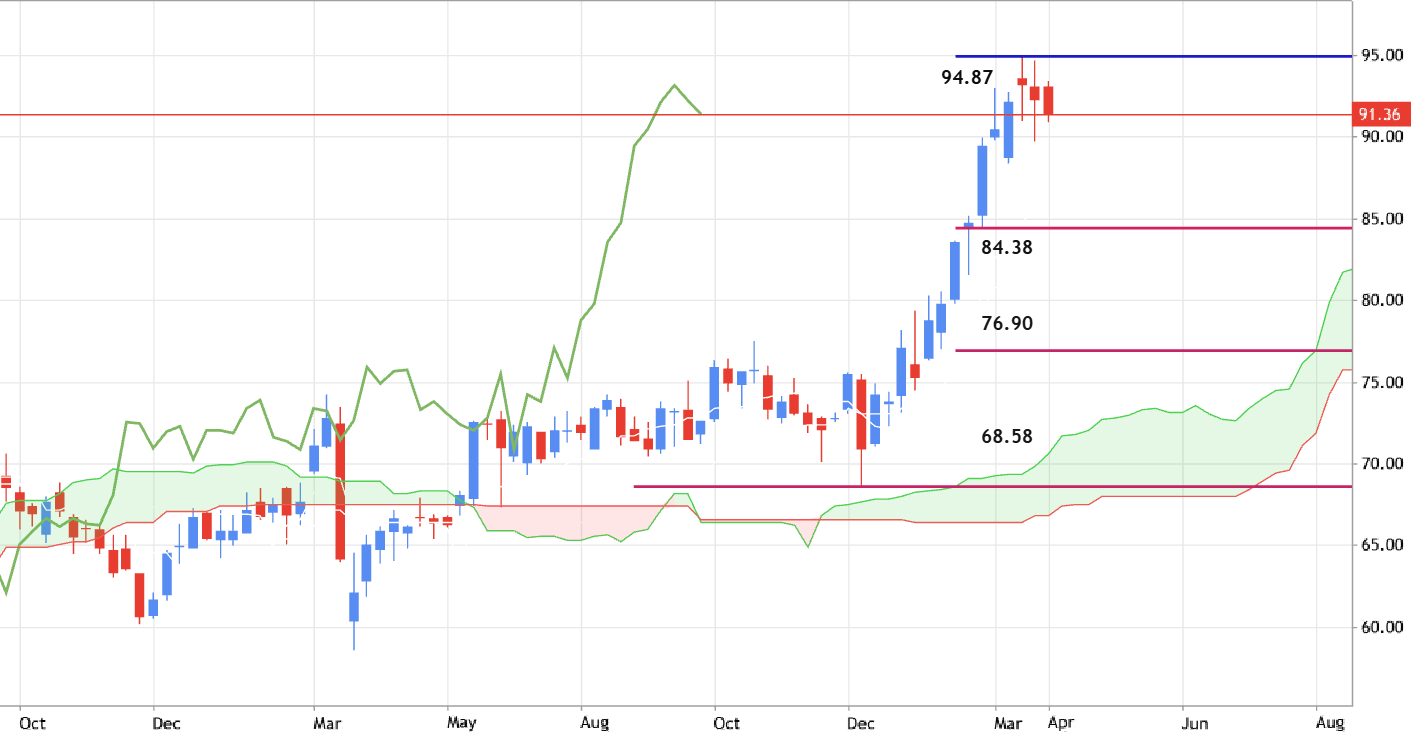

SHEL - Long-Term Forecast
Weekly price is located above Ichimoku cloud in the bullish area of the chart. The price was bounced from the resistance level at 94.87 for the ranging market condition. - If the price breaks the support level at 84.38 to below so the secondary correction within the primary bullish trend will be started; - if the price crosses 76.90 support to below so the primary bearish reversal may be started with 68.58 level to re-enter; - if the price breaks 94.87 resistance to above so the strong bullish trend will be continuing; - alternatively, the price will be on ranging within s/r channel waiting for the direction of the strong trend. Trading Summary : waiting for direction
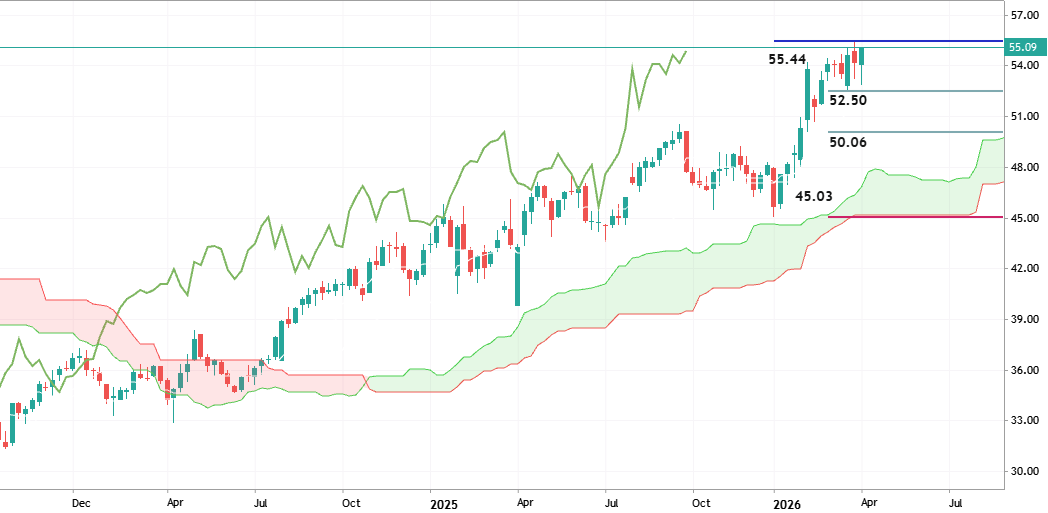

ENB - Long-Term Forecast
Weekly price is located far above Ichimoku cloud in the bullish area of the chart. The price is testing the resistance level at 55.44 to above for the strong bullish trend to be continuing. The alternative scenarios are the following: - if the price breaks the support at 52.50 to below so the secondary correction may be started with 50.06 possible target to re-enter; - if the weekly price crosses 50.06 support level so the correction will be continuing with 45.03 bearish reversal level; - if not so the price will be on ranging within s/r channel waiting for the direction of the strong trend to be started. Summary : primary bullish continuation
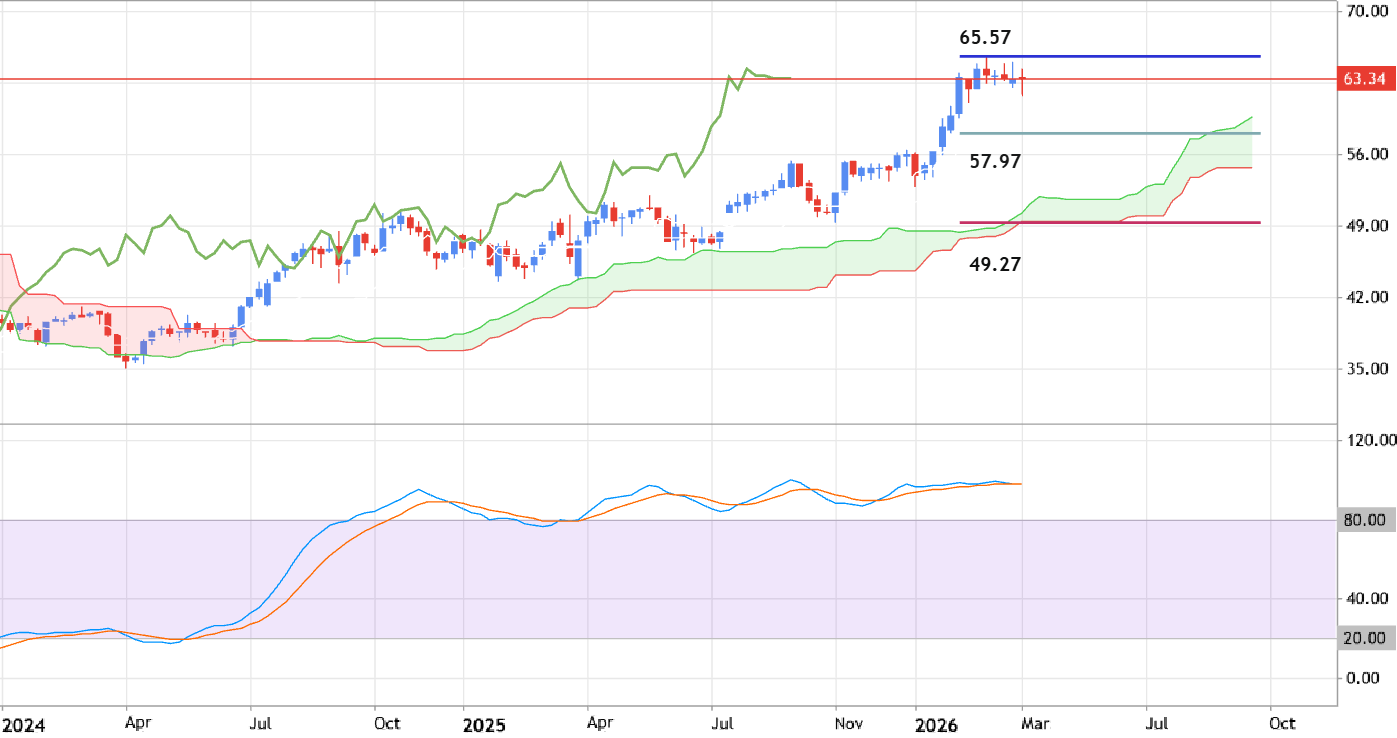

TRP - Long-Term Forecast
Weekly price is located above Ichimoku cloud in the bullish area of the chart. The price is trying to test the resistance level at 65.57 to above for the primary weekly bullish trend to be continuing. But Stochastic oscillator is indicating the overbought market condition for the price by now, and the nearest support level at 62.38 is the easy to be broken now for example. If the price breaks 65.57 resistance to above so the strong bullish trend will be continuing. If the price crosses 57.97 support to below so the secondary correction within the primary bullish trend will be started with 49.27 level as the weekly bearish reversal target. Alternatively, the price will be on secondary ranging within 57.97/65.57 s/r levels waiting for direction. Trading Summary: ranging within support/resistance channel waiting for direction of the strong trend to be started.
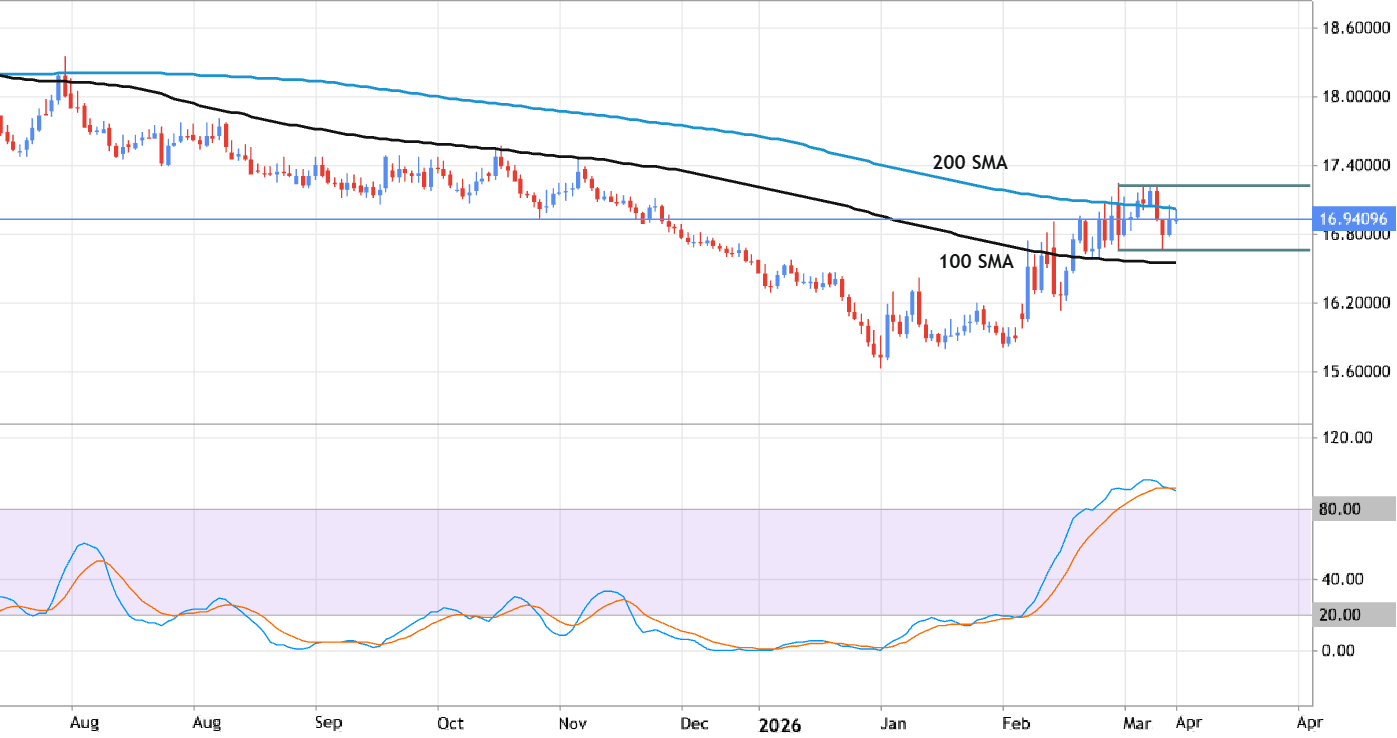
USDZAR - Price Action Daily Analysis
Daily price is on ranging around 200 SMA within 16.66/17.22 s/r channel waiting for the direction, and the Stochastic oscillator is indicating the overbought market condition. If the price breaks support level at 16.66 to below so the primary daily bearish trend will be resumed. If the price crosses 17.22 resistance level to above so the primary daily bullish reversal will be started. Alternatively, the price will be on ranging waiting for direction of the strong trend to be started. Recommendation: waiting for direction
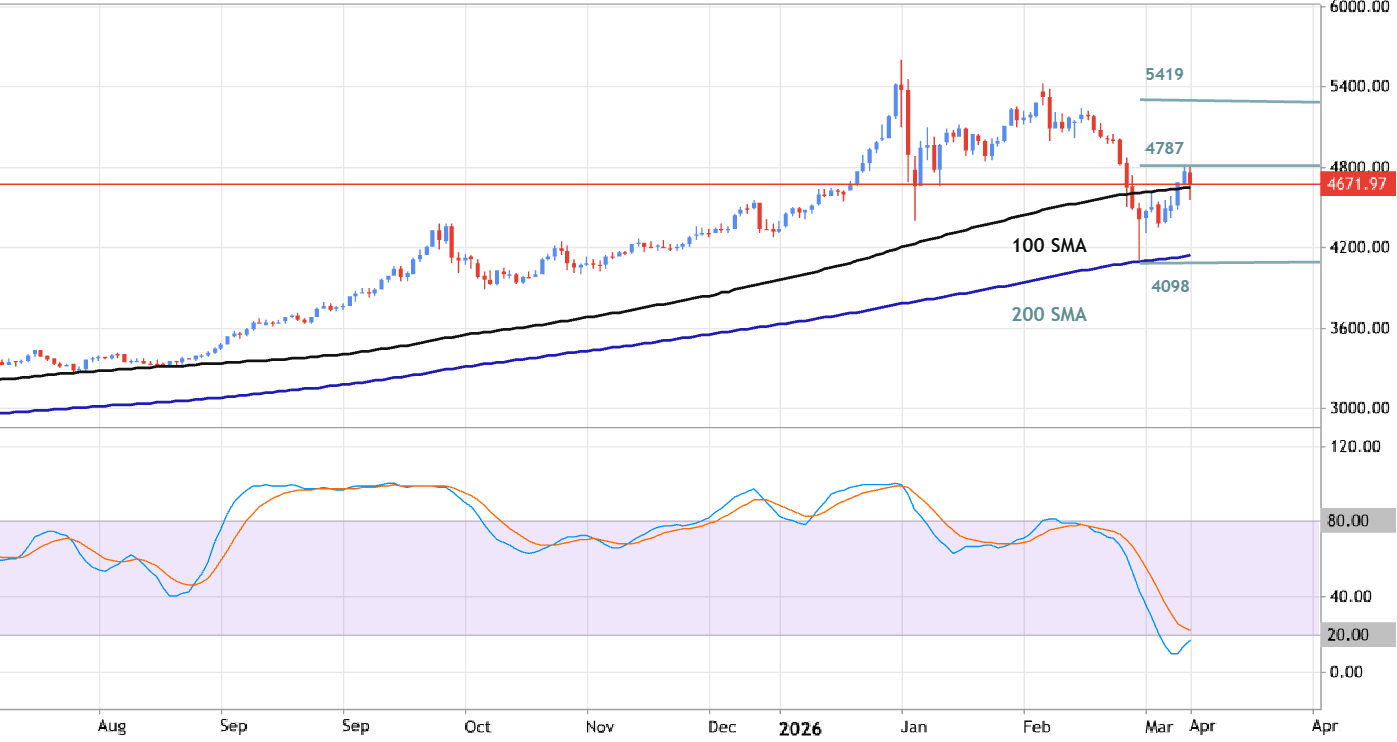
XAUUSD - Price Action Daily Analysis
Daily price was bounced from 200 SMA together with support level at 4098 to above for the primary daily bullish trend be continuing, and stochastic oscillator is indicating the oversold market codition. Ascending triangle pattern was formed for the price, and for now, the price is testing 4787 resistance for the daily bullish continuation with 5419 possible target for example. If the price is reversed to be back to 4098 support by crossing it to below so the primary daily bearish reversal will be started. Alternatively, the price will be on secondary ranging within 4098/4787 s/r channel waiting for the direction of the bullish trend to be continuing or for the bearish reversal to be started. Summary: daily bullish trend to be continuing
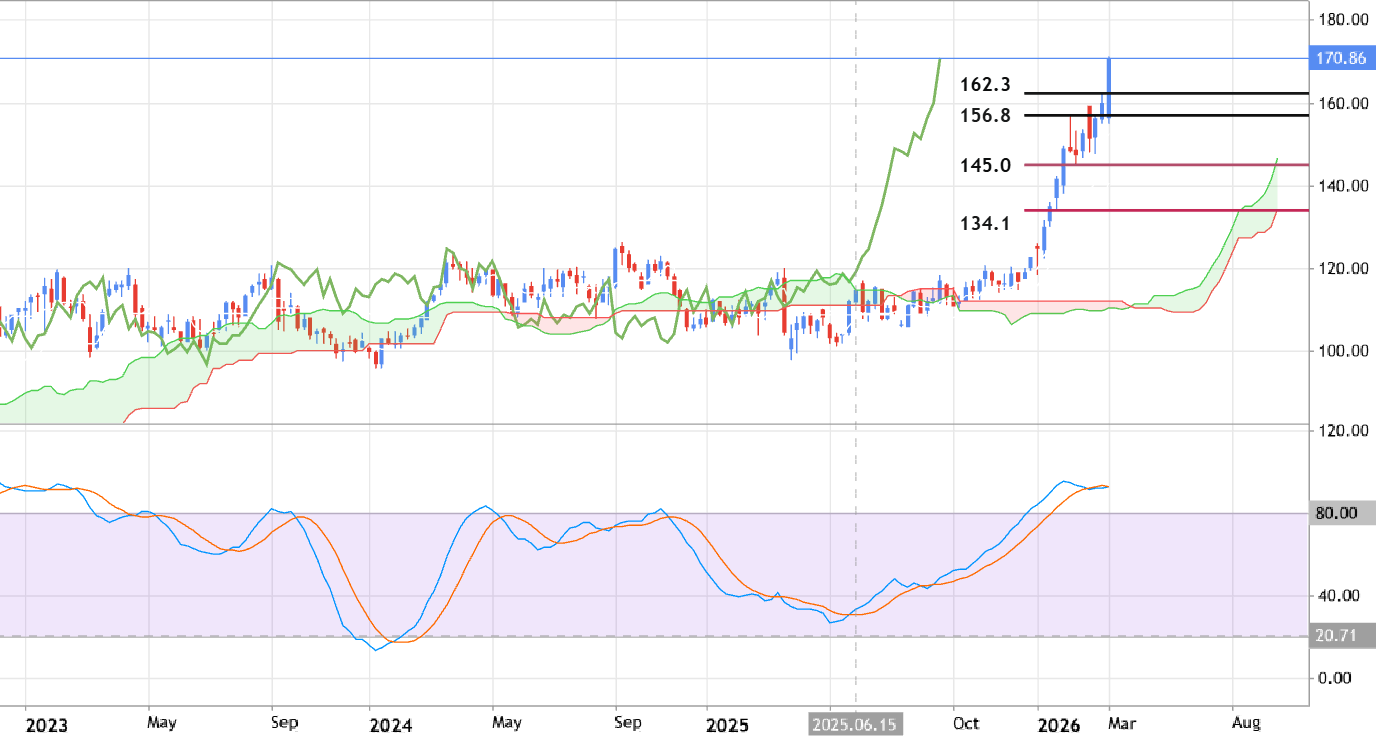

XOM Technical Analysis 2026
The weekly price is on bullish breakout: price broke the resistance lines to above for the strong bullish trend, and Chinkou Span line of Ichimoku indicator rossed historical price to above for the good strong bullish breakout for now. But Stochastic oscillator is indicating the overbought condition for the weekly price now, and if the price breaks 162.3 support to below with 156.8 possible target to re-enter so the secondary correction within the primary bullish trend will be started; and if the price breaks support level at 145.0 to below with 134.1 target to re-enter so the primary bearish reversal will be started; alternatively - the price will be on secondary ranging for direction.
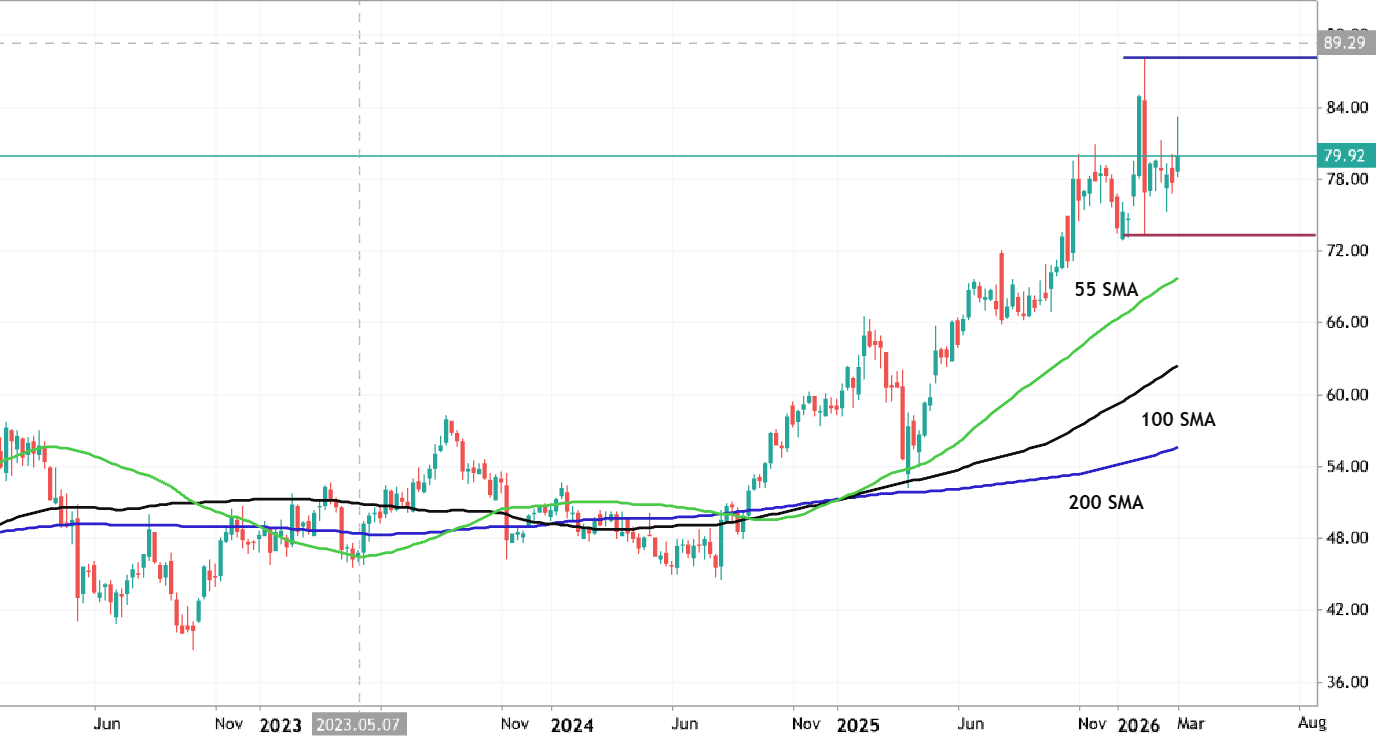

CSCO - Bullish Ranging for Direction
The weekly price is located far above 200 SMA in the primary bullish area of the chart. The price is located within 73.3/88.1 s/r channel waiting for the direction of the strong bullish trend to be continuing or the secondary correction to be started. Trading Summary: waiting for direction
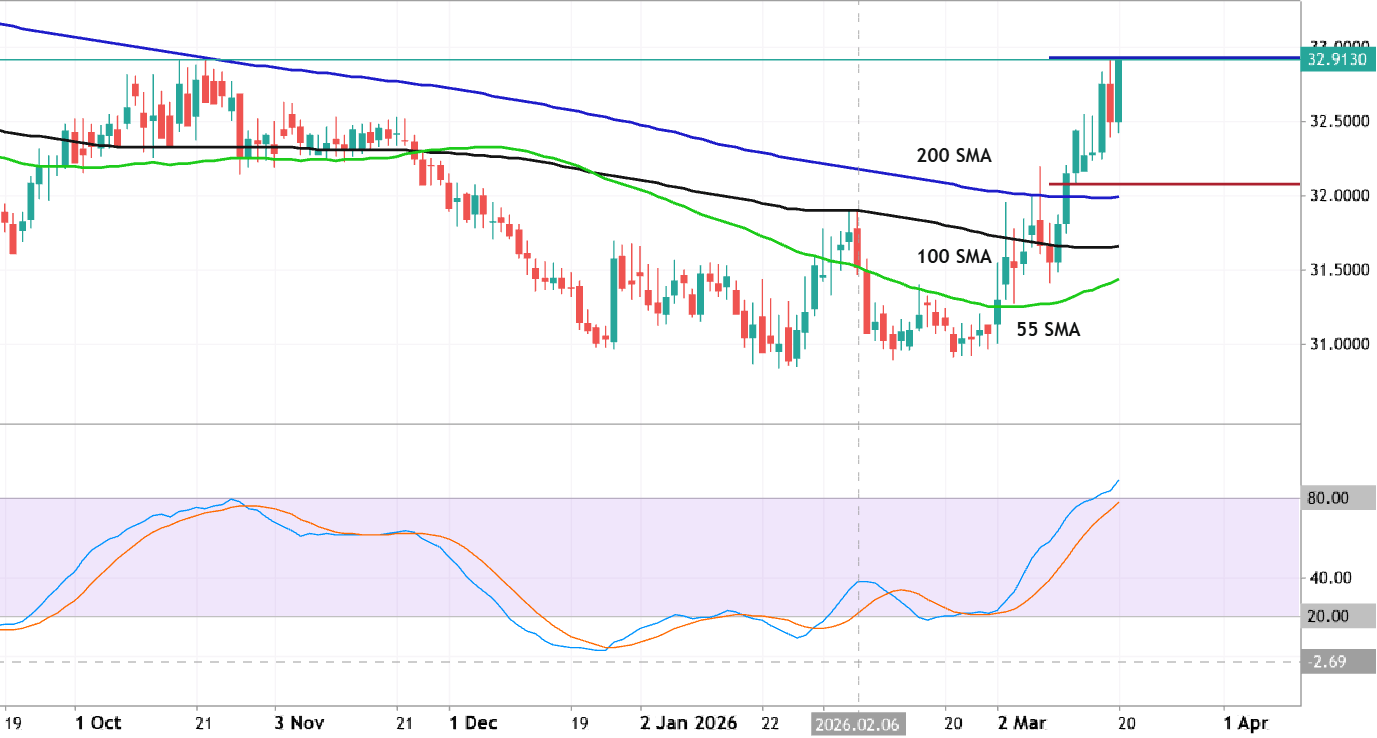
USDTHB Price Action Analysis: daily breakout with the bullish reversal
Daily price broke 200 SMA to above for the good daily breakout with the primary bullish reversal. The price is testing the resistance level at 32.93 to above for the daily bullish trend to be continuing. But the Stochastic Oscillator is indicating the overbought level for the price movement so the alternative way for the price movement is the secondary daily ranging within 32.07/32.93 s/r channel waiting for direction of the strong bullish trend to be continuing or the bearish reversal to be started. Trading Summary: waiting for direction.
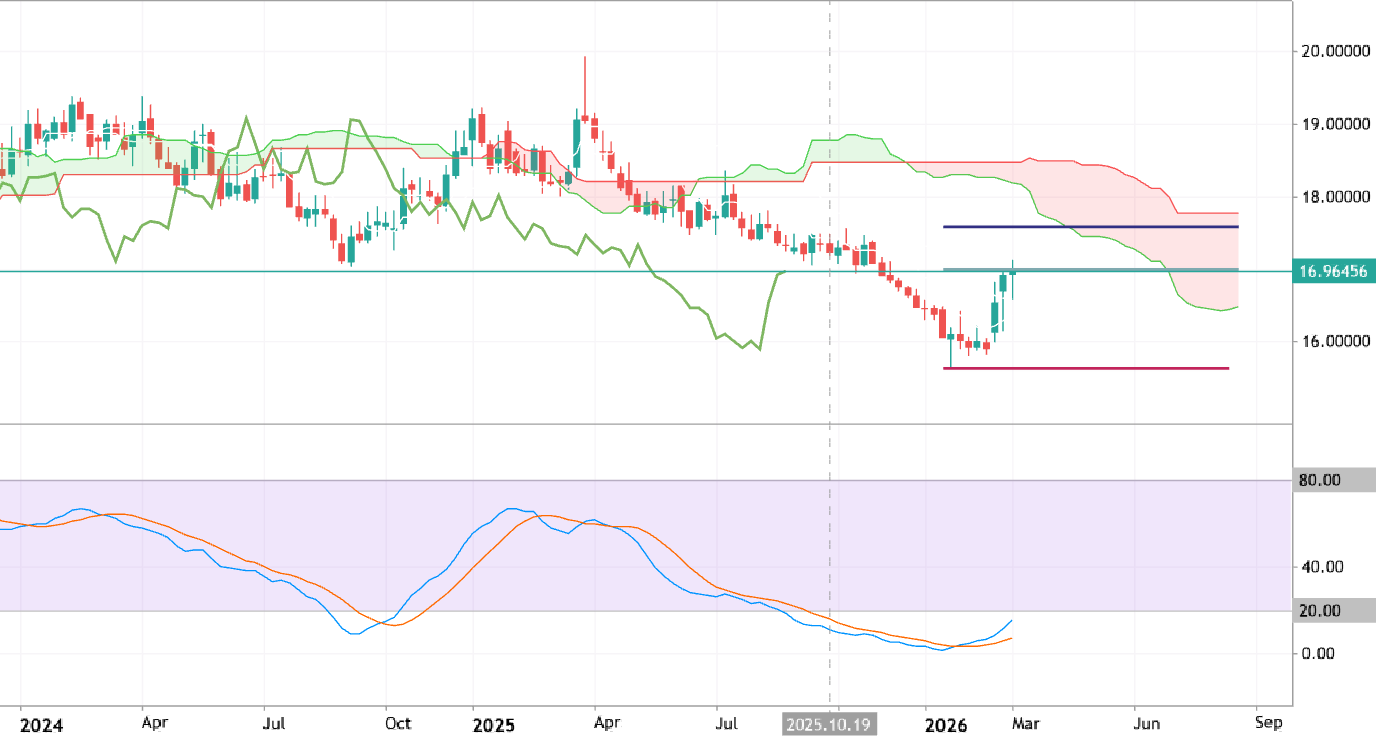
Trading Ideas for 2026: USD/ZAR - Technical Forecast and Levels
Weekly price is located below Ichimoku cloud in the bearish area of the chart. The price was bounced from support level at 15.63 to above for the bear market rally to be started for trying to break the resistance at 17.00 to above for the secondary rally to be continuing. Stochastic oscillator is indicating the oversold level of the price, and Chinkou Spam line of Ichimoku indicator is located to be near historical price from below to be ready to cross it to above for the good breakout to be started. If the price breaks 17.00 resistance to above on weekly close bar so the breakout may be started with the 17.57 bullish reversal target to re-enter, or the price will be on secondary ranging waiting for the direction of the good trend to e started. Trading Summary: future possible breakout with the bullish reversal, alternatively - ranging within s/r channel for direction.
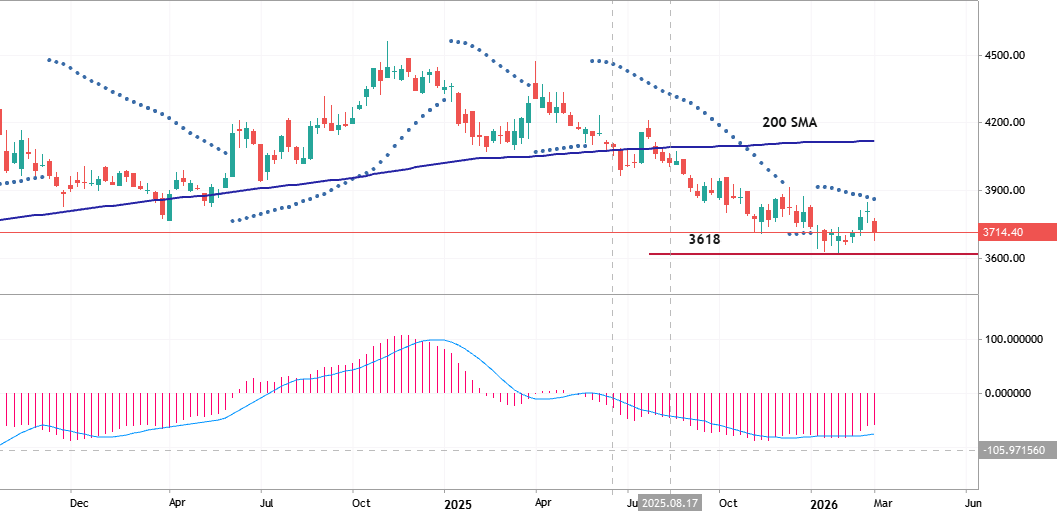
USDCOP: Ranging for Direction
Weekly price is below 200 SMA in the bearish area of the chart: the price is on ranging within 200 SMA and 3608 support waiting for the direction of the primary bearish trend to be resumed with 3402 possible target to re-enter or the bullosh reversal to be started in case the price breaks 200 SMA on close weekly bar for example. Summary: ranging waiting for direction.
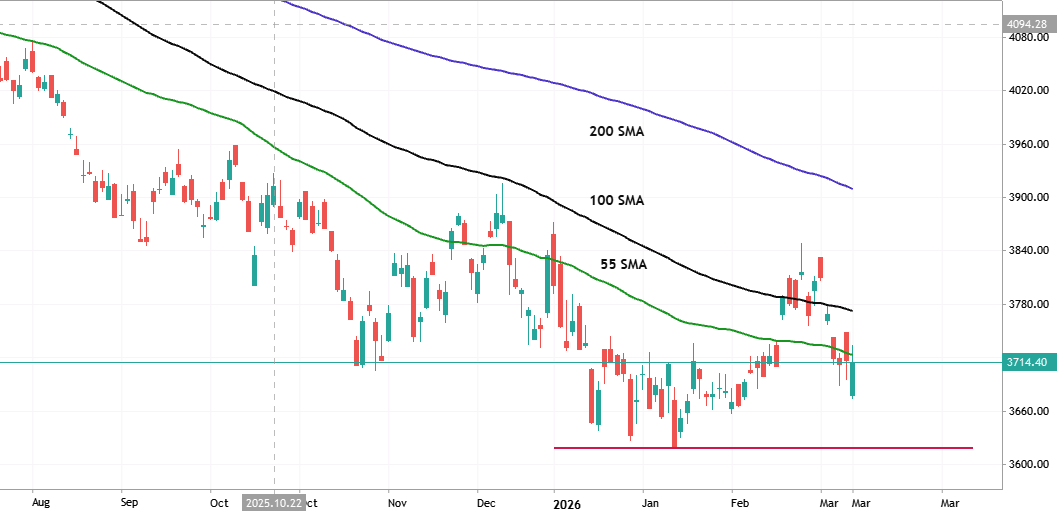
USD/COP Price Action Analysis
Daily price is located below 200 SMA in the bearish area of the chart. The price was bounced from 55 SMA to below for the daily bearish trend to be continuing with support level at 3618 as the nearest target to re-enter. Alternatively, the price will be on secondary ranging within the primary bearish market condition waiting for direction. Trading Summary: daily bearish trend to be resumed.