

 Apri profilo MQL5
Grafici & Idee
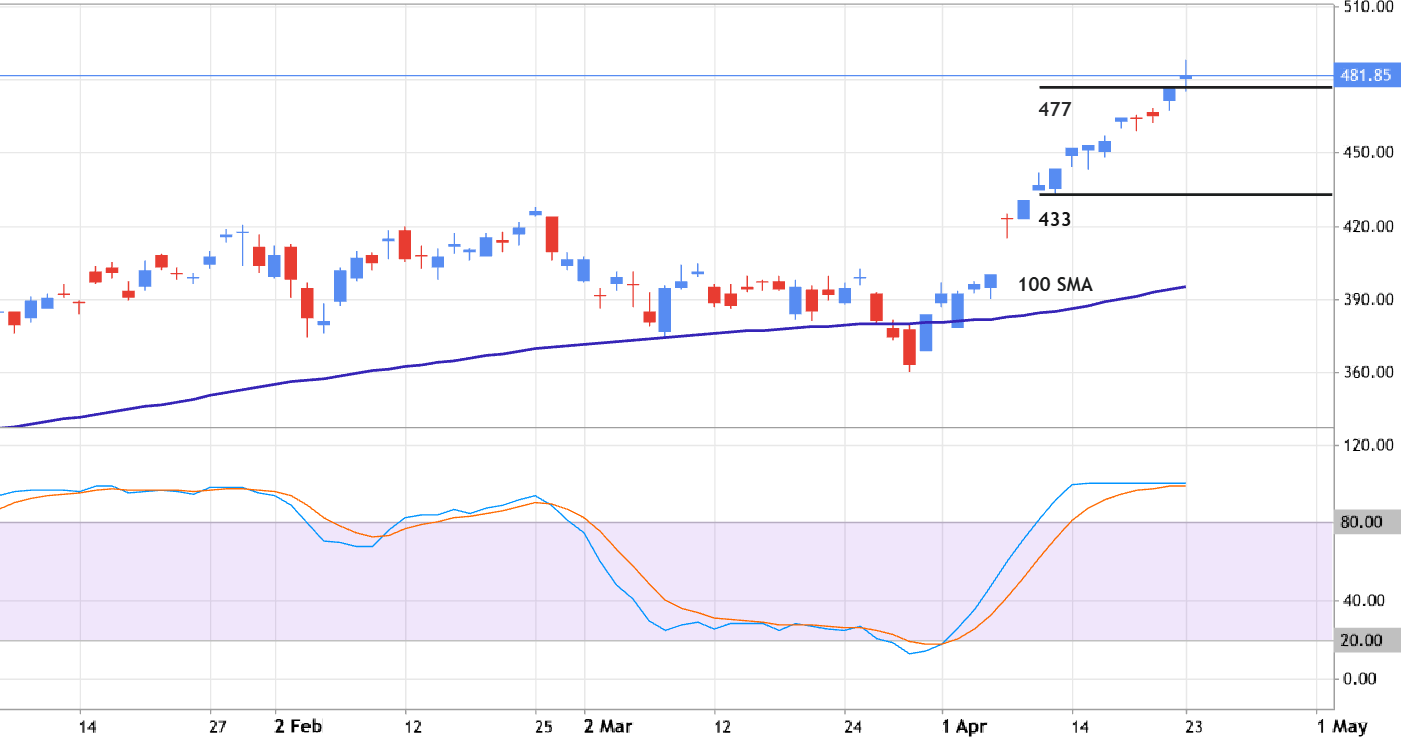

Stochastics - traditional general approach to identify the short-term reversals
Stochastic with 34-5-5 settings is the "fast" version of it, and it is used to identify the possible reversals in short-term situation and/or in lower timeframes for example: overbought/oversold market condition in the current market for example. It is used with the other indicators for trading such as 55 SMA, 100 SMA, "medium"/"slow" version of Stochastic and more.
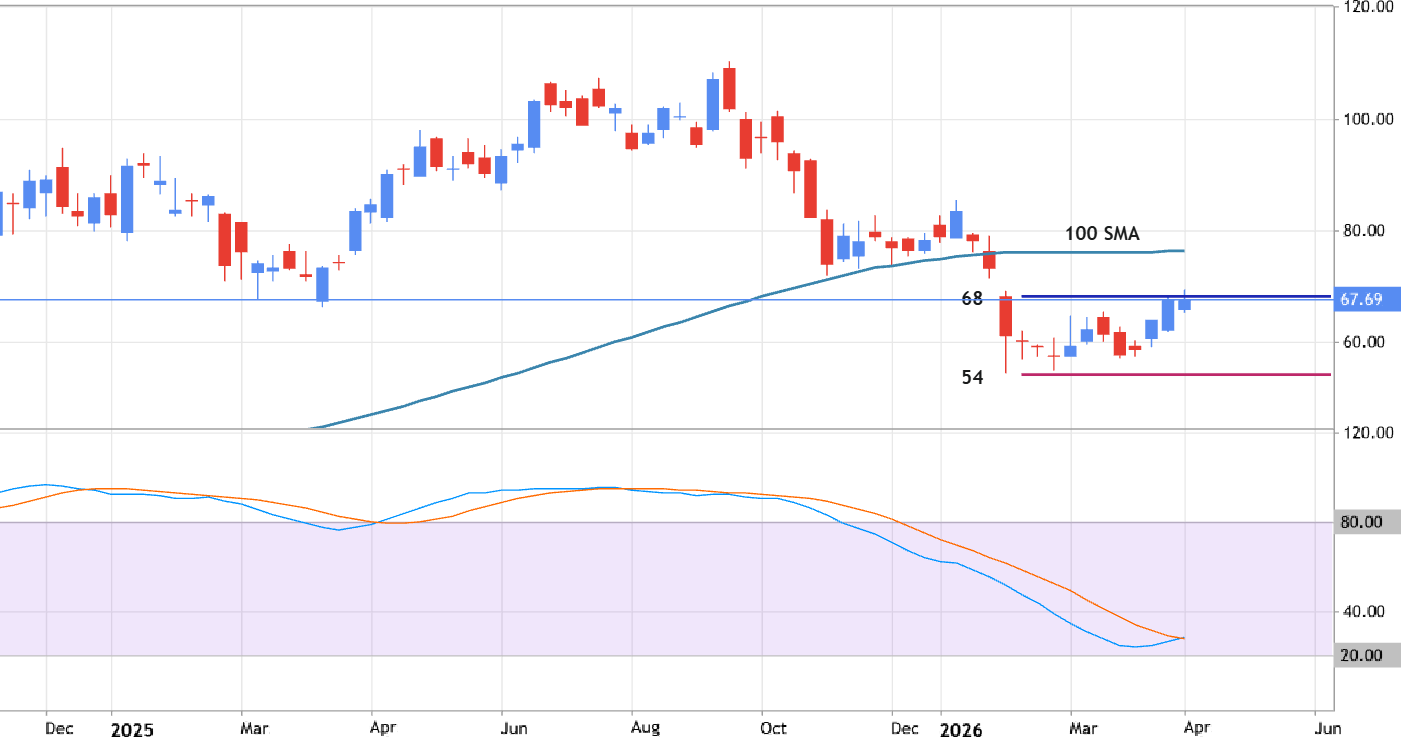

Stochastics - traditional general approach to identify the long-term reversals
Stochastic with 100-8-8 settings is "slow" version of it, and it is used to identify the possible reversals in long-term situation and/or in higher timeframes for example. And because of that - the indicator with the parameters are used to estimate the possible overbought/oversold market condition in the long-term to confirm, and it should be used with the other indicators for trading for example.
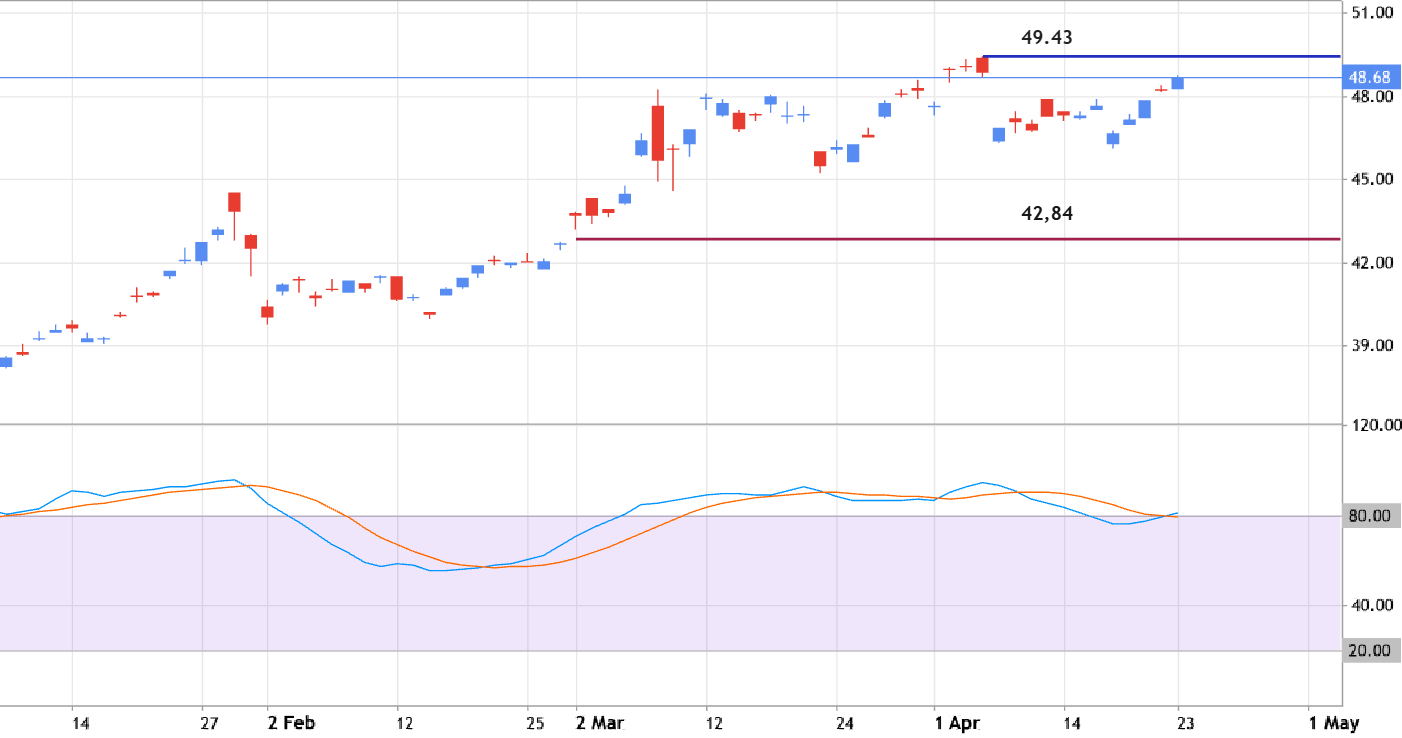

Stochastics - traditional general approach to filter the market noise
The Stochastic Oscillator with settings 55-8-8 is used to filter out market noise compared to the standard setting. Besides, when the oscillator rises above 80 so it indicates an overbought market condition, and below 20 is indicating the oversold condition. This 55-8-8 setting is better to be used for trend-following strategies as well as the trade during the market reversal situation for example.
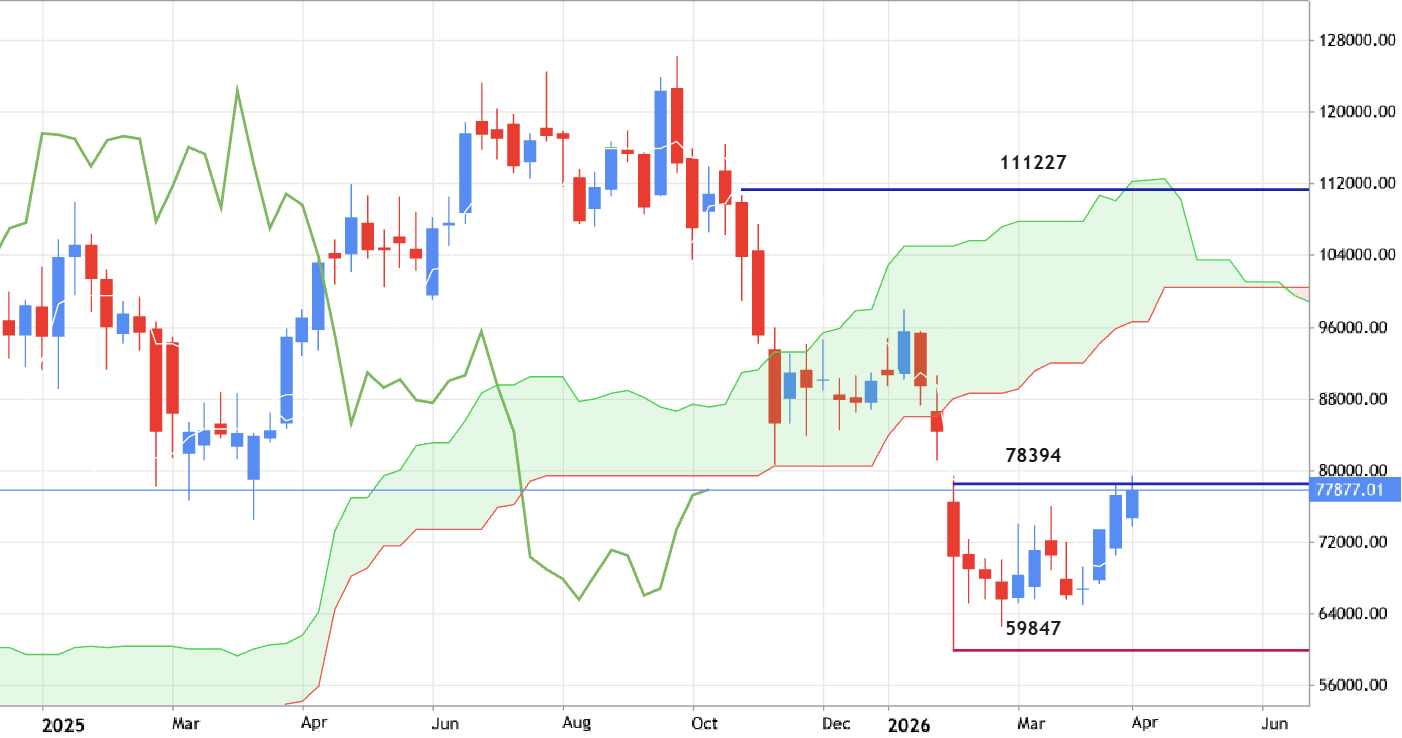
BTCUSD - Trading Ideas for 2026: Technical Forecast and Levels
Weekly price is below Ichimoku oud in the bearish area of the chart. The price is located within 59847/78394 s/r channel for trying to break the resistance level at 78394 to above for the bear market rally to be started. If the price crosses 59847 to below so the primary bearish trend will be continuing. Alternatively, the price will be on secondary ranging within s/r channel. Recommendation : watch the price to cross support or resistance level on weekly close bar for possible sell or buy position for example.
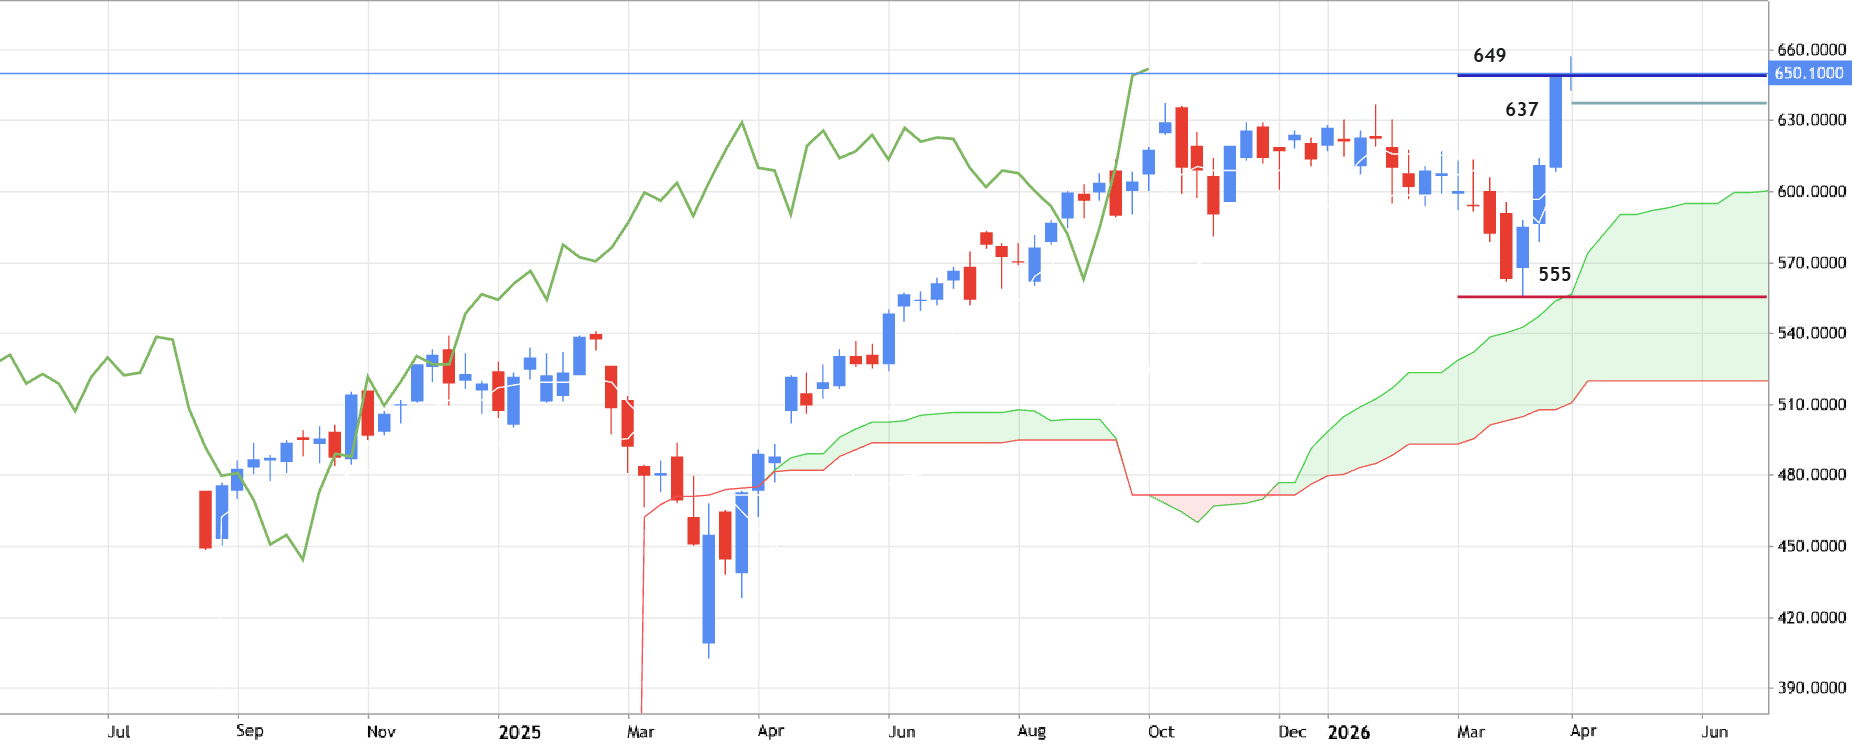

QQQ - Technical Analysis 2026
Weekly price is trying to break the resistance level at 649 to above for the strong bullish breakout to be continuing. The Chinkou Span line of Ichimoku indicator is crossed the historical price to above indicating the breakout to be continuing in the near future. If the price breaks support level at 637 to below so the secondary correction will be started; if the price crosses the support at 555 so the primary weekly bearish reversal may be started in the secondary ranging way; if the price breaks 649 resistance level on weekly close bar so the strong bullish breakout may be continuing. Trading Summary : watch the price to be crossed with the levels for possible buy or sell trades on the lower timeframes for example.
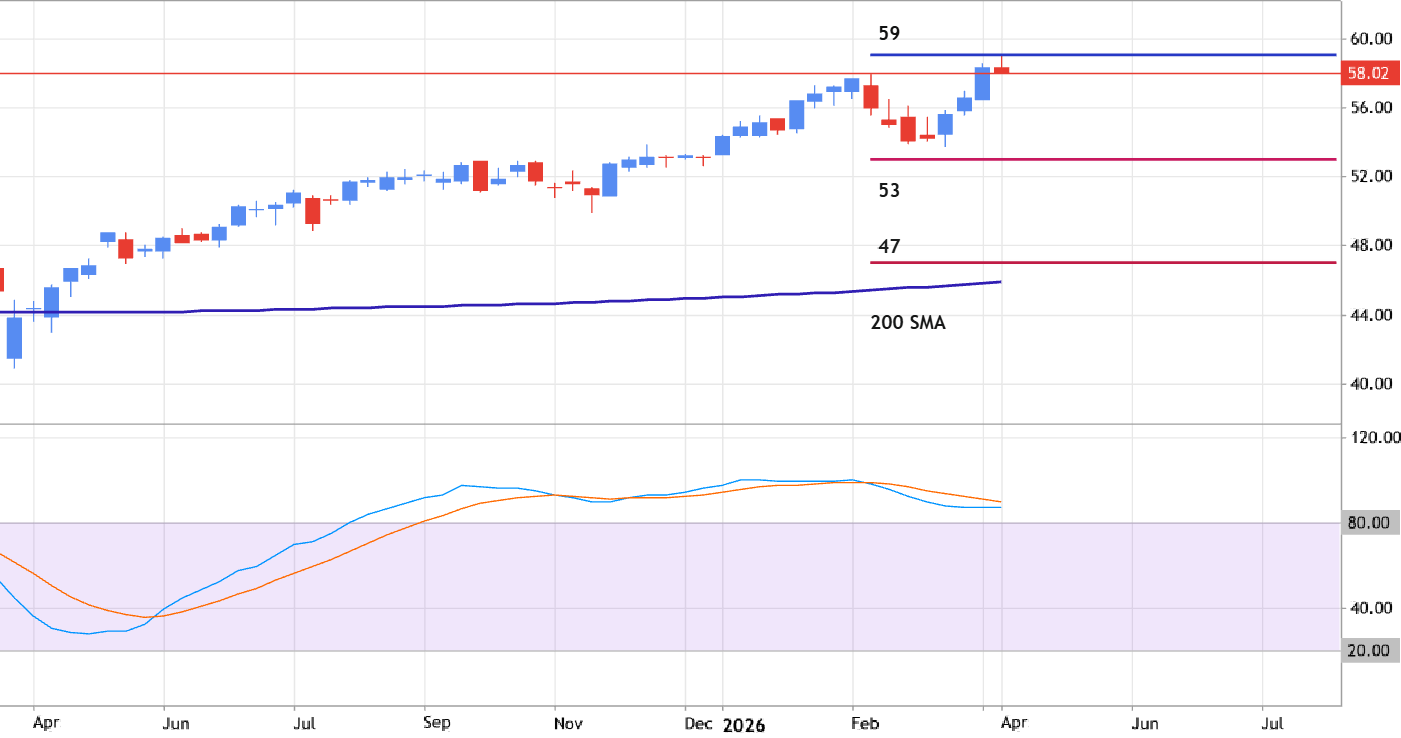

EQAL - Long-Term Technical Forecast and Levels
Weekly price is located above 200 SMA for trying to break the resistance level at 59 to above for the strong bullish trend to be continuing.
The price is within 53/59 s/r channel for the secondary correction to be started with 47 level as the possible re-enter target for the bearish reversal or for the bullish trend to be continuing with the resistance lebel at 59 to be broken above.
The Stochastic oscillator is on overbought condition indicating the secondary correction to be started in the near future. Trading Summary: waiting for the levels to be crossed on close weekly bar for possible direction in lower/intra-day chart for example.
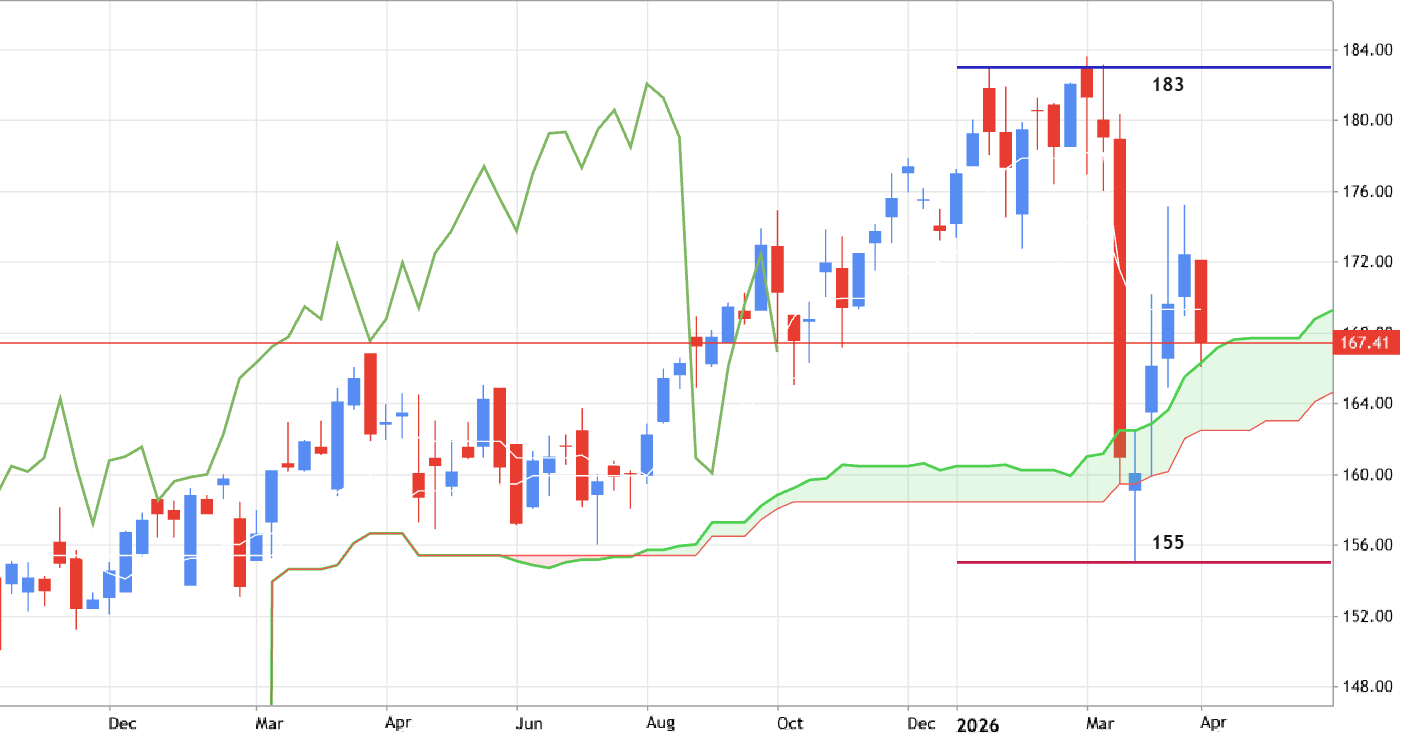

GLDI - Trading Ideas for 2026
Weekly price is located above Ichimoku loud for ranging within 155/183 s/r channel waiting for the direction of the strong trend to be resumed or for the primary bearish reversal to be started. - if the price crosses resistance level at 183 so the strong bullish trend will be resumed;
- if the price breaks 155 support to below so the bearish reversal will be started;
- alternatively, the price will be on secondary ranging within the primary bullish waiting for direction. Trading Summary: watch the price to be crossed s/r levels on close weekly bar.
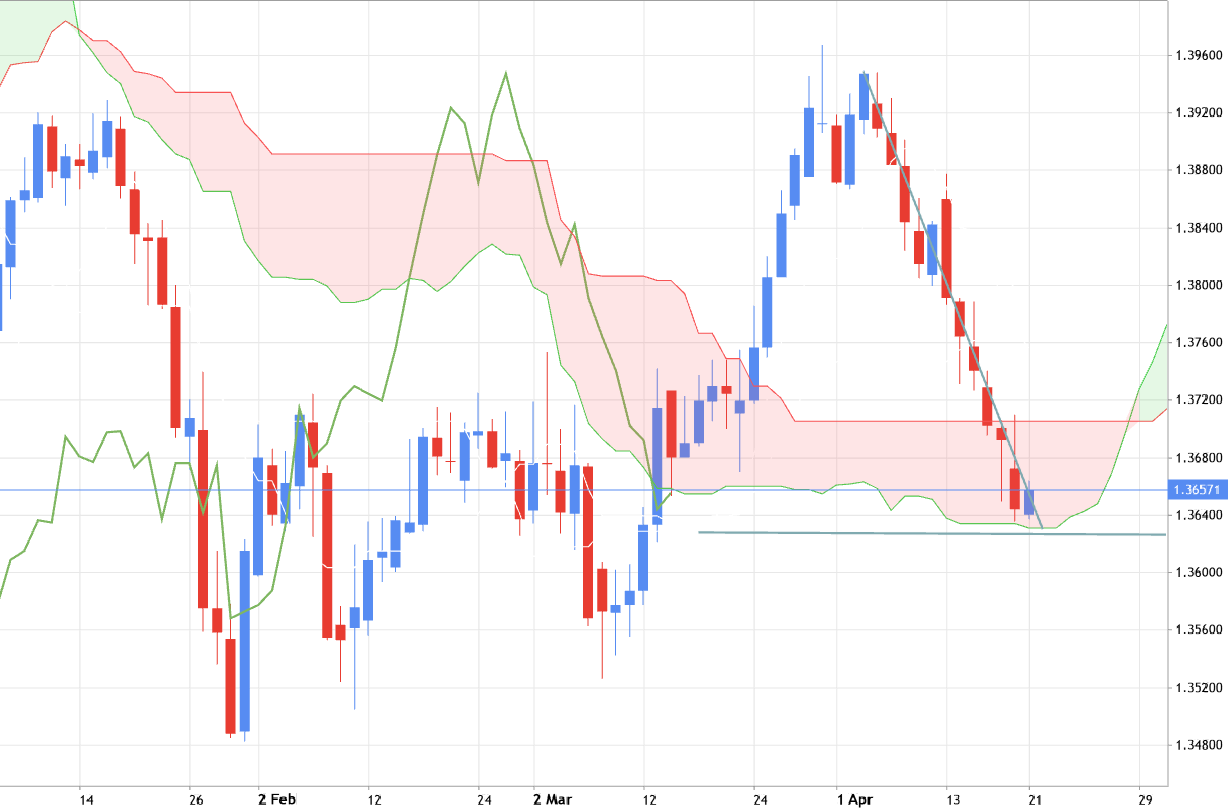
USDCAD - possible daily bearish reversal
Chinkou Span line of Ichimoku indicator is breaking the historical price to below, and daily price is crossing the Ichimoku cloud to for the possible daily breakdown with the primary bearish reversal. Summary: watch the price to be crossed the support level on daily close bar for possible sell trade
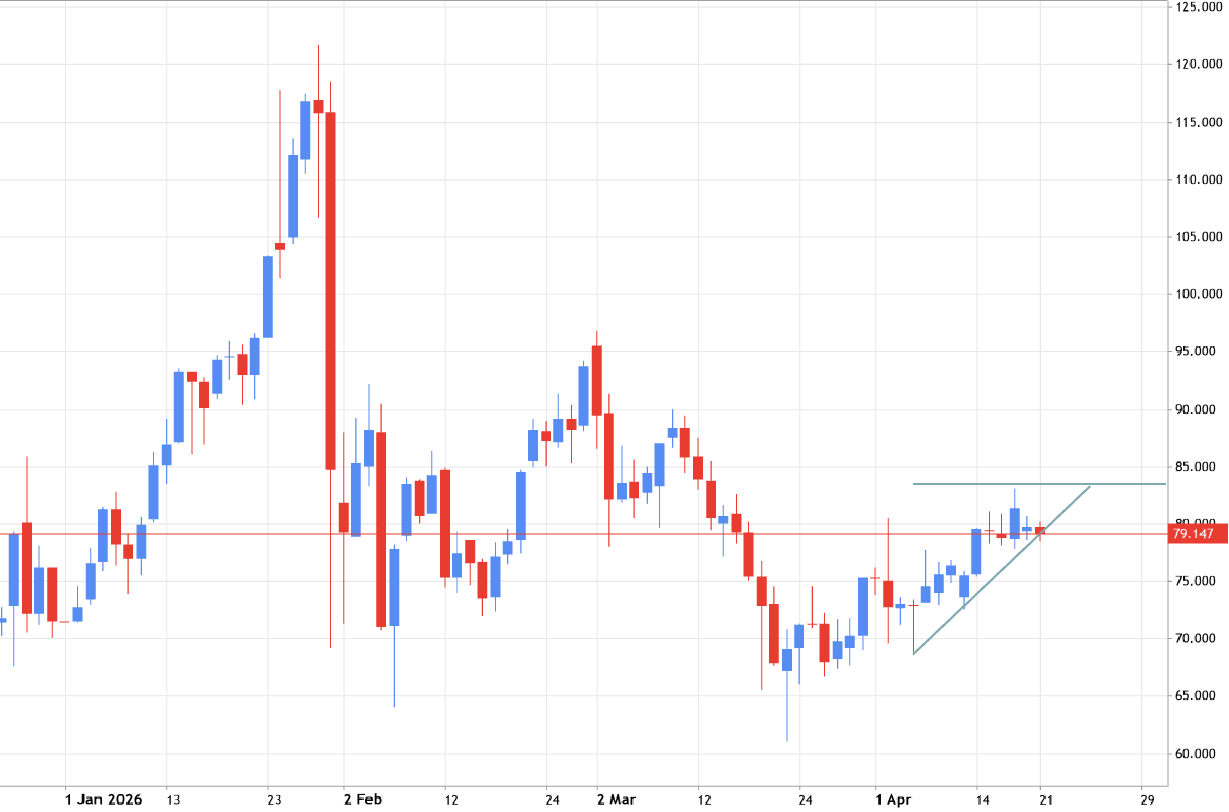
XAGUSD - possible breakout
The daily price is formed with Ascending Triangle Pattern for the possible daily bullish breakout
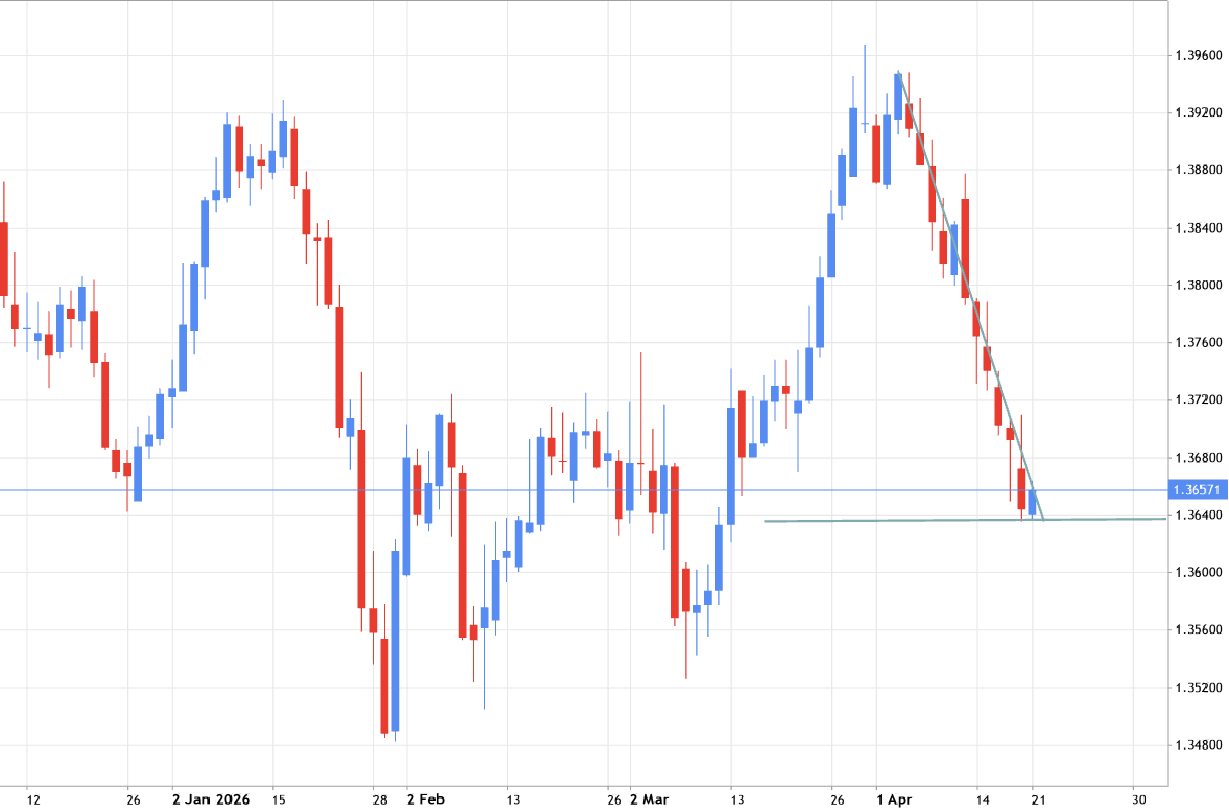
USDCAD - Descending Triangle Pattern to be formed for breakdown
The daily price is formed the pattern for possible daily bearish breakdown
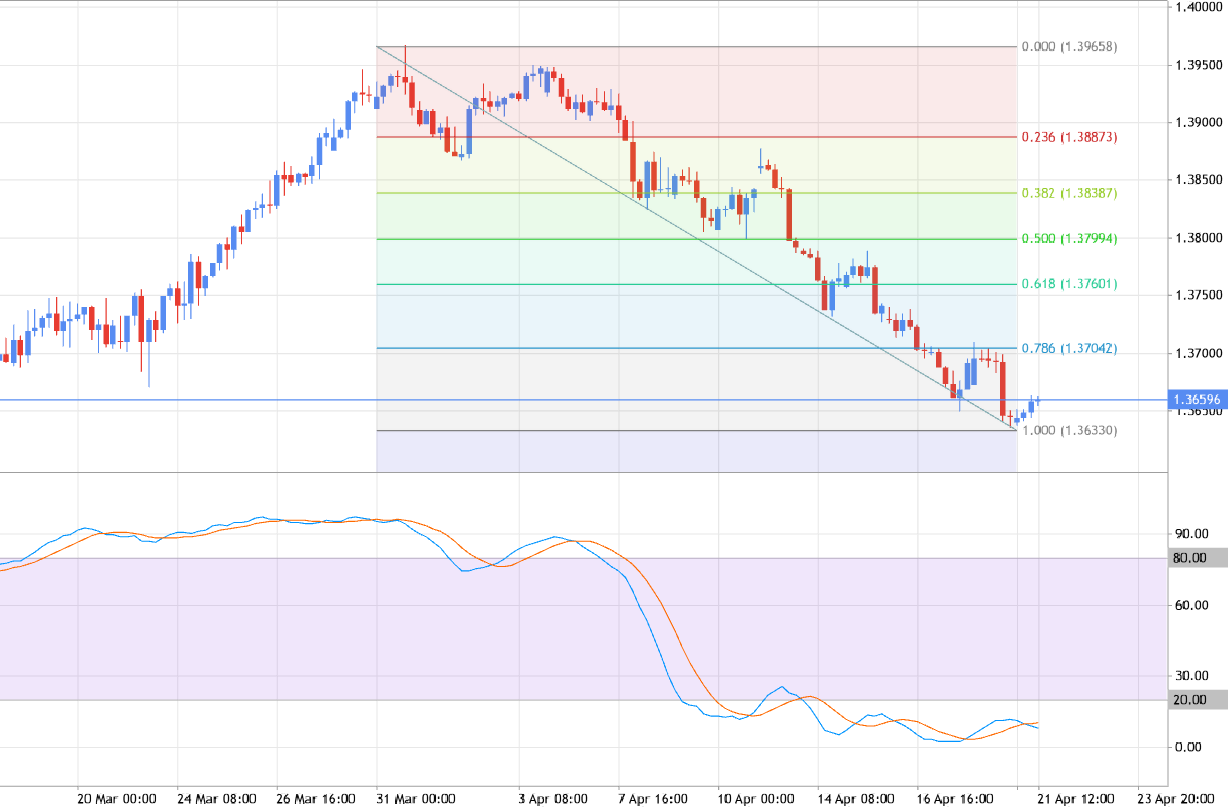
USDCAD - bounced from Fibo support level
The H4 price was bounced from Fibo support level to above for the rally to be started
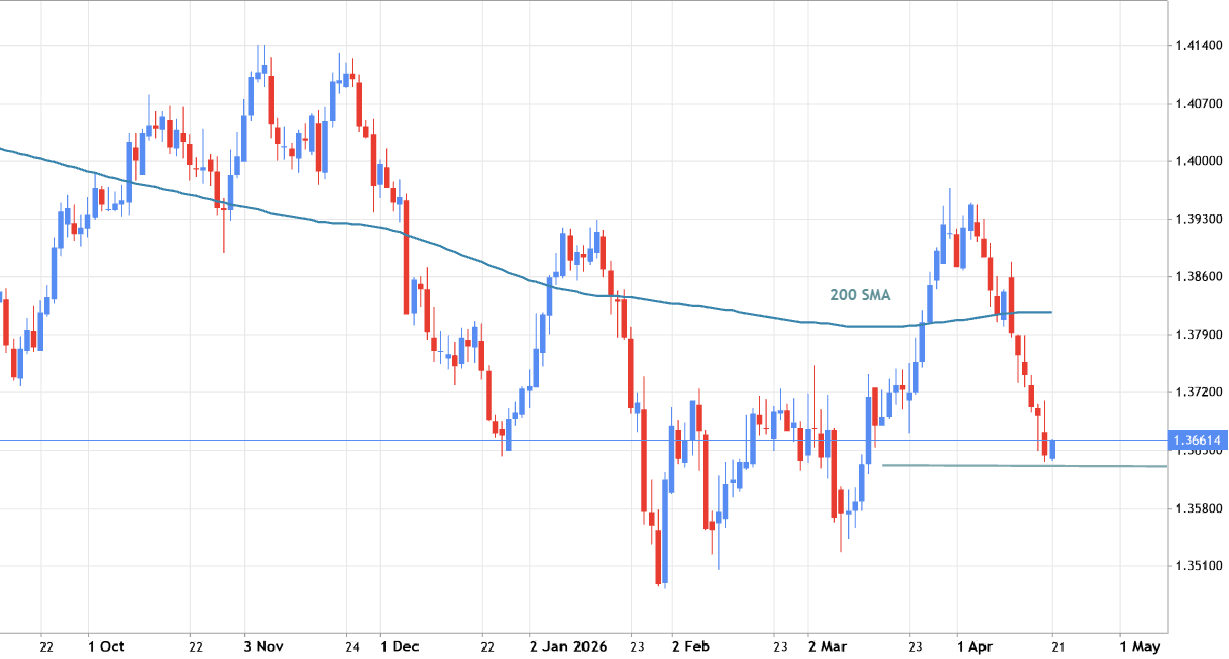
USDCAD - Daily Trading Idea
Daily price is located below 200 SMA in the bearish area of the chart. The price is trying to break the support level to below for the primary bearish trend to be continuing. Summary: wait for the price to break the support to below