EUR/USD – Bearish Structure Under Resistance EURUSD Short Euro vs US Dollar

EUR/USD – Bearish Structure Under Resistance

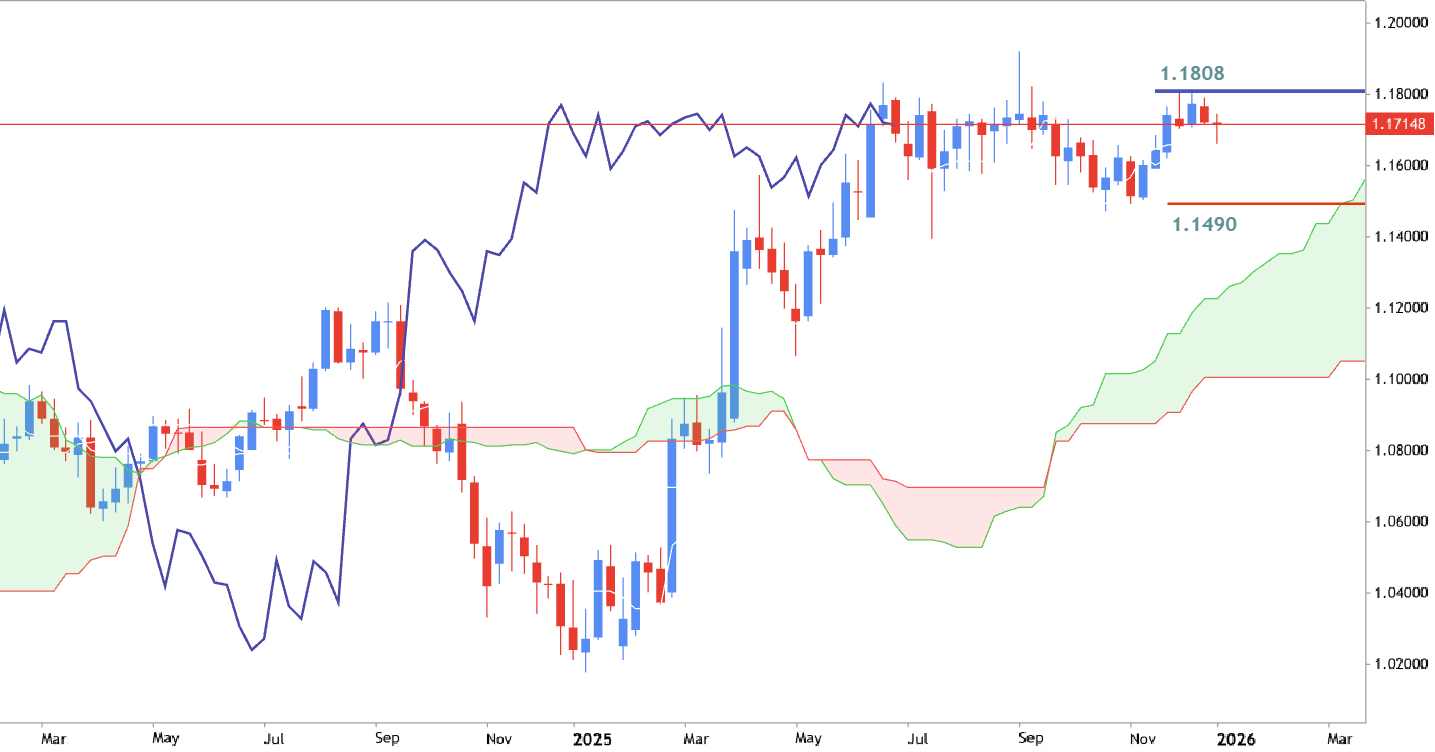
EUR/USD – Bearish Structure Under Resistance Trend: Lower highs forming → descending trendline intact (bearish pressure) Key Zone: 1.1780 – 1.1820 (strong resistance + rejection area) Confirmation: Price failing to break above zone + respecting trendline Sell Trigger: Break below 1.1700 support (clean bearish momentum) Targets: 1.1550 1.1400 (major support) ❌ Invalidation: Sustained close above 1.1820 (trendline breakout) — Clean setup: rejection + structure = downside continuation bias.
XRPUSD - Long-Term Technical Forecast XRPUSD Ripple vs US Dollar

XRPUSD - Long-Term Technical Forecast

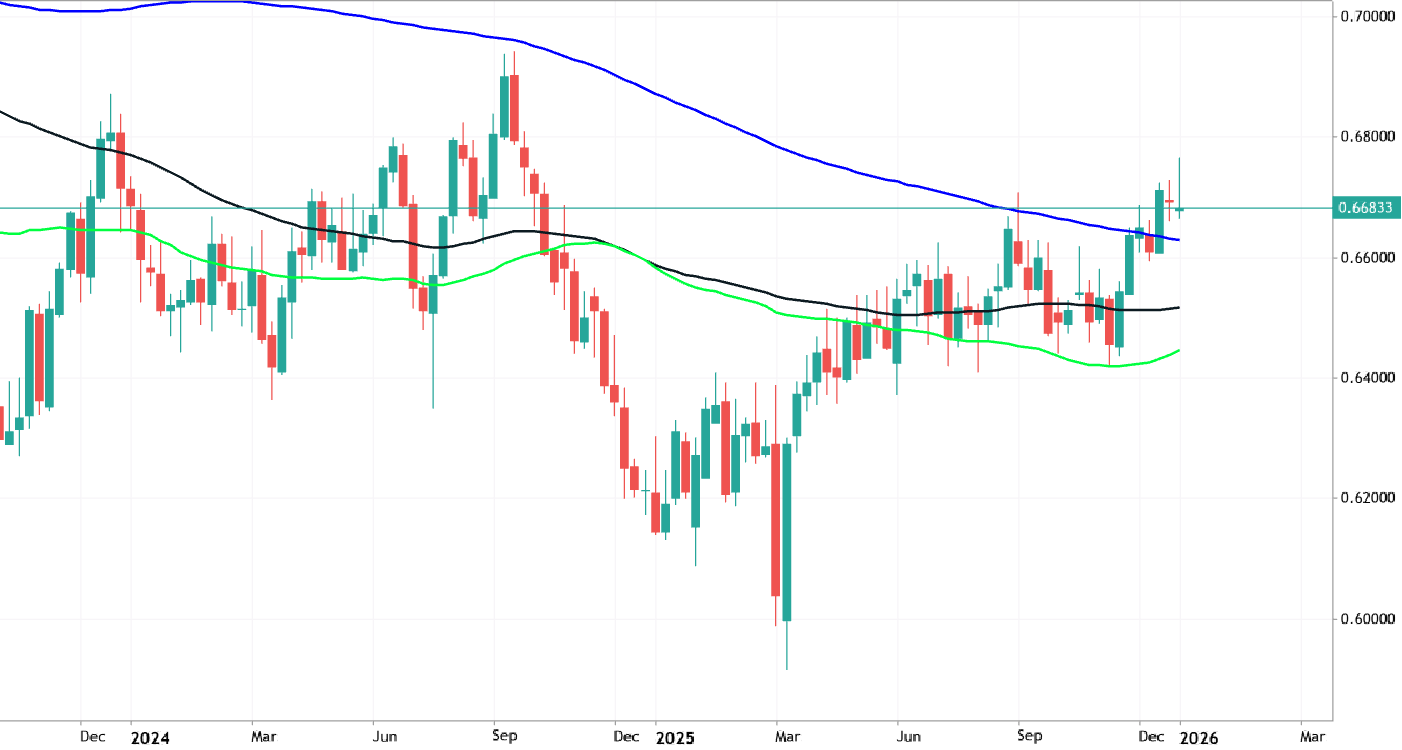
Weekly price is on ranging near and above 200 SMA in the bullish area of the chart. The price is located within 1.2782/1.6072 s/r channel waiting for the bullish trend to be continuing with 1.6072 resistance to be broken on close weekly bar or for the primary weekly bearish reversal to be started with the price to be crossed 200 SMA together with 1.2782 support level to below. Stochastic oscillator is on oversold market condition so the most likely scenario is the primary bullish trend to be resumed. Trading Summary : waiting for direction
gold analysis for next week XAUUSD Long Gold vs US Dollar

gold analysis for next week

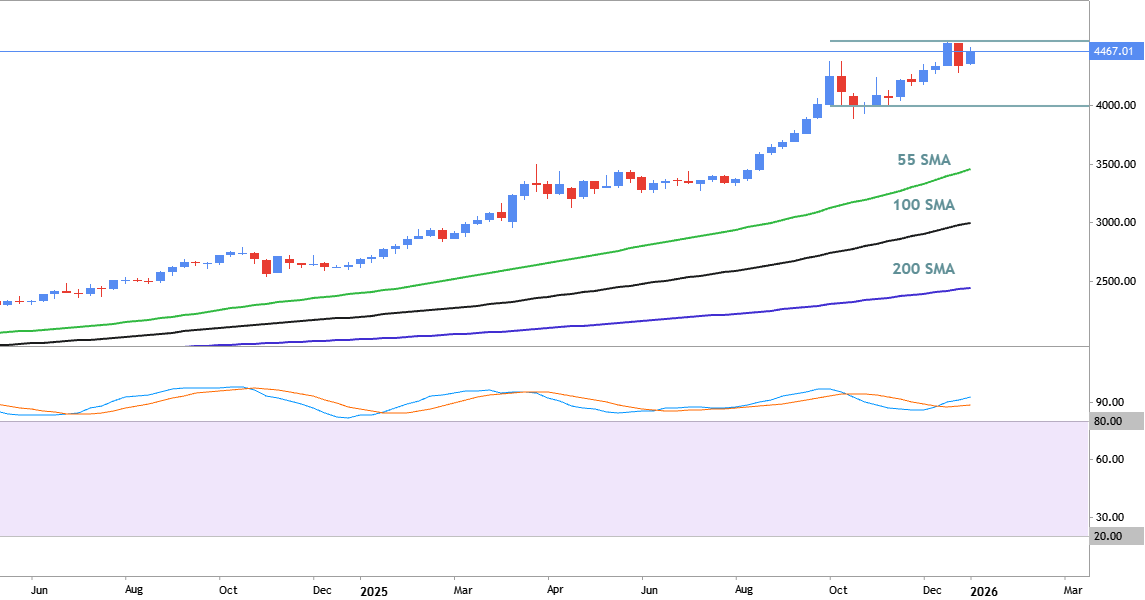
Market structure: Clear downtrend (series of lower highs + descending trendline still respected). Current pattern: Price is compressing into a symmetrical triangle right at ~4610 support/resistance flip zone. Key levels: Support: ~4590–4600 Resistance: ~4635–4650 (triangle top + trendline) Major target zone above: ~4725 Scenarios: Bullish: Break + hold above triangle & trendline → momentum push toward ~4700–4730 Bearish: Rejection here → continuation of overall downtrend → retest 4550 → possibly lower Bias: Neutral → waiting for breakout confirmation (trend is bearish, but structure is coiling). Smart takeaway: No edge inside the triangle — trade the breakout, not the guess.
Brent (XBRUSD) Analysis XBRUSD Short Brent Oil vs US Dollar

Brent (XBRUSD) Analysis

Brent is trading in a strong uptrend, with price approaching the 1.000 Fibonacci resistance (~120.60) after a sustained bullish move. The market is currently overextended to the upside, testing key resistance levels, suggesting a possible breakout or pullback scenario. A break above 120.60 will open the way toward 132.00 (next Fibonacci expansion level); A rejection from current resistance may trigger a pullback toward 106.00 – 100.00 support zone
IBIT - Trading Ideas for 2026 IBIT iShares Bitcoin Trust ETF

IBIT - Trading Ideas for 2026

The weekly price is located near and below Ichimoku cloud in the bearish area of the chart for the secondary ranging within 35/45 s/r channel waiting for the direction of the bearish trend to be continuing or for the bear market rally to the possible bullish reversal to be started. There are key s/r levels for possible breakout and breakdown to be formed, for example: 26 support for possible bearish breakdown and resistance level at 56 for the possible bullish breakout. Trading Summary : wait for the s/r levels to be crossed on the close weekly bar for the bearish trend to be continuing or for the rally-to-reversal to be started.
XNGUSD - Long-Term Technical Forecast XNGUSD Natural Gas vs US Dollar

XNGUSD - Long-Term Technical Forecast

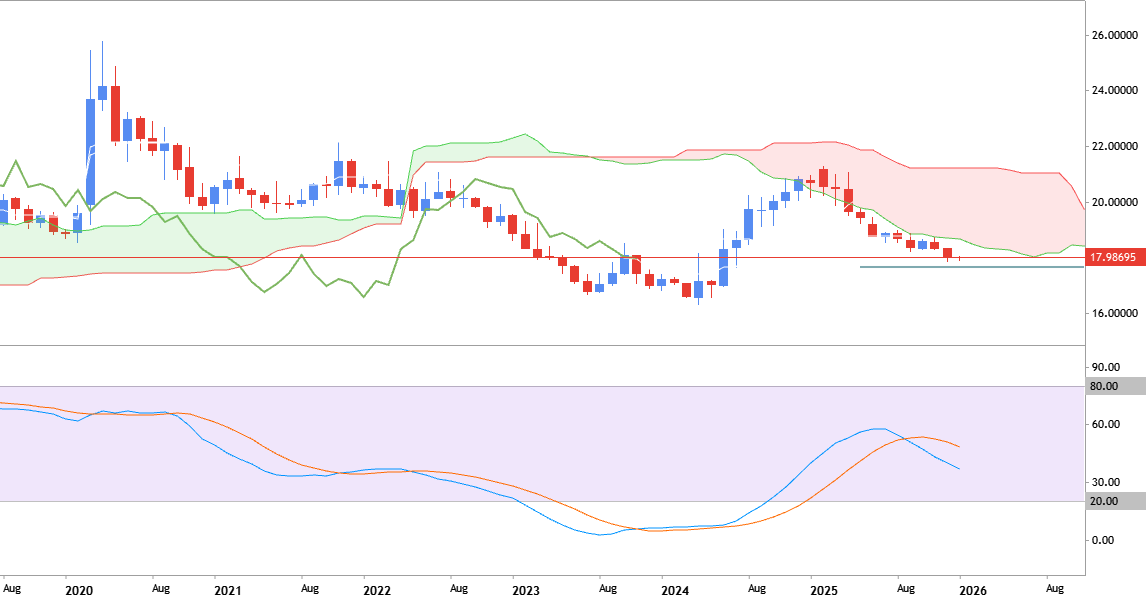
The weekly price is located below Ichimoku loud in the bearish area of the chart. The price is on ranging to be near and below Ichimoku cloud for trying to break the support level at 2.555 to below for the bearish ranging trend to be continuing. Alternatively (and based on fundamental factors) the price will be bounced from the support level to above for the primary bullish reversal to be started. Most likely scenario : ranging
NVDA NVDA NVIDIA Corporation - Common Stock

NVDA

Trendline Rejection vs Breakout Primary Bias: Bearish Rejection The confluence of the downtrend line and the 200 psychological level suggests sellers may defend this zone. If price fails to close above 200, expect a pullback toward the green support zone (~192–194). Execution Plan: Entry: Short near 199.50–200.00 with bearish candlestick confirmation (shooting star, bearish engulfing). Stop‑loss: Above 202.50 (beyond the trendline and resistance zone). Targets: TP1: 194.00 (green zone). TP2: 190.00 (blue zone). Risk/Reward: Aim for at least 1:2. Alternative Bias: Bullish Breakout A decisive close above 202 would invalidate the trendline resistance. Breakout traders could then target the purple zone (~206–208). Execution Plan: Entry: Buy on breakout retest above 202.00. Stop‑loss: Below
BTCUSD - Trading Ideas for 2026: Technical Forecast and Levels BTCUSD Bitcoin vs US Dollar

BTCUSD - Trading Ideas for 2026: Technical Forecast and Levels

Weekly price is below Ichimoku oud in the bearish area of the chart. The price is located within 59847/78394 s/r channel for trying to break the resistance level at 78394 to above for the bear market rally to be started. If the price crosses 59847 to below so the primary bearish trend will be continuing. Alternatively, the price will be on secondary ranging within s/r channel. Recommendation : watch the price to cross support or resistance level on weekly close bar for possible sell or buy position for example.
QQQ - Technical Analysis 2026 QQQ Invesco QQQ Trust, Series 1

QQQ - Technical Analysis 2026

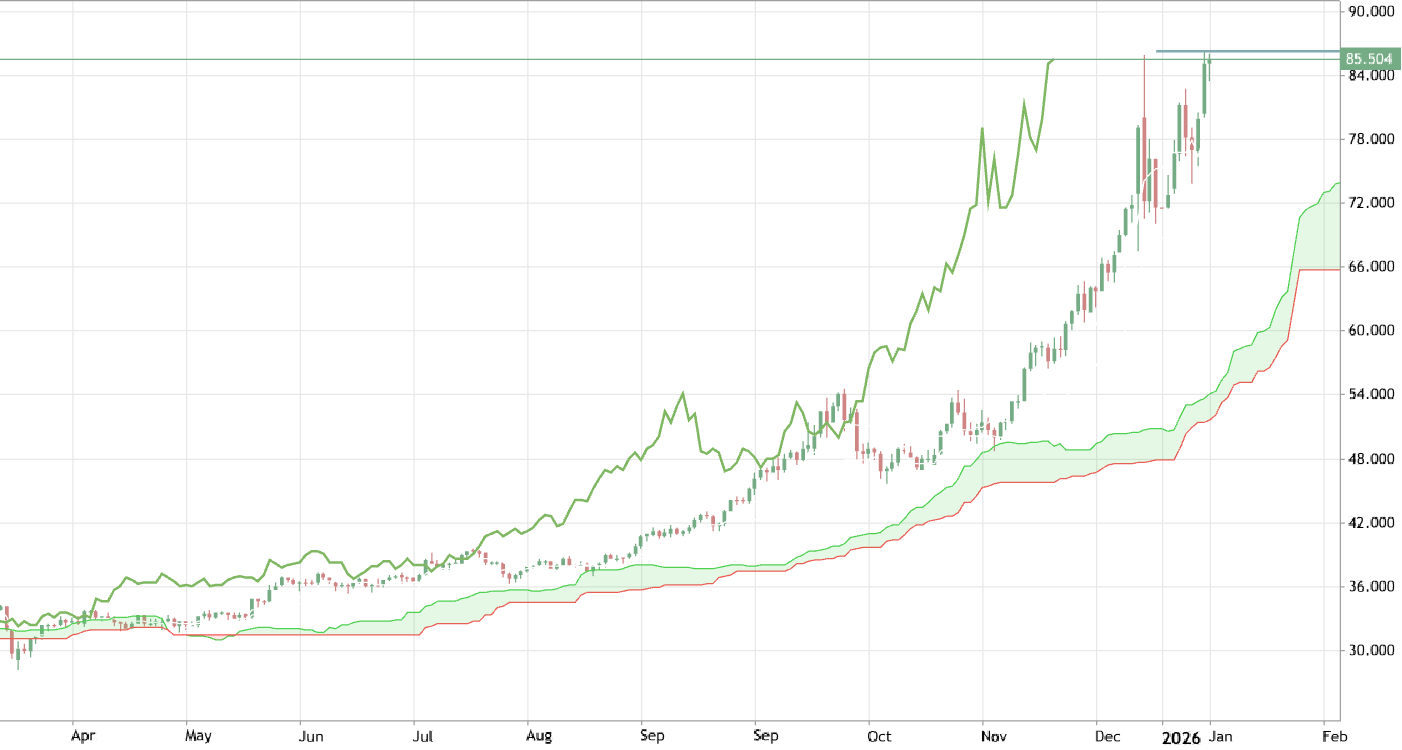
Weekly price is trying to break the resistance level at 649 to above for the strong bullish breakout to be continuing. The Chinkou Span line of Ichimoku indicator is crossed the historical price to above indicating the breakout to be continuing in the near future. If the price breaks support level at 637 to below so the secondary correction will be started; if the price crosses the support at 555 so the primary weekly bearish reversal may be started in the secondary ranging way; if the price breaks 649 resistance level on weekly close bar so the strong bullish breakout may be continuing. Trading Summary : watch the price to be crossed with the levels for possible buy or sell trades on the lower timeframes for example.