Gold Daily Plan | Nov 3, 2026 XAUUSD Long Gold vs US Dollar

Gold Daily Plan | Nov 3, 2026

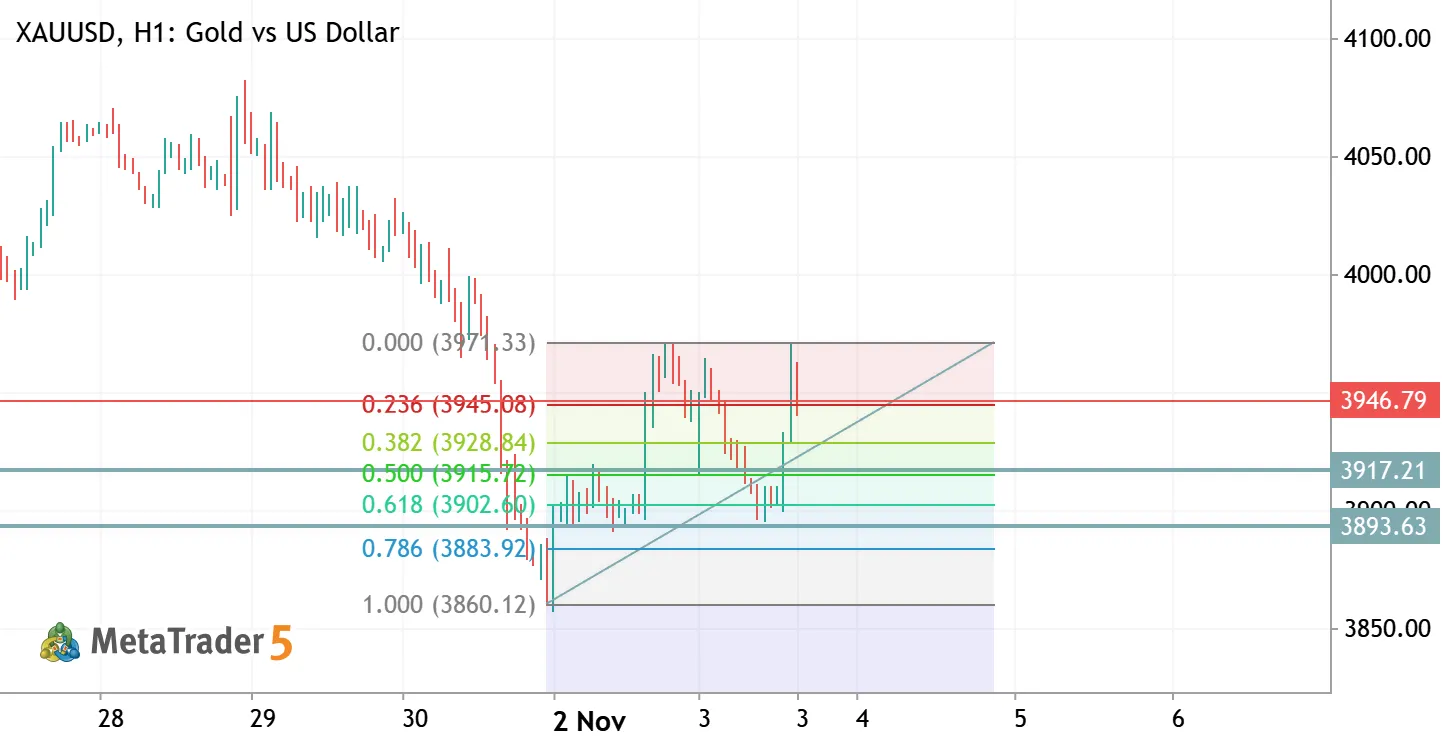
Higher low on the trendline, buy the dip at 3930 **Recap:** Yesterday's sell at 3915 was stopped out ❌. Instead of breaking down, the bear flag broke higher and gold rallied to 3971. Lesson taken: after a one-year low, short covering can be violent. **H1 view:** Since the 3859 low, gold is building a **higher low** (3895) on a **rising trendline**. Today price tested 3971 again and got rejected, forming a double top at the range high. So for now gold is trading inside a **3895–3971 range** with a bullish tilt. Fibonacci of the bounce (3859.82 → 3971.49): - 0.236 → 3945.14 - 0.382 → 3928.83 - 0.500 → 3915.66 - 0.618 → 3902.48 **Plan:** I'm not chasing price at 3947. I'm waiting for a pullback to the **0.382 (3929)**, where the rising trendline passes, and I'll look for a quick long with M5

does EURUSD is preparing to extend correction back to 1.1600 or above EURUSD Euro vs US Dollar

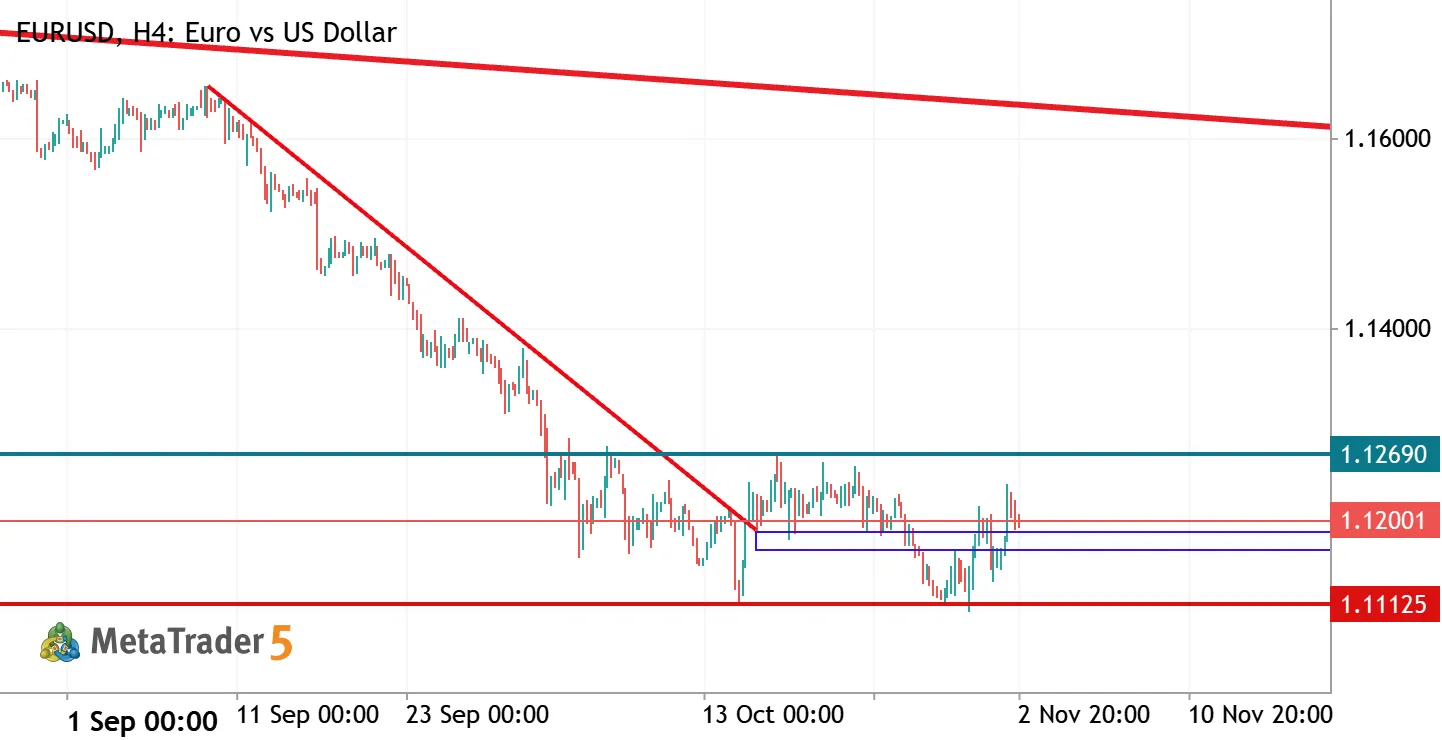
does EURUSD is preparing to extend correction back to 1.1600 or above

EUR has passed about 35 days in steep downtrend from 9th of September to 14th of October. thereafter, the price showed us some supportive signs above 1.1112 the level which support the price to break the steep trendline furthermore, the price refused to trade below this level declaring that the sellers are distributing their profits and the market is moving in sideway between 1.1112 and 1.1269 I setup my chart on basis of 1-2-3 trend change pattern which will be confirmed with close above 1.1270 and s/l at 1.1188 in case of failure of the price to we shall resume selling below 1.1112 with s/l at 1.1170
Gold Daily Plan | Nov 2, 2026 XAUUSD Gold vs US Dollar

Gold Daily Plan | Nov 2, 2026

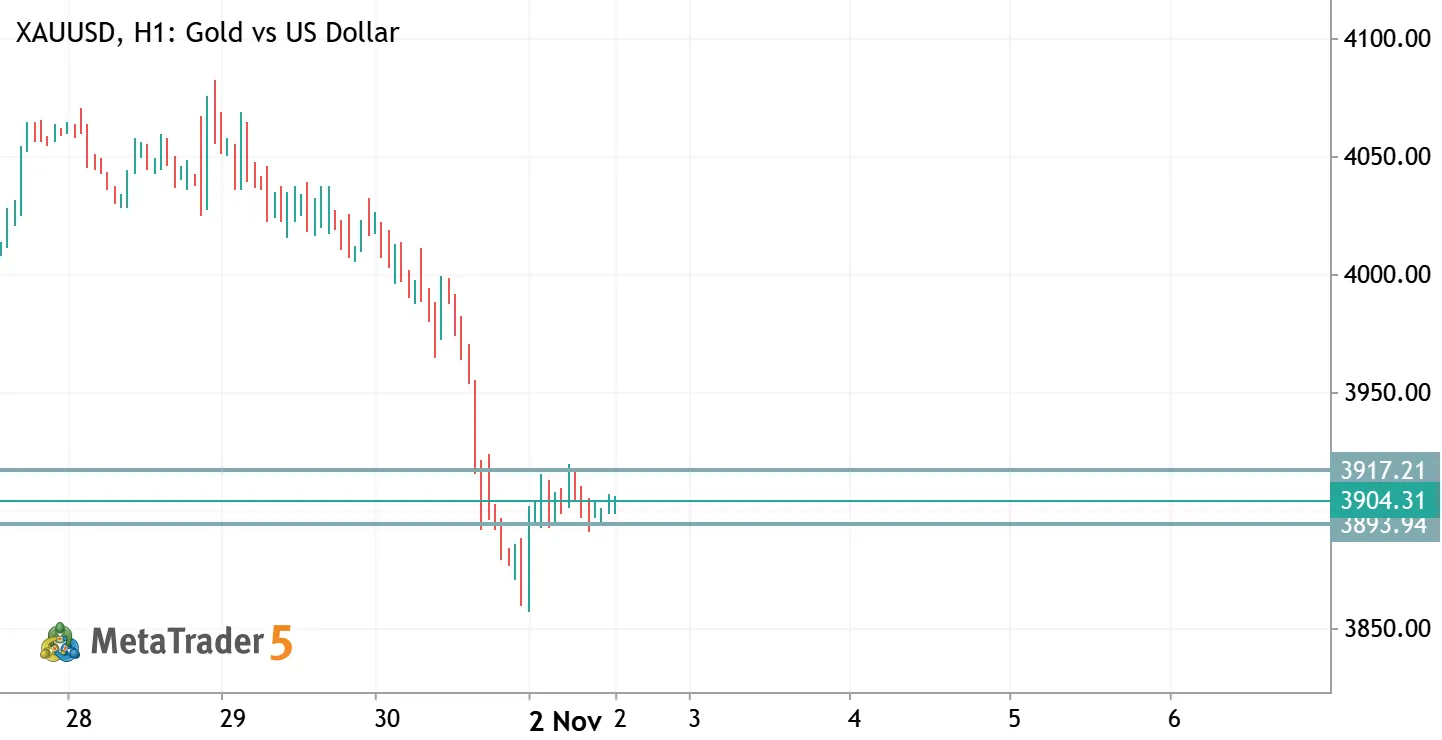
Bear flag under 3917 after one-year low **H1 view:** Gold collapsed from above 4060 and printed a low near **3857**, the lowest level in about a year. Since then, price has been moving sideways in a tight box between **3894 and 3917**. After a drop this strong, a pause like this usually works as a **bear flag**, a consolidation before the next leg down. **Key levels:** - Resistance: 3917 (top of the box), then 3935 - Support: 3894 (bottom of the box), then 3870 and 3857 (low) - Bearish target if 3857 breaks: 3800 **Fundamentals:** - The Fed held rates on Oct 28, but two members voted for a hike. - US Q3 GDP came in at 3.4%, and PCE inflation rose to 3.6%. That supports a December hike and higher yields, which pressures gold. - On the other side, central bank buying and record ETF inflows
Bitcoin (BTCUSD) – H1 Technical Analysis BTCUSD Bitcoin vs US Dollar

Bitcoin (BTCUSD) – H1 Technical Analysis

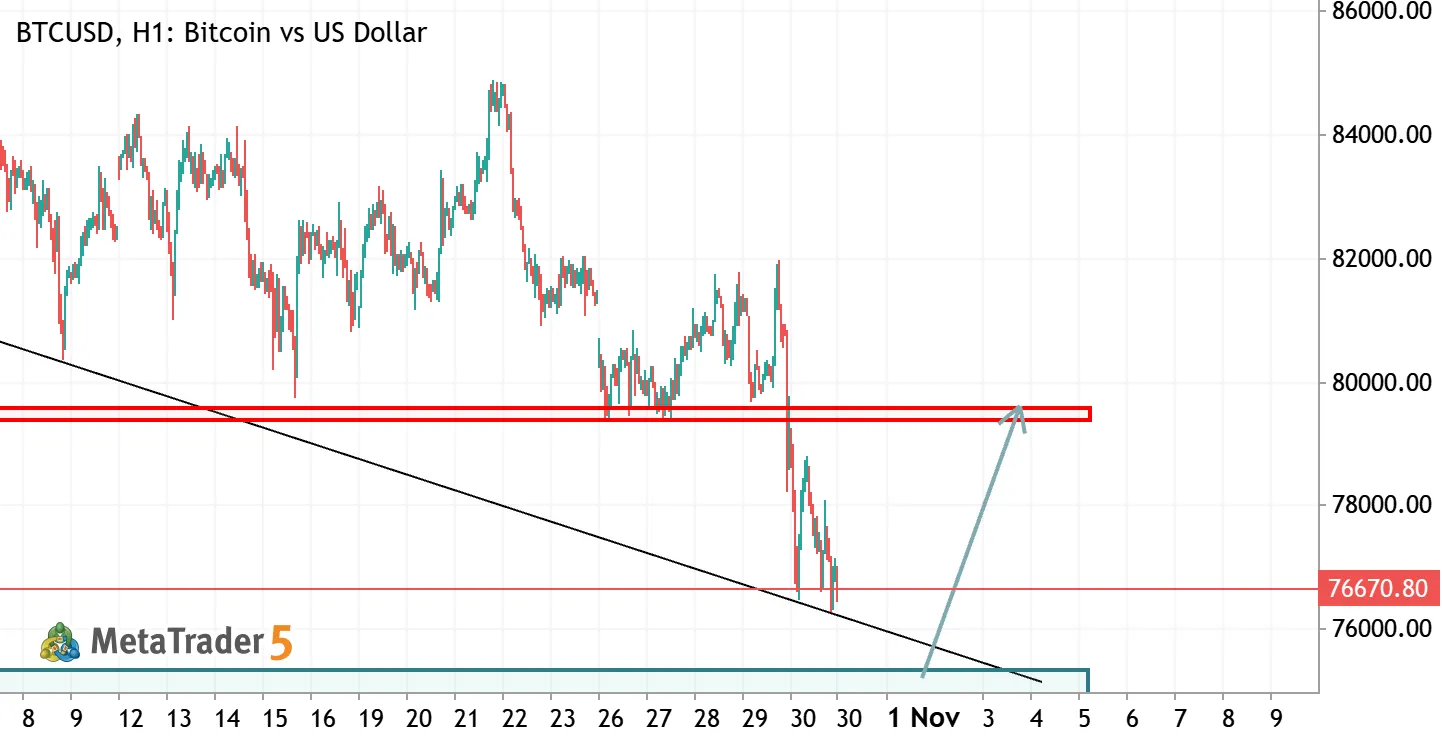
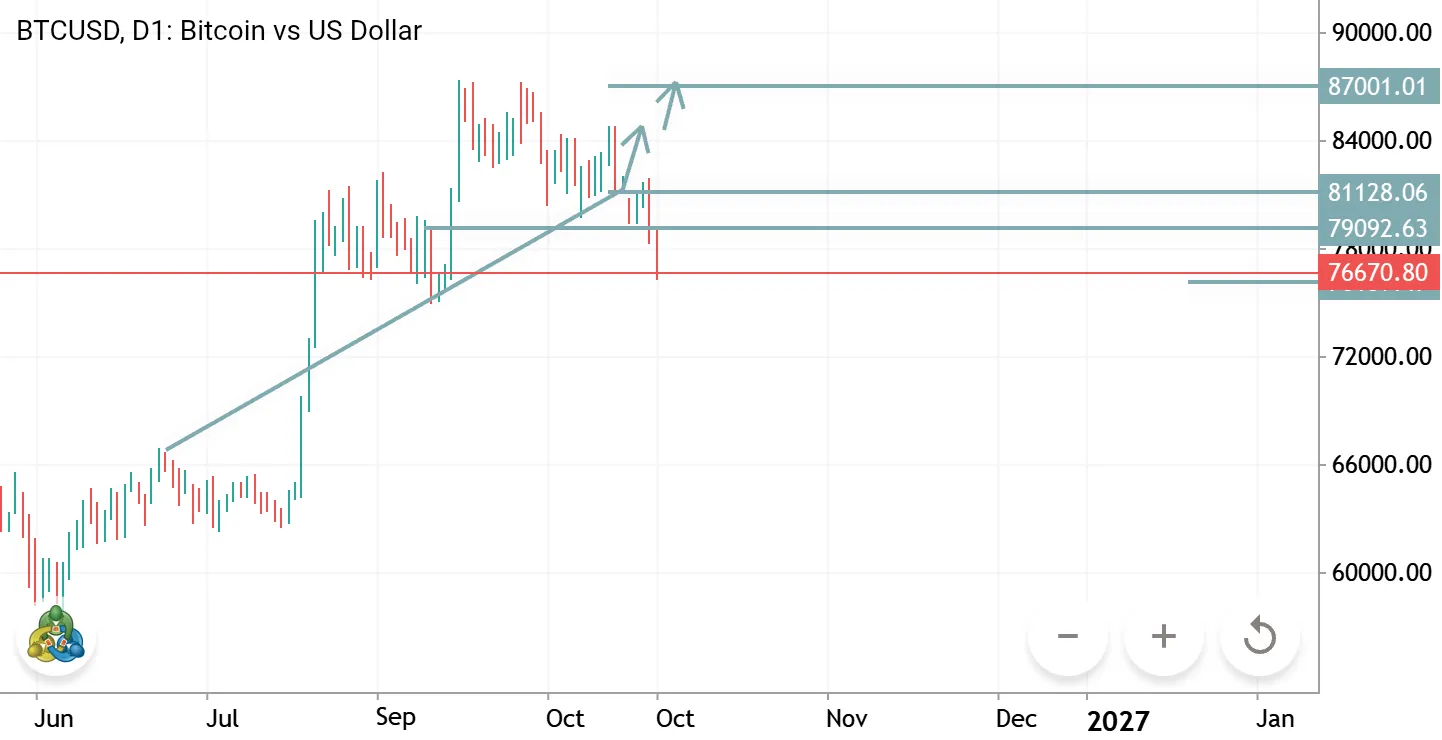
Bitcoin is currently facing strong bearish pressure after breaking down from the 80,000 resistance area. Key Support Zone: 74,900 – 75,400 Price is approaching an important support area, which also aligns with the descending trendline. Potential Bullish Scenario: If buyers step in and price shows a clear bullish reaction from this support zone, we could see a recovery towards: Upside Target:79,500 – 79,800 Alternative Scenario: A confirmed breakdown below the support zone could open the door for further downside. My Outlook: I'm watching the 75,000 area closely for a potential bounce. A bullish confirmation is needed before considering a long position. Patience and confirmation are key. #Bitcoin #BTCUSD #CryptoAnalysis #TechnicalAnalysis #BitcoinTrading
Gold (XAUUSD) – H1 Technical Analysis XAUUSD Gold vs US Dollar

Gold (XAUUSD) – H1 Technical Analysis

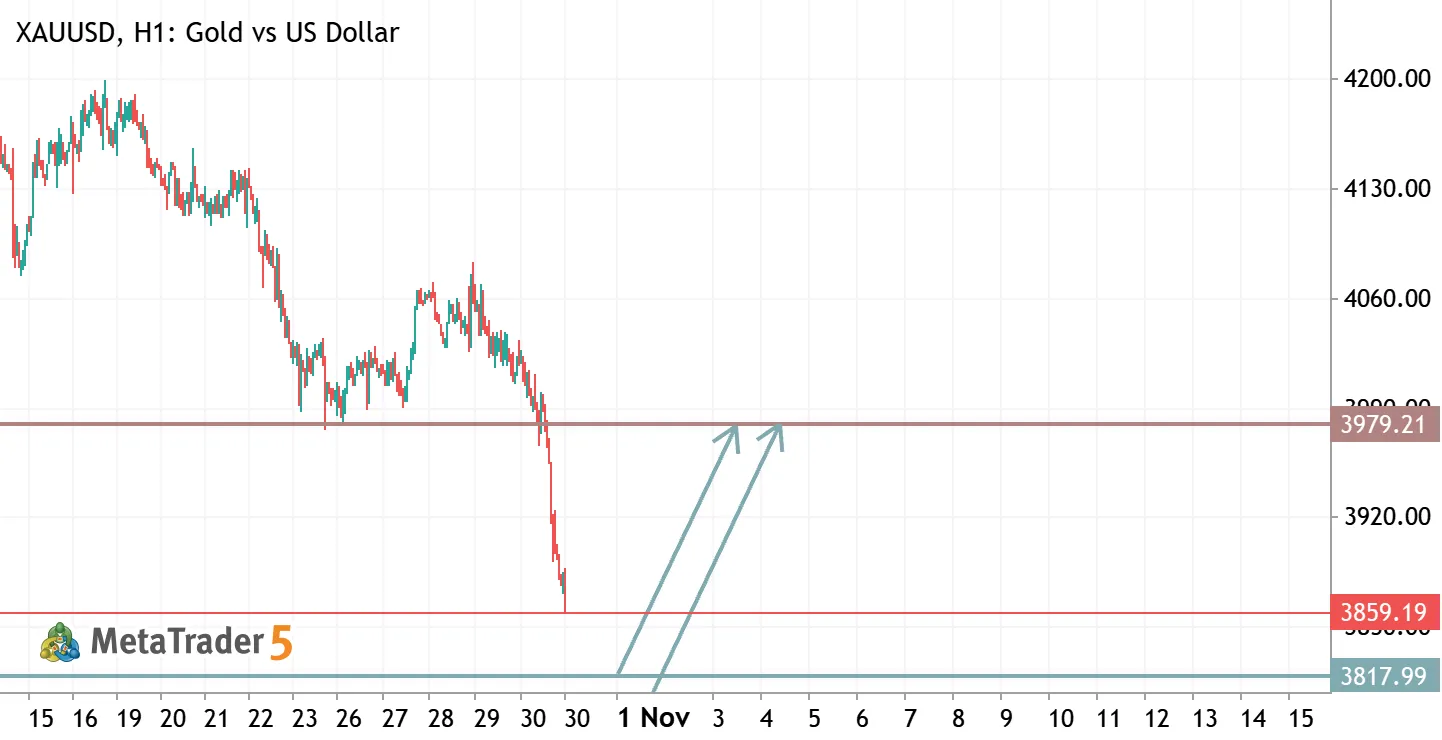
Gold remains under bearish pressure, continuing to form lower highs and lower lows. Key Support Zone: 3791 – 3818 I’m watching this area closely for a potential bullish reaction and a possible short-term recovery. Potential Upside Targets: -First target: 3859 -Second target: 3979 Alternative Scenario: A confirmed break below the 3791–3818 support zone could lead to further downside. My Outlook: I’m waiting for price confirmation and bullish signals around the support zone before considering any long positions. #Gold #XAUUSD #TechnicalAnalysis #ForexTrading #GoldTrading
XAUUSD (Gold) – 3950 Demand Zone XAUUSD Long Gold vs US Dollar

XAUUSD (Gold) – 3950 Demand Zone

XAU/USD Buy Signal Buy Zone: 3955 – 3945 Stop Loss: 3930 Take Profit 1: 3965 Take Profit 2: 3990 Take Profit 3: 4020 Open Target: Open 📚 Educational Market Idea: Gold may revisit the 3955–3945 zone, where buyers could step in and attempt to initiate a bullish recovery. If this area holds as support and bullish price action confirms buying pressure, Gold could move toward 3965, followed by 3990 and 4020. Watch for bullish confirmation, such as a strong bullish candle, a bullish engulfing pattern, or a recovery above nearby resistance before entering. If price breaks below the buy zone with strong bearish momentum, reassess the setup. 📌 Trade Management: Consider securing partial profits at TP1 and TP2 while protecting your position as price moves in your favor. If bullish momentum