BTCUSD H4 – Bullish Structure with Key Resistance & Support Zones BTCUSD Bitcoin vs US Dollar

BTCUSD H4 – Bullish Structure with Key Resistance & Support Zones

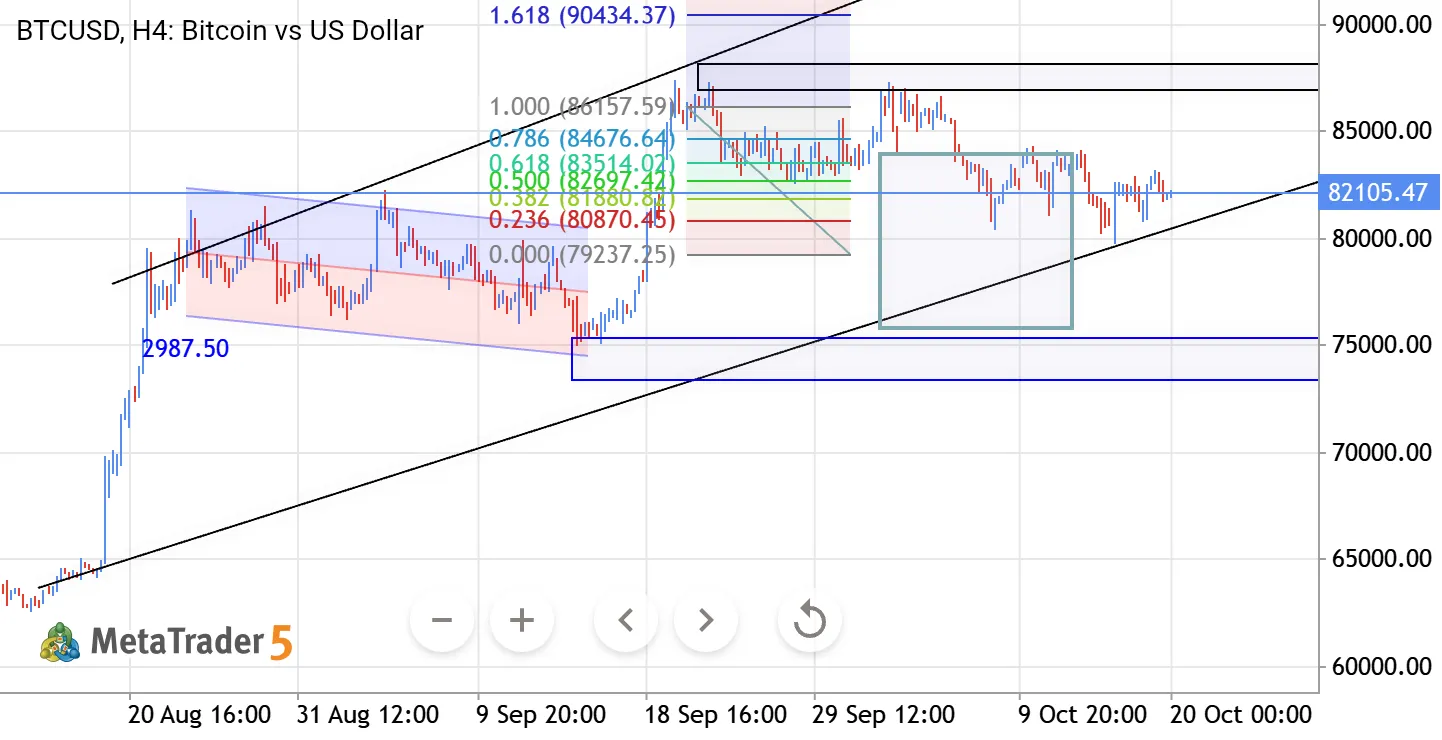
Bitcoin is currently holding above the major 75,000–76,000 support area while maintaining a broader bullish structure. Price is consolidating around 82,000, with the 86,000–87,000 zone acting as major resistance Reason: The ascending trendline continues to provide structural support, while the Fibonacci levels show important reaction areas between 81,900 and 84,600. A confirmed break above 86,100–87,000 could open the way for further upside. On the downside, a break below the rising trendline and 75,000 support would weaken the bullish setup The chart combines price action, trendline structure, support/resistance and Fibonacci levels to identify the key areas for the next move. Wait for confirmation and manage risk properly.
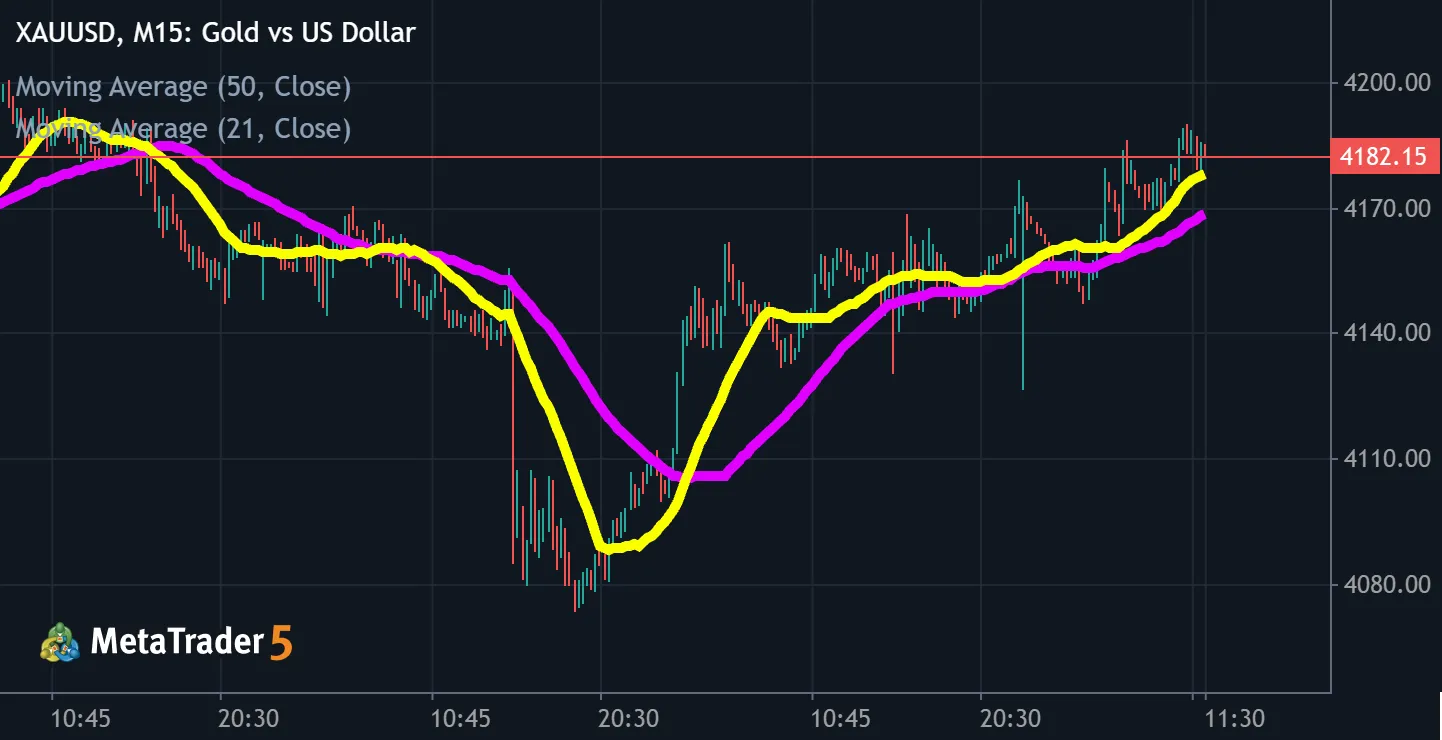
Gold Scalp M5 | Oct 19, 2026 XAUUSD Gold vs US Dollar

Gold Scalp M5 | Oct 19, 2026

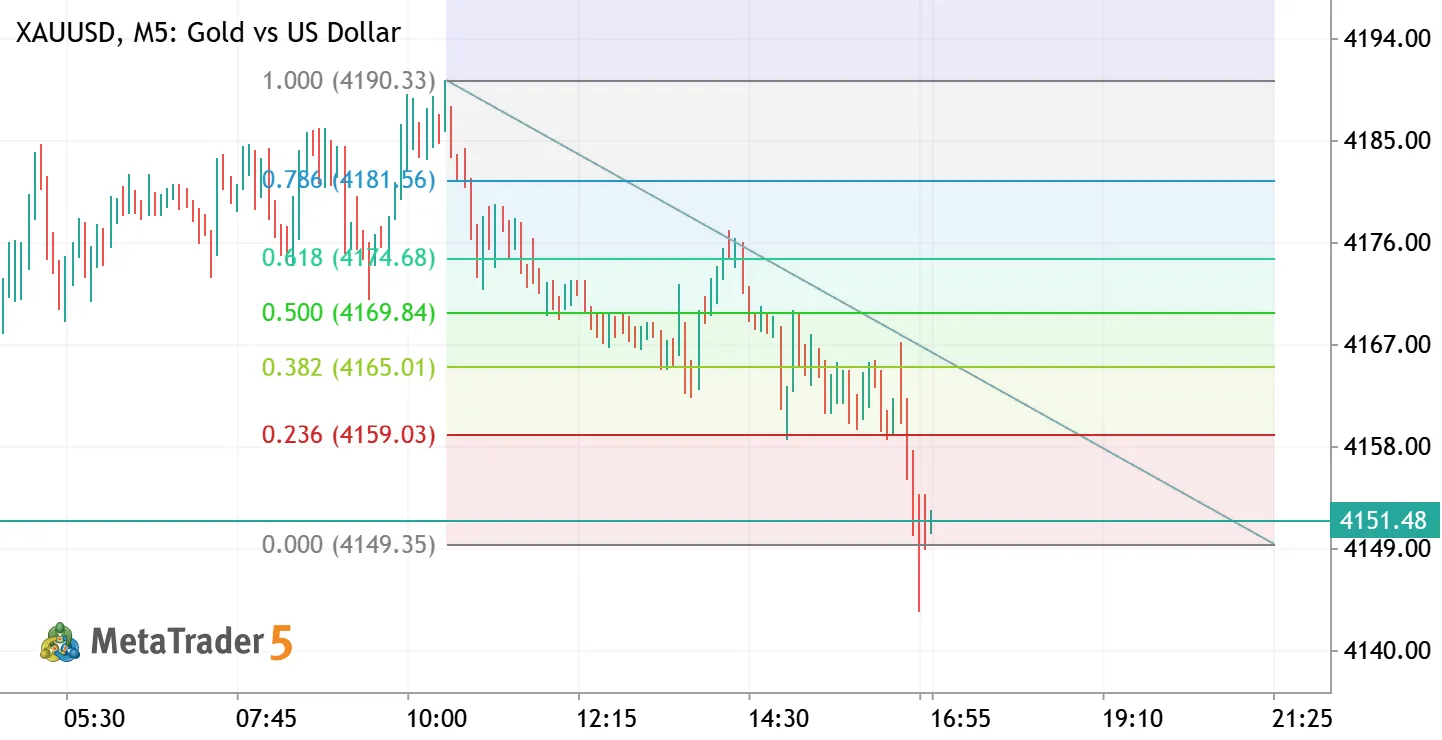
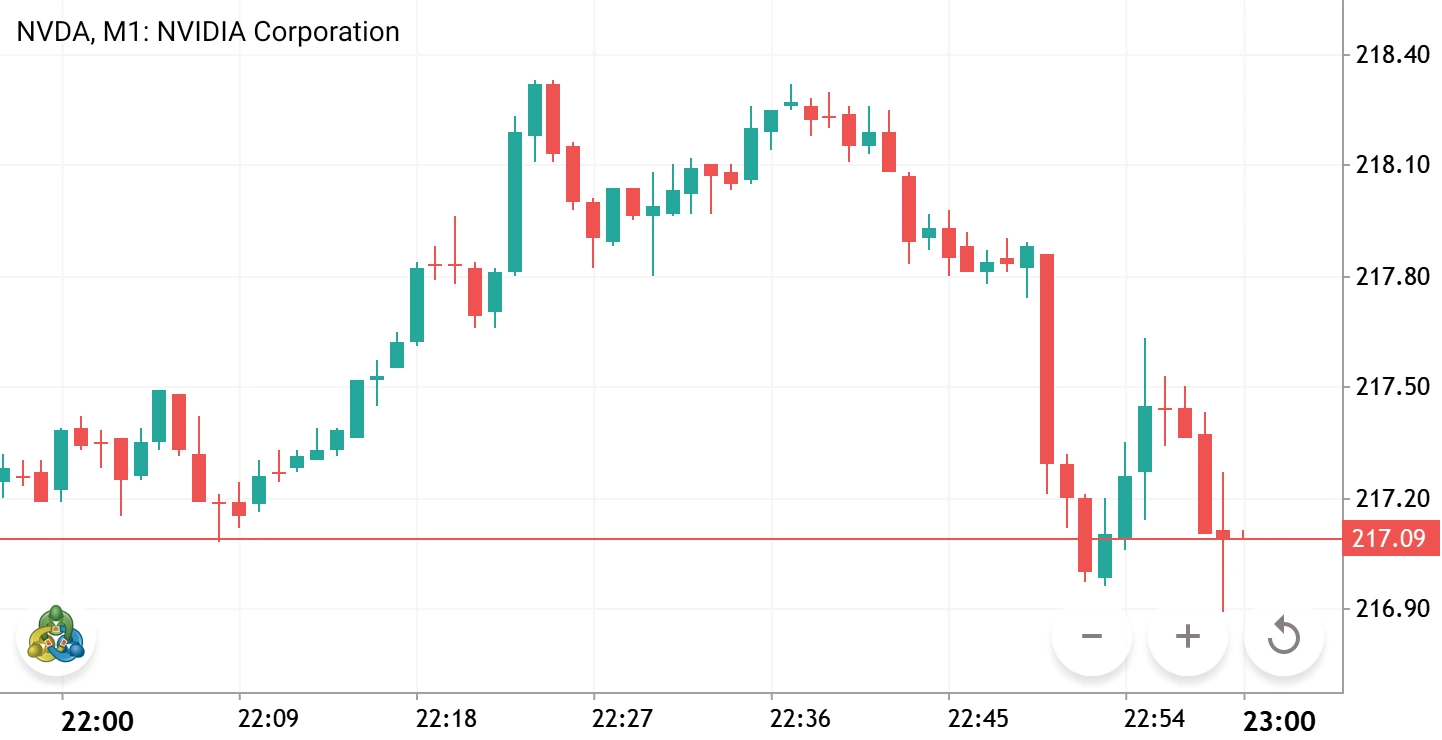
Gold Scalp M5 | Oct 19, 2026 – Sell the pullback into 4159 Gold has been in a clear intraday downtrend since the 4190 high, printing lower highs along a descending trendline. The 4159–4160 support finally broke, and price dropped to 4150 with a spike down to ~4143. Fibonacci of the drop (4190.33 → 4149.42): - 0.236 → 4159.07 - 0.382 → 4165.05 - 0.500 → 4169.87 - 0.618 → 4174.70 Selling right at the lows is risky after that long rejection wick. I prefer to wait for a pullback into **4159**, where three things line up: the 0.236 Fibonacci, the broken support (now resistance) and the descending trendline. Trade: SELL LIMIT XAUUSD (M5 scalp) - Entry: 4159 - SL: 4166 - TP1: 4150 - TP2: 4144 Invalidation: an M5 close above 4166 (0.382 + trendline) breaks the bearish structure, so the idea is
BTCUSD H4ANALYSIS BTCUSD Bitcoin vs US Dollar

BTCUSD H4ANALYSIS

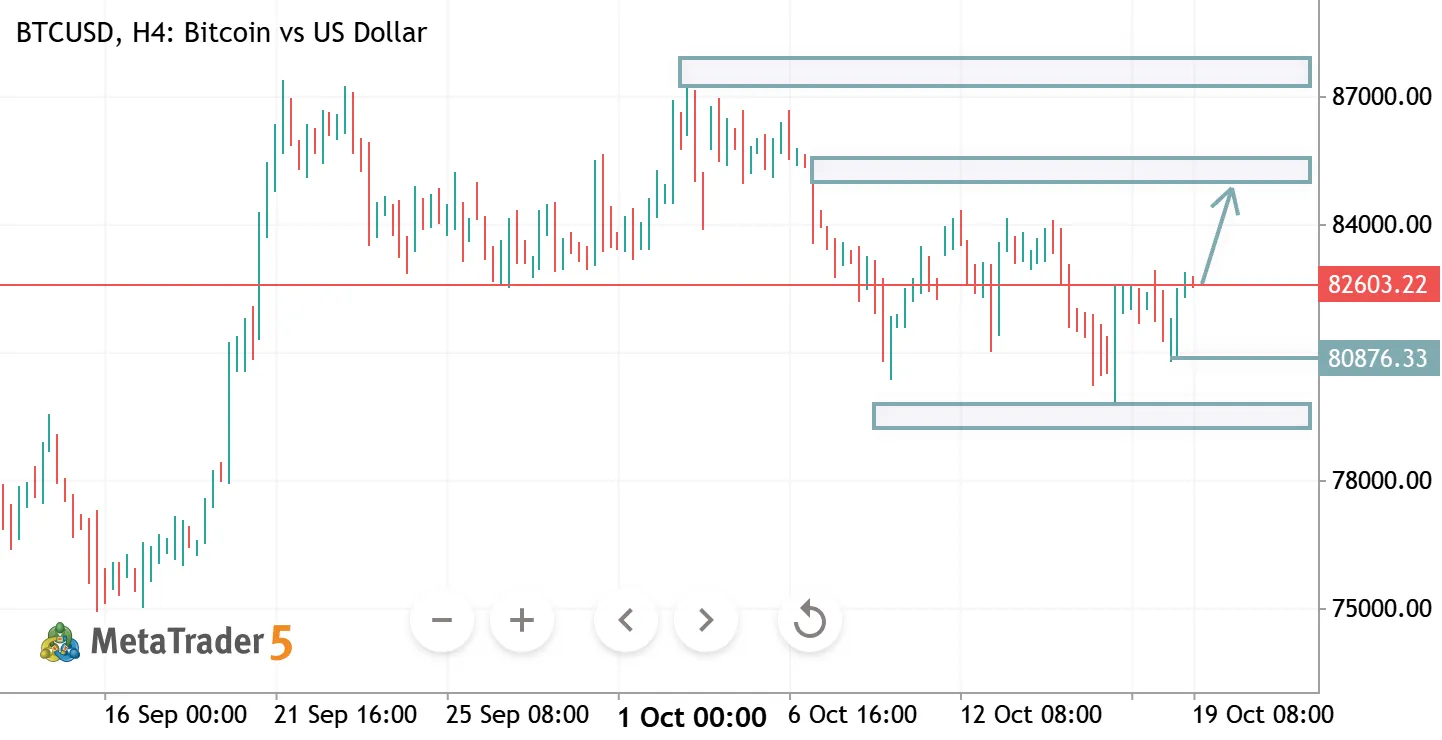
**📊 BTCUSD – Technical Analysis** 🔹 **Market Bias:** Bullish recovery 🔹 **Support Zone:** 80,000–80,800 🔹 **Resistance Zone:** 85,000–85,500 🔹 **Next Target:** 85,000+ if bullish momentum continues. **Trading Outlook:** Price is showing a recovery from the support zone. A sustained move above 83,000–83,500 could strengthen the bullish scenario toward resistance. A break below support may invalidate this outlook and trigger further downside. ⚠️ Wait for confirmation and manage risk carefully. This analysis is for educational purposes only, not financial advice.
XAUUSD H4 ANALYSIS XAUUSD Gold vs US Dollar

XAUUSD H4 ANALYSIS

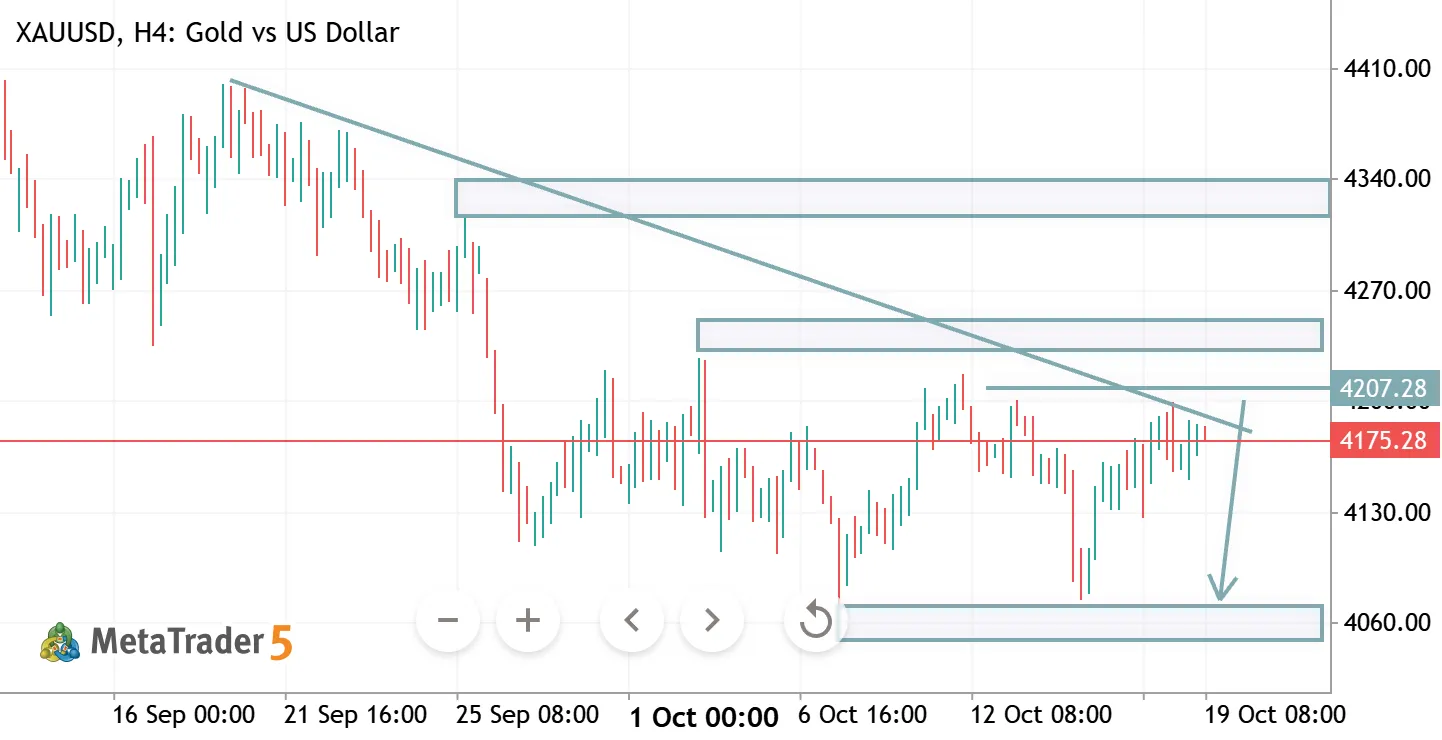
📊 XAUUSD H4 Analysis – Gold Gold is trading near 4178 and facing resistance around the descending trendline. The current structure suggests a possible bearish move if sellers maintain control. 🔴 Bearish Scenario: Rejection near 4200–4210 could push price toward 4140 and then the 4080 support zone. 🟢 Bullish Scenario: A confirmed breakout above 4210 may open the way toward 4250–4260. 🎯 Key Levels * Resistance: 4200–4210 * Major Resistance: 4250–4260 * Support: 4140 * Major Support: 4070–4080 📌 Market Outlook: Watch for a clear rejection or breakout before entering a trade. ⚠️ Educational analysis only. Trade with proper risk management.
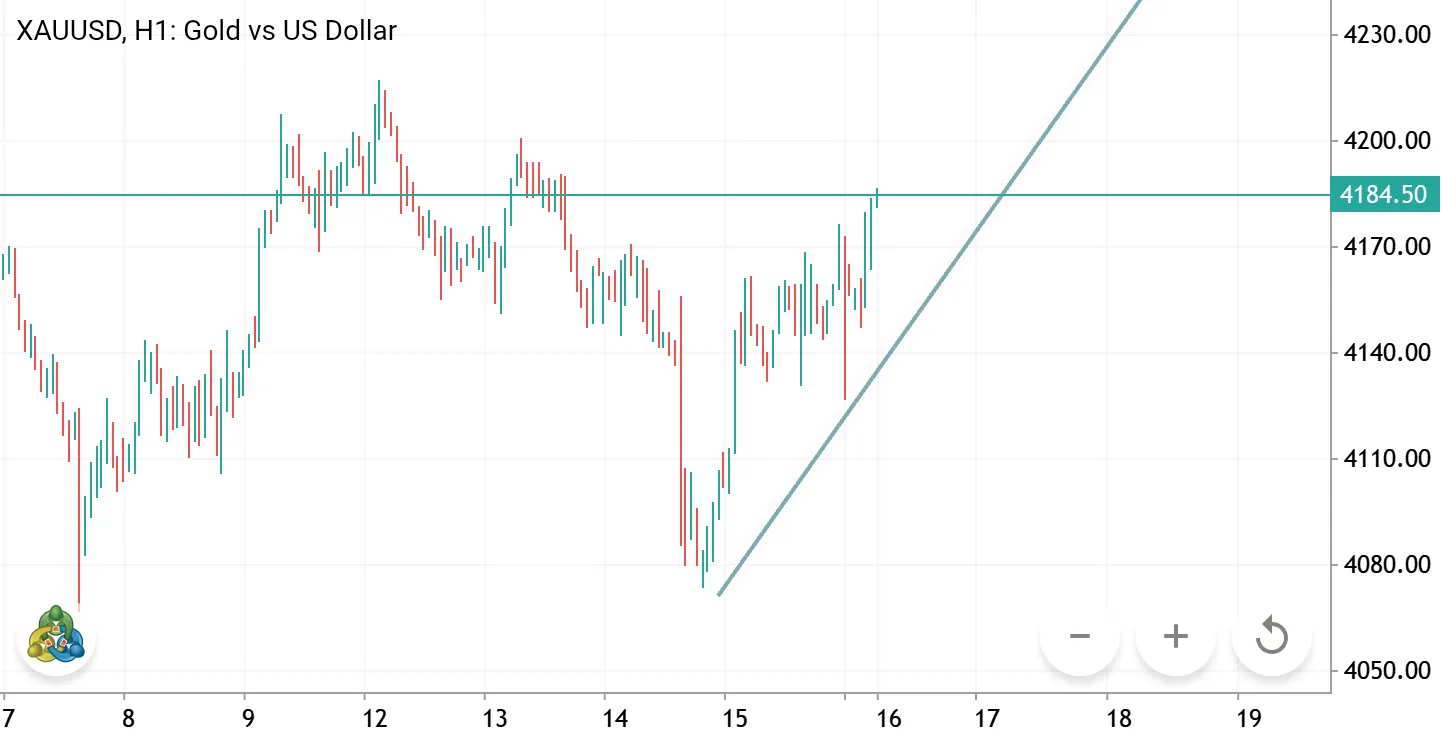
Gold Bullish Rebound – Targeting 4230 XAUUSD Long Gold vs US Dollar

Gold Bullish Rebound – Targeting 4230

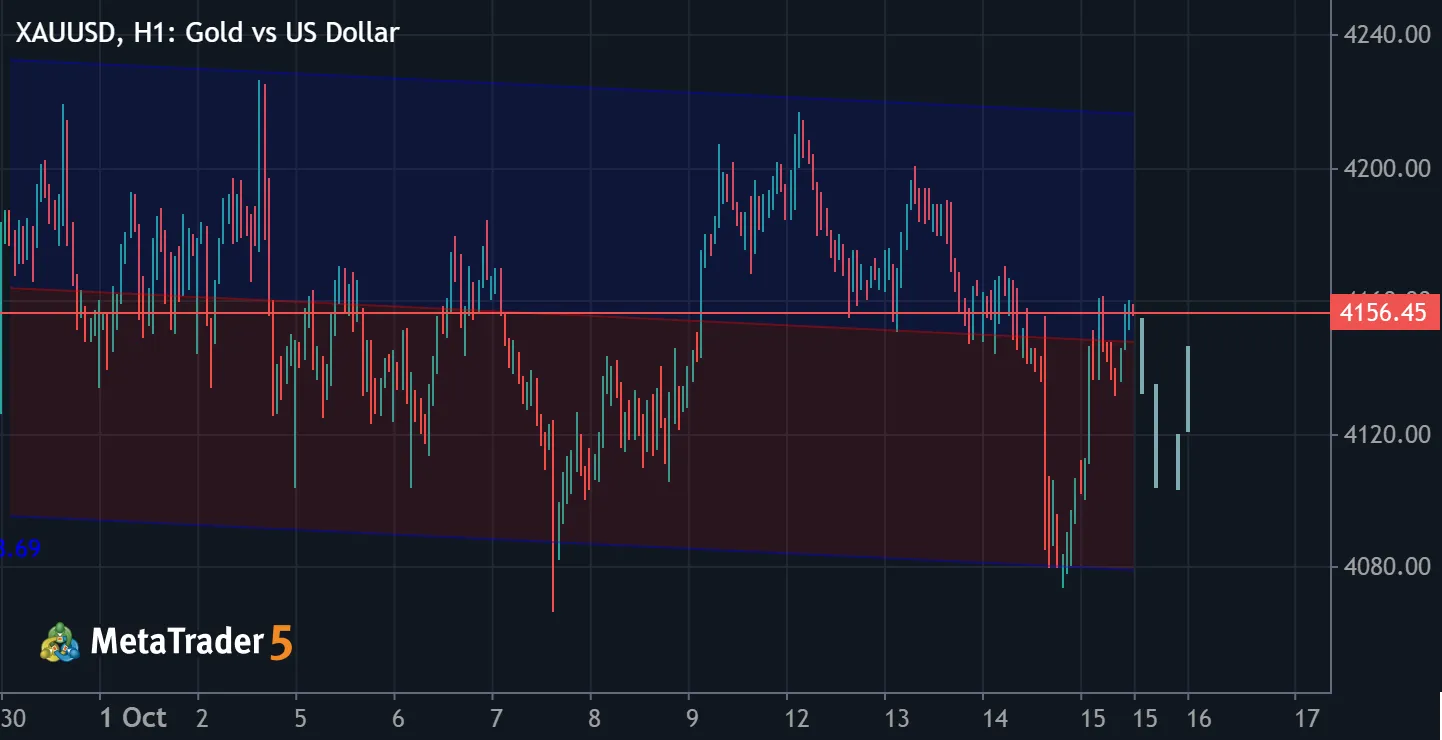
XAUUSD H1 Analysis – Bullish Recovery Gold has shown a strong rebound from the 4080 support zone and is now pushing toward the 4185 resistance area. The chart suggests short-term bullish momentum, with price forming a recovery along the rising trendline. A confirmed breakout above 4185–4200 could open the way toward 4230, while rejection may lead to a pullback toward 4160–4140 support. Key levels: Resistance: 4185–4200 | Target: 4230 | Support: 4160–4140. Trading bias: Bullish above the rising trendline, but wait for a confirmed breakout before considering a long entry. A break below trendline support could weaken the recovery. This is a technical reading of your screenshot, not a live-price confirmation. Current market conditions can differ from the chart shown.
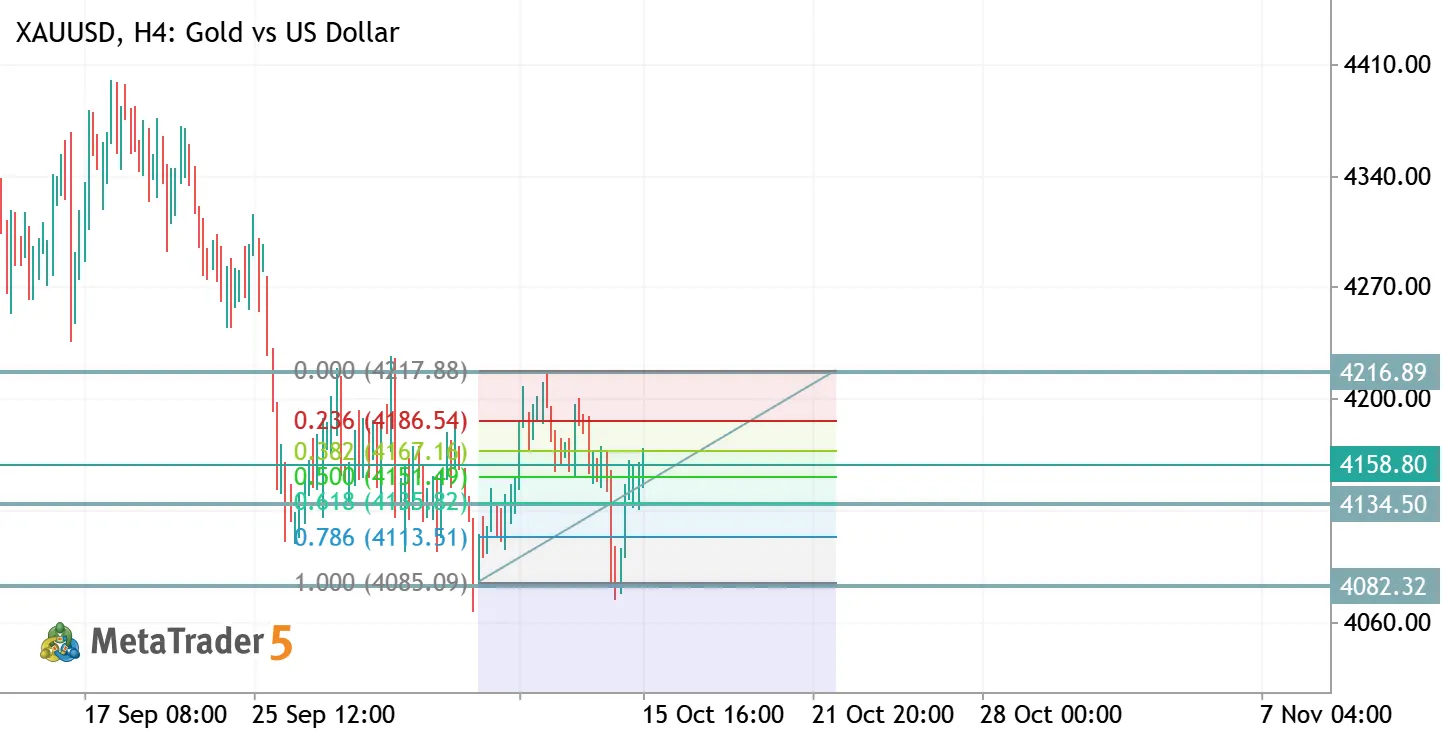
Gold Daily Plan | Oct 15, 2026 XAUUSD Gold vs US Dollar

Gold Daily Plan | Oct 15, 2026

Gold Daily Plan | Oct 15, 2026 – Double bottom at 4082, long from 4134.5 H4 view: Yesterday's sell-off took gold back down to 4078–4082, the same area as the Oct 7 low (4084). Buyers defended it again and price bounced hard, forming a **double bottom** on H4. Gold is now up 1.4% on the day, trading around 4159. Fibonacci of the swing (4217.49 → 4084.36): - 0.236 → 4186 - 0.382 → 4166 - 0.500 → 4151 - 0.618 → 4135 - 0.786 → 4113 Trade: BUY XAUUSD (active) I bought at 4134.5, the 0.618 level, as the bounce from the double bottom confirmed. - Entry: 4134.5 - SL: 4110 (below the 0.786) - TP1: 4186 (0.236) - TP2: 4217 (swing high) Next resistance: 4166 (0.382). An H4 close above it opens the way to TP1. Invalidation: an H4 close below 4113 cancels the double bottom and puts 4082 back in play
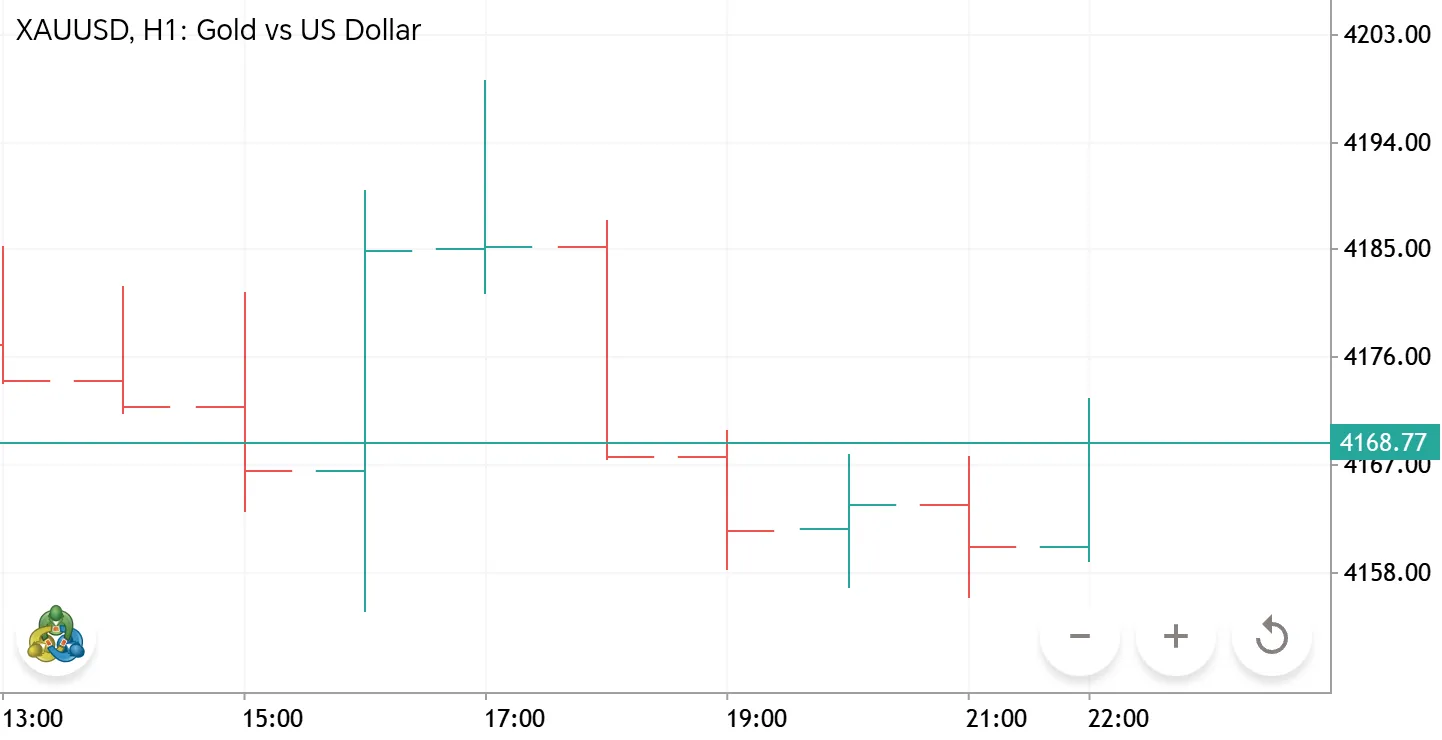
XAUUSD H1 – Bearish Continuation Toward 4050 XAUUSD Short Gold vs US Dollar

XAUUSD H1 – Bearish Continuation Toward 4050

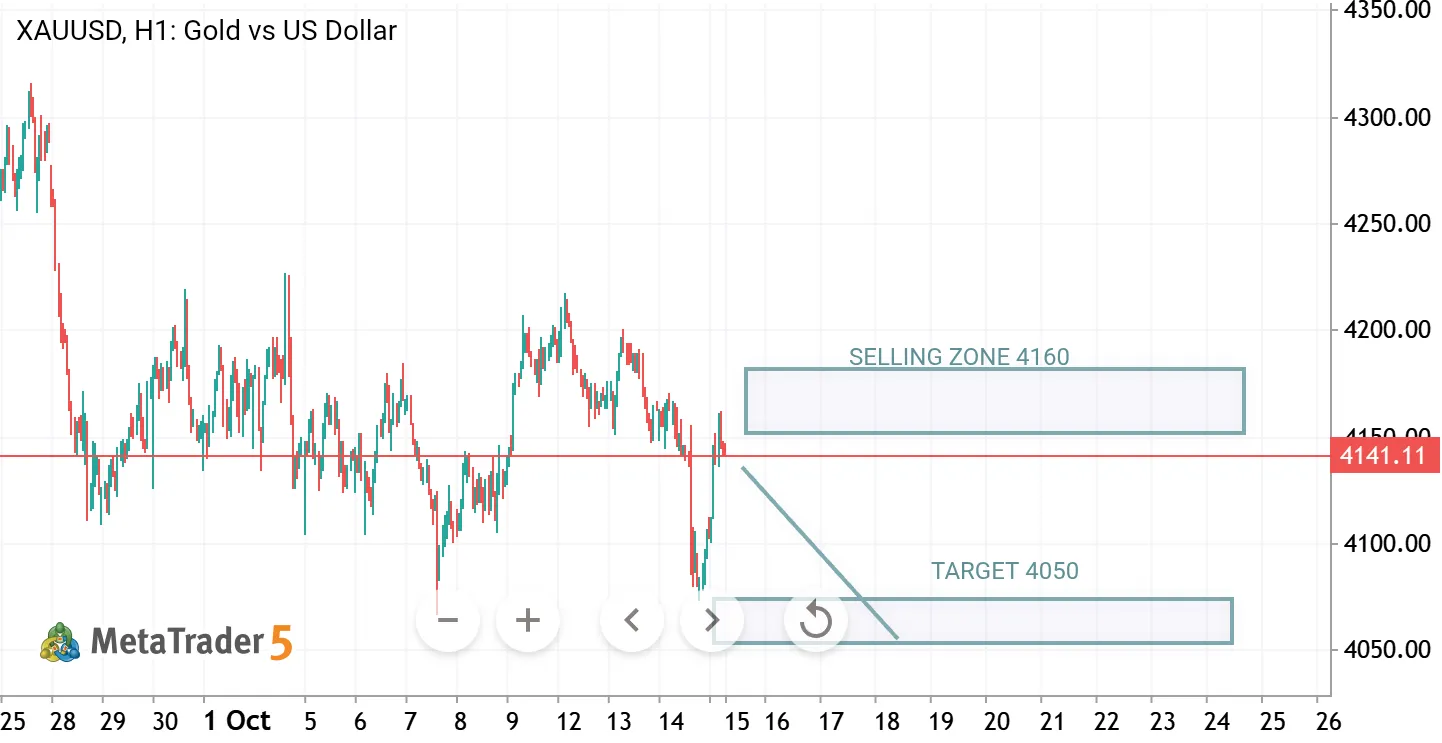
XAUUSD – GOLD SELL SETUP 📉 Selling Zone: 4160–4180 Target (TP): 4050 Key Resistance: 4160–4180 Gold is showing bearish pressure on the H1 chart after rejecting higher levels. If price retests the 4160–4180 resistance zone and shows bearish confirmation, a move toward 4100 and potentially 4050 could follow. Trading Plan: Wait for bearish confirmation before entering a sell. Invalidate the setup if price breaks and holds above the resistance zone. ⚠️ Risk management is essential. This is a technical scenario, not a guaranteed outcome.