usdjpy h4 analysis USDJPY US Dollar vs Yen

usdjpy h4 analysis

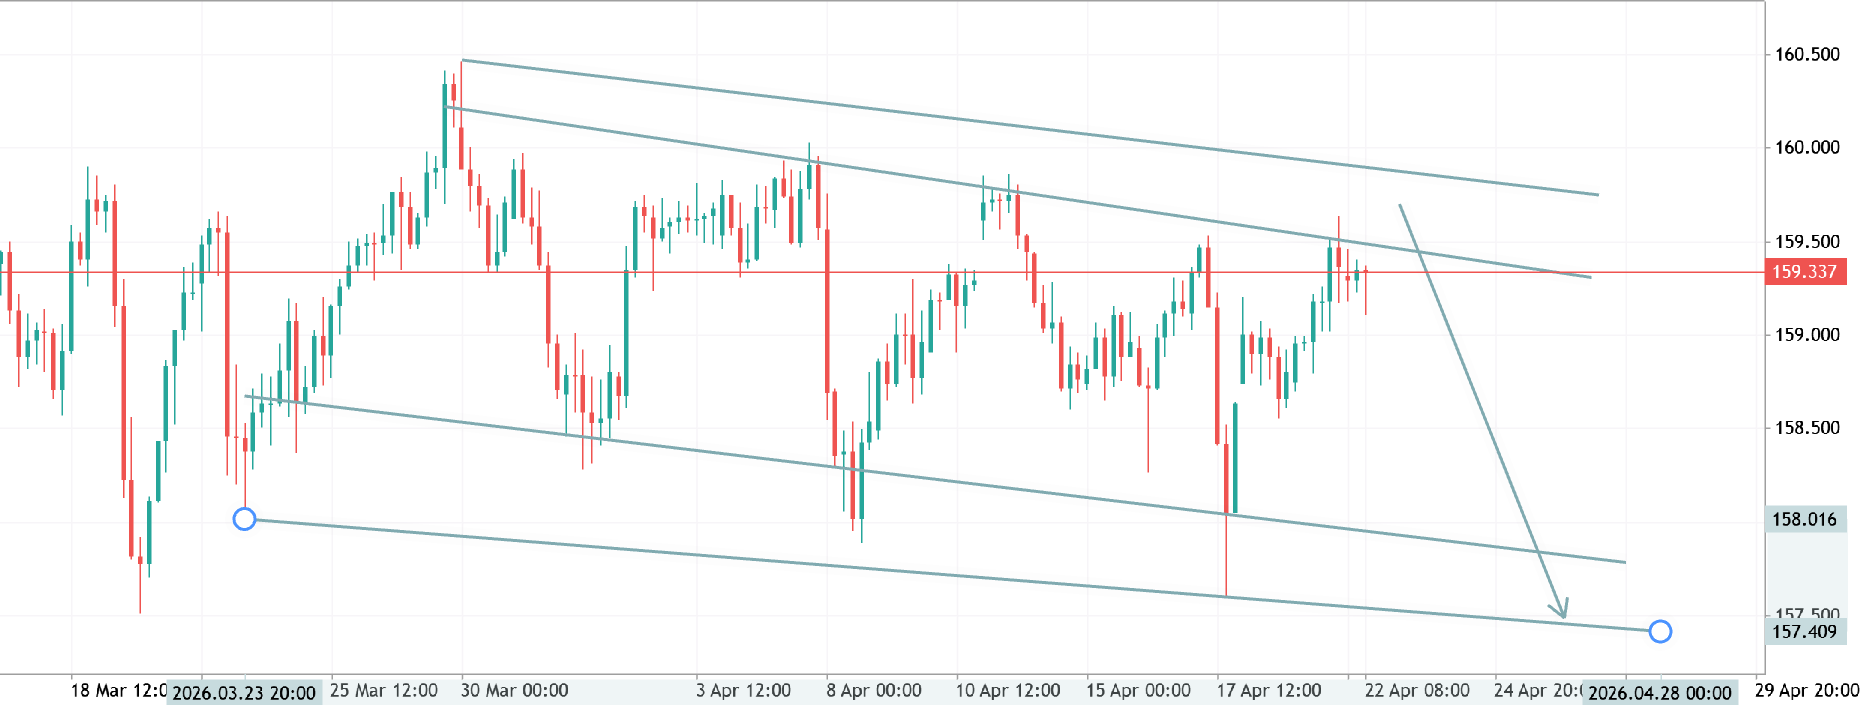
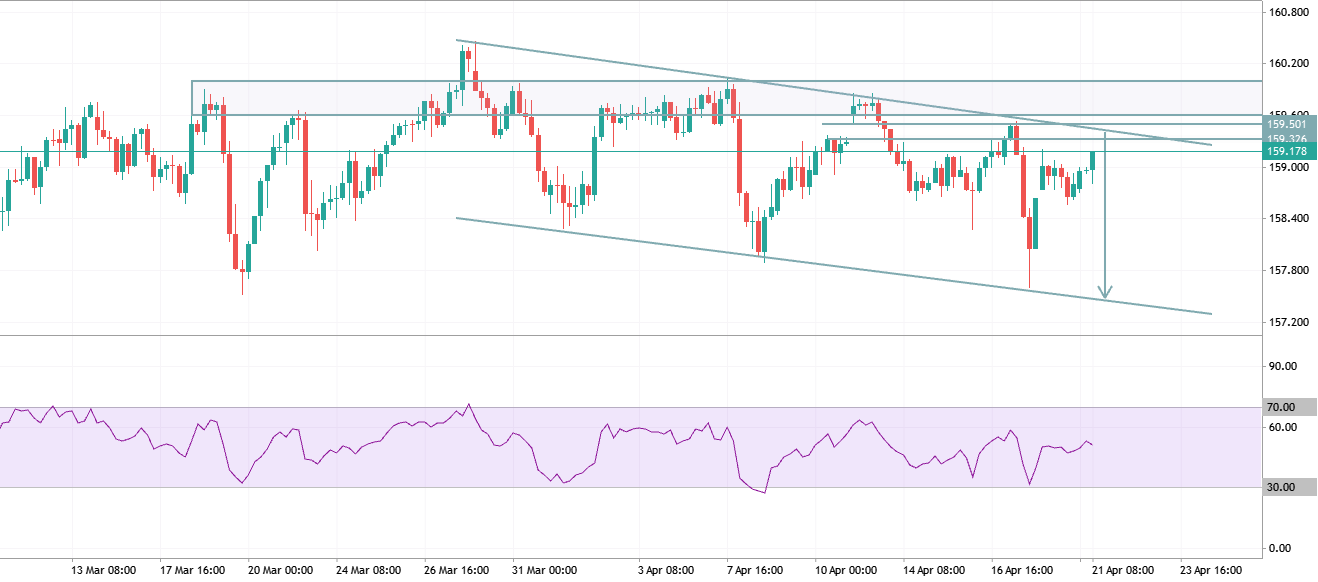
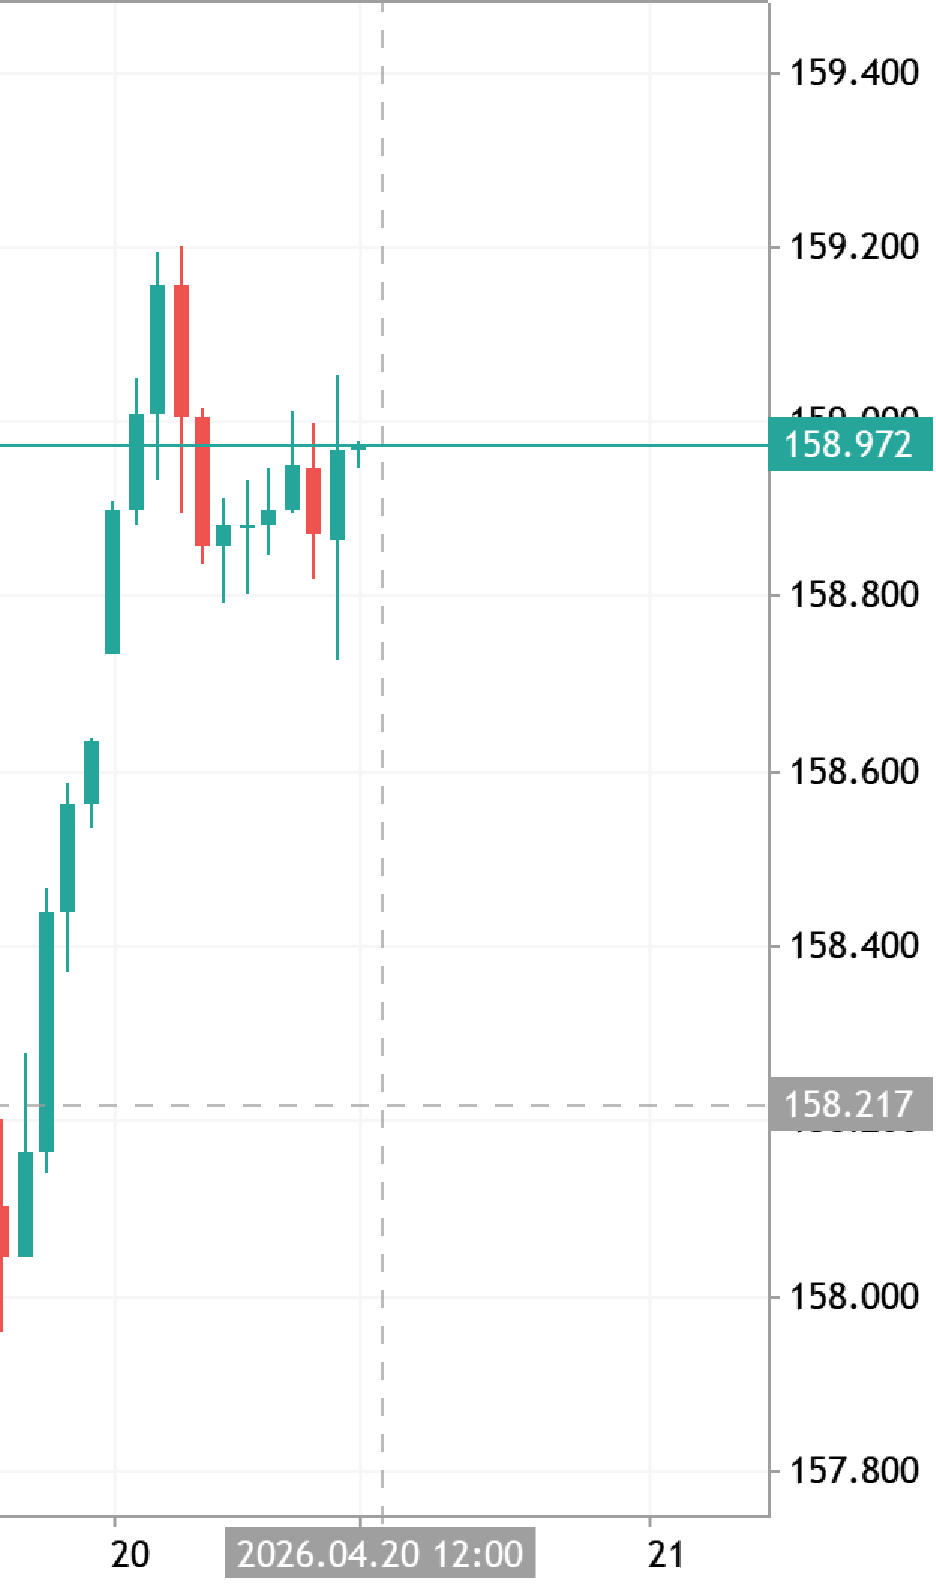
USDJPY H4 Analysis Price is respecting a descending channel and currently testing key resistance around 1593–1595. Rejection from this zone suggests bearish pressure remains intact. As long as price stays below the trendline, expect a downside move toward 1580 and potentially 1570. A clean breakout above 1595 would invalidate the bearish setup and open room for higher levels. Bias: Bearish below resistance Key Levels: 1595 resistance | 1580–1570 support
gbp jpy intraday smart analysis GBPJPY Pound Sterling vs Yen

gbp jpy intraday smart analysis

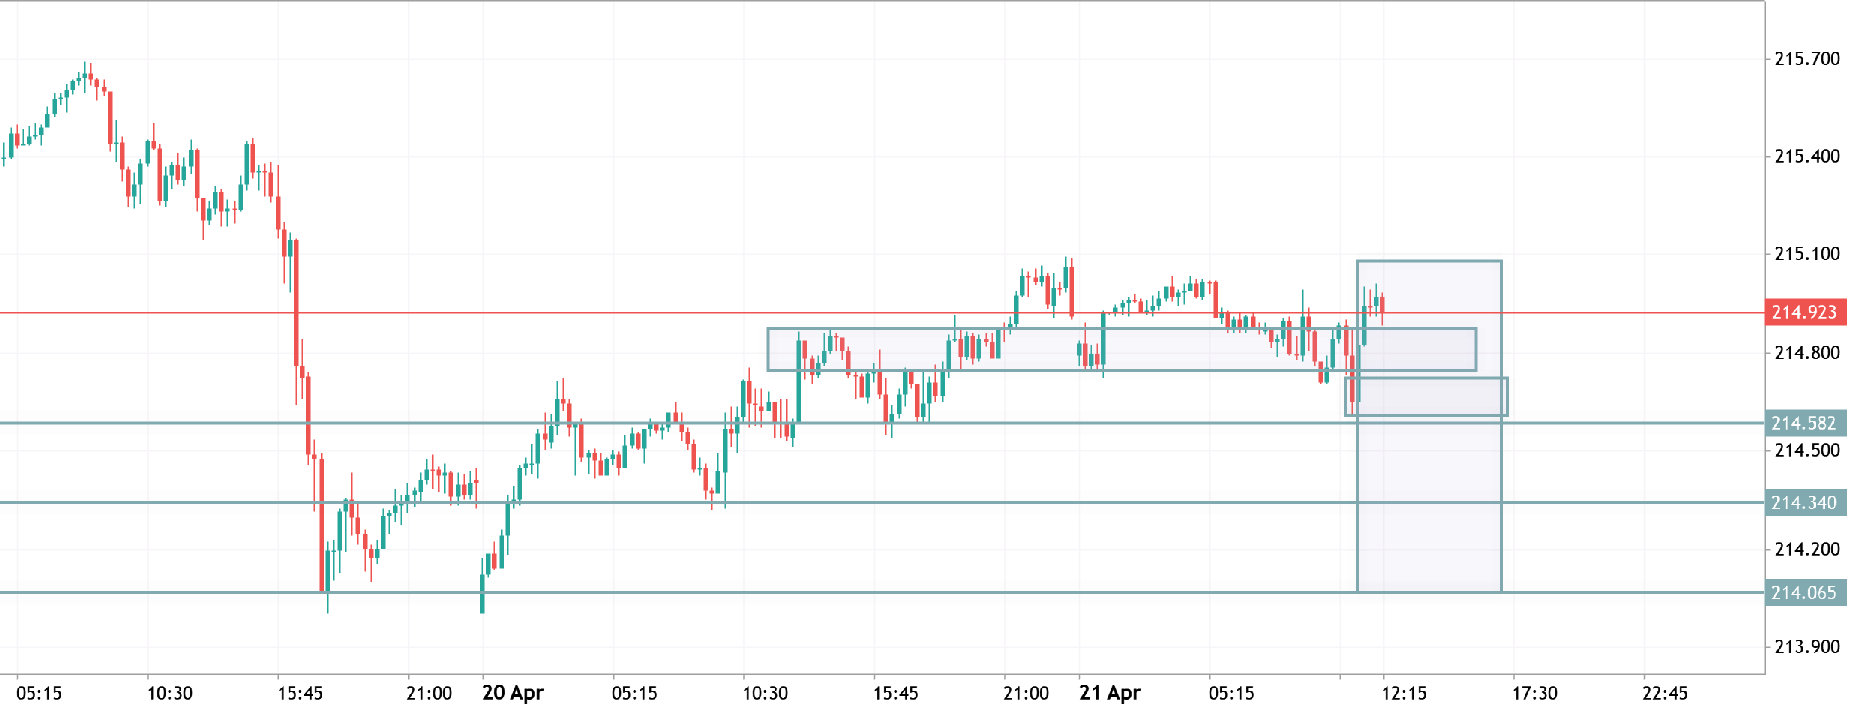
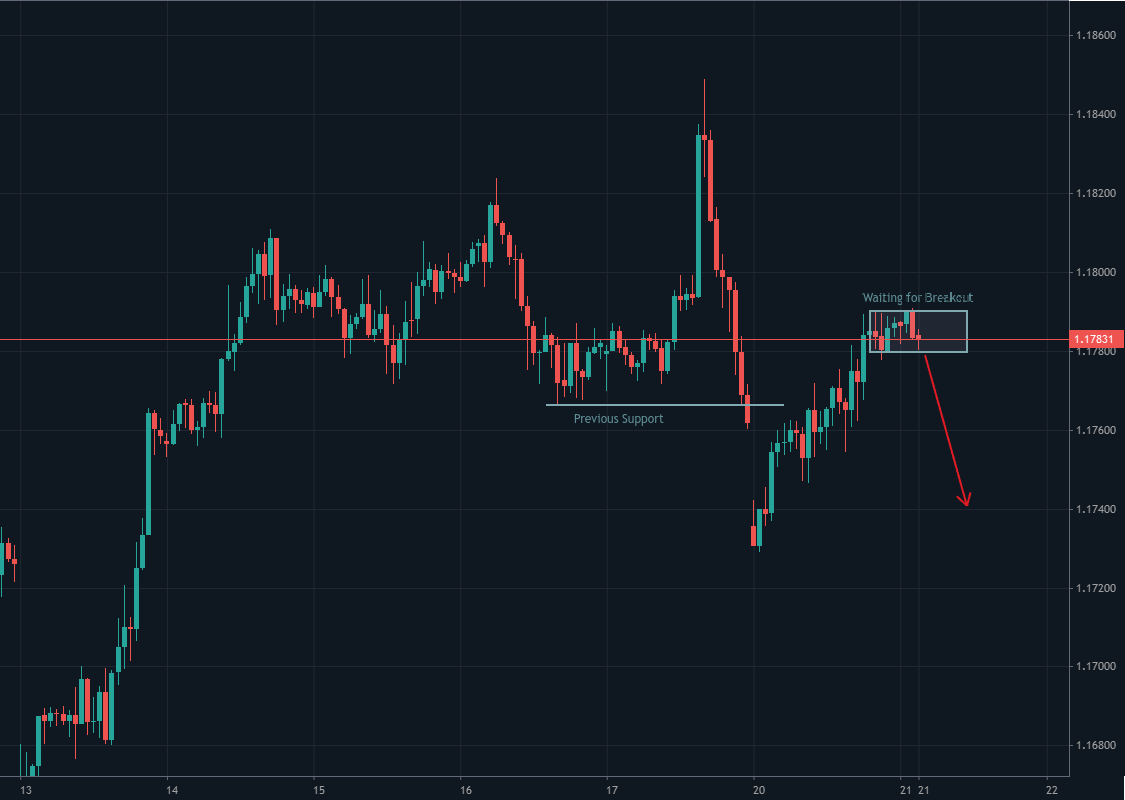
GBP JPY Intraday – Smart Analysis Price is moving inside a clear consolidation range after an impulsive move up. Multiple rejections from resistance show weakening bullish momentum. 🔹 Structure: Range-bound between support & resistance Liquidity building on both sides 🔻 Bearish Scenario: Break below range support → continuation toward lower demand zone Recent fake breakout suggests downside liquidity grab 🔸 Bullish Scenario: Clean breakout + hold above resistance → continuation of uptrend 📌 Conclusion: Currently in accumulation/distribution phase — wait for confirmed breakout. Short bias below support, bullish only on strong breakout and retest
USDJPY H4 ANALYSIS TRDE IDEA USDJPY US Dollar vs Yen

USDJPY H4 ANALYSIS TRDE IDEA

Hello Traders! What are vour thoughts on USDJPY? On the 4-hour chart. USD /JPY is exhibiting a well-defined bearish structure in the medium term. After several failed attempts to break and hold above the 160.000 psychologica resistance level, price action is now signaling a shift toward a bearish momentum. Key Technical Insights: Supply Zone: The red shaded area between 159.500 and 160.200 has proven to be a formidable barrier Multiple rejections in this zone indicate neavy institutional selling pressure Descendina Channel & Confluence: The pair is currentlv trading within a descending channel. Price has recently tapped the upper boundary of this channel, coinciding perfectly with the Fibonacci retracement . This technical confluence strenathens the bearish Given the current structure