#XAUUSD - October 25, 2026 XAUUSD Short Gold vs US Dollar

#XAUUSD - October 25, 2026

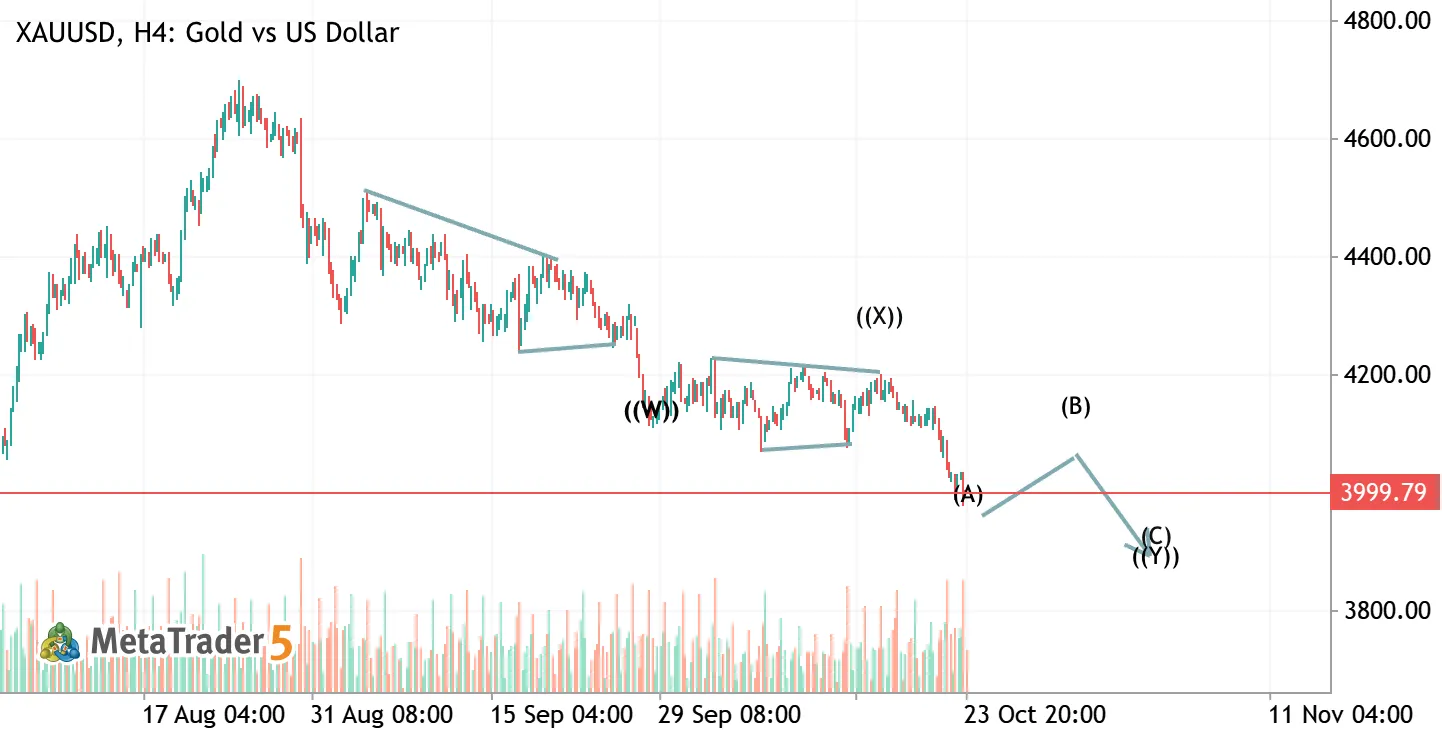
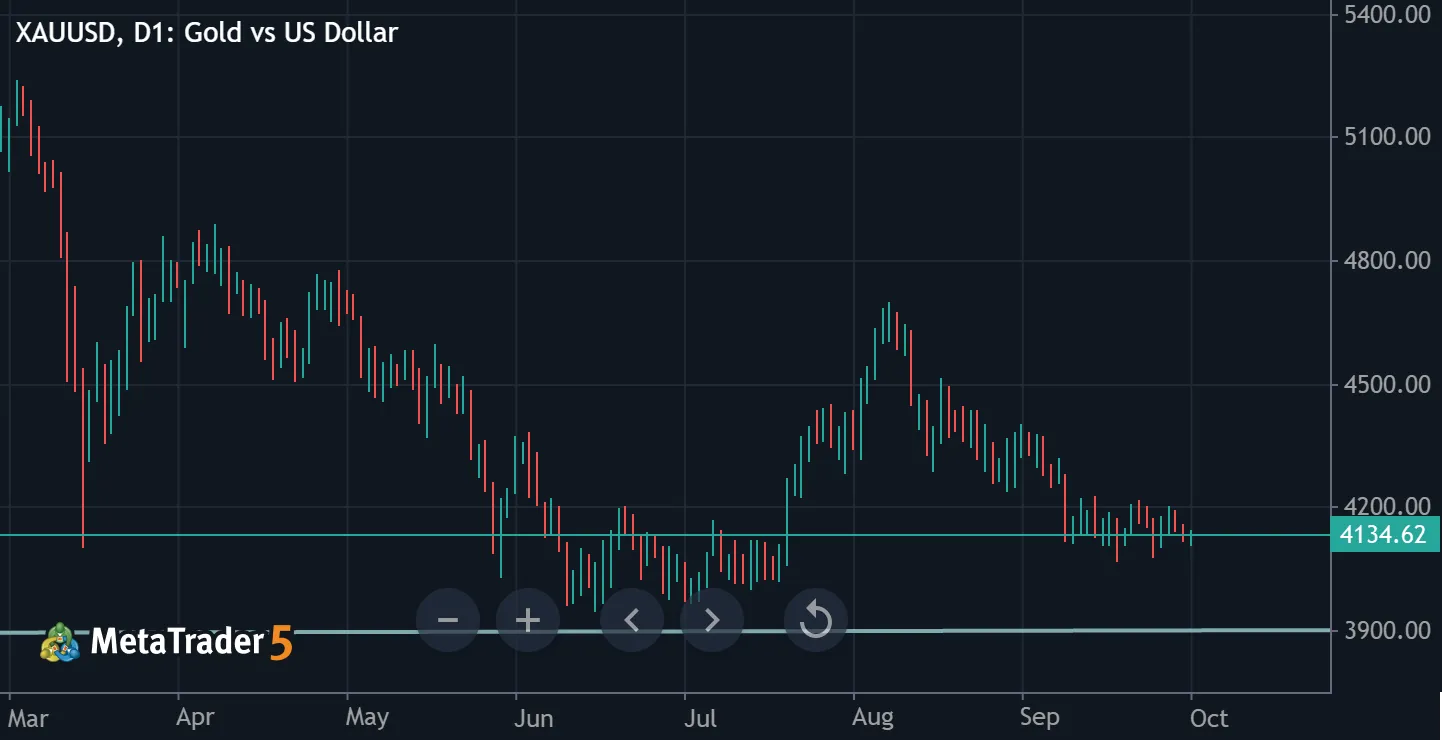
• Elliott Wave scenario on the H4 timeframe: A complex corrective structure (w)(x)(y) is forming. Price is currently developing wave (y)—potentially unfolding as a Zigzag. • Wave (x) as a triangle: This pattern acts as a redistribution zone, heavily supporting the scenario of further downside for Gold. • Daily timeframe perspective: The complex corrective sequence analyzed above is part of a larger diagonal wave structure, which belongs to a broader medium-term Zigzag pattern. (Note: This is an early projection based on current price action). • Projection: According to this scenario, the price could drop below the 3500 level. This structural development may take a considerable amount of time to play out, likely extending into early 2027. • Disclaimer: This analysis reflects a personal
Gold Daily Plan | Oct 22, 2026 XAUUSD Short Gold vs US Dollar

Gold Daily Plan | Oct 22, 2026

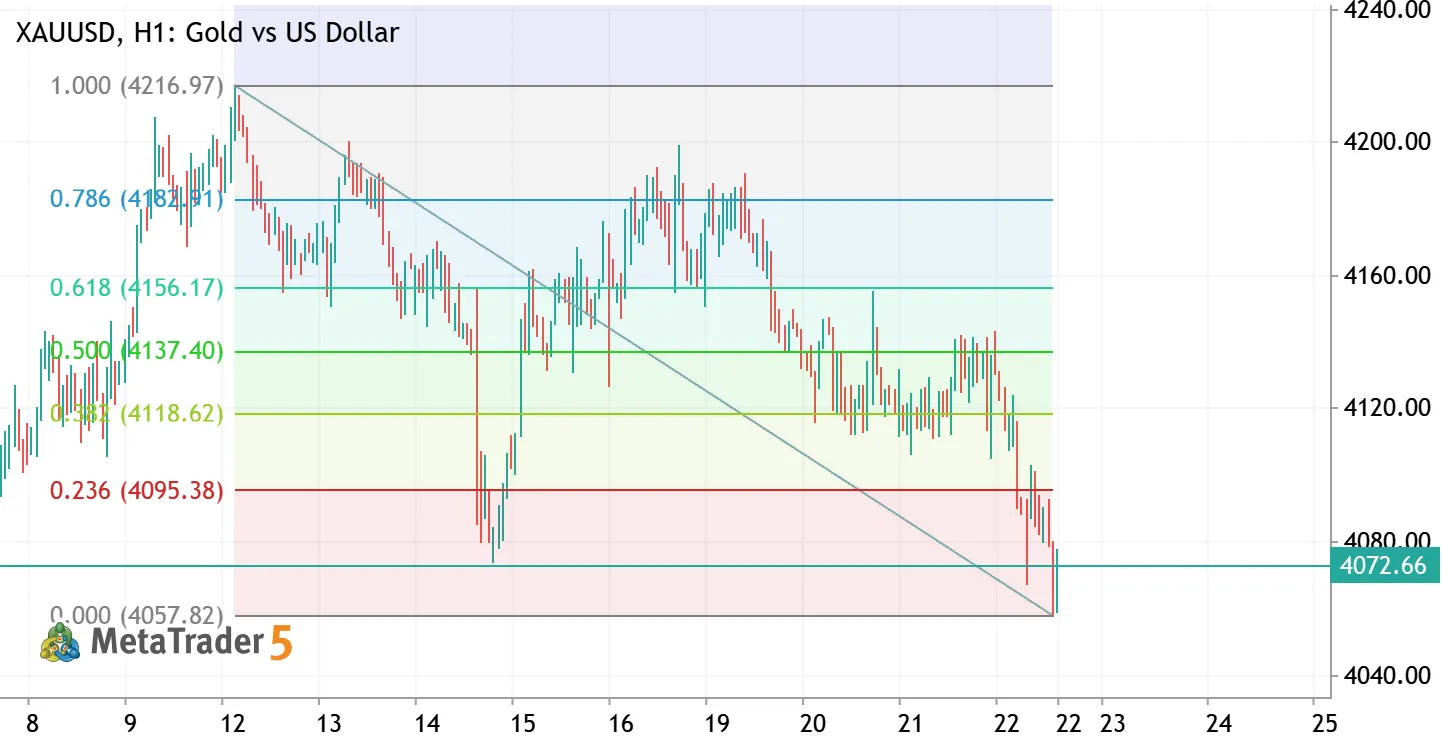
Gold Daily Plan | Oct 22, 2026 – Base broken, selling the pullback into 4095 **Recap:** Yesterday's long from 4124 hit TP1 (4140) ✅. After that, the 4105–4113 base gave way and gold dropped to a new low at 4057.55, below the Oct 14 low. On H1, that confirms the downtrend: lower highs and now a lower low. Fibonacci of the drop (4216.90 → 4057.55): - 0.236 → 4095.16 - 0.382 → 4118.42 - 0.500 → 4137.23 - 0.618 → 4156.03 **Fundamentals:** US jobless claims came in stronger than expected (194K vs 200K). A solid labor market keeps Fed hike expectations alive, which weighs on gold. **Plan:** The bias has flipped, so I'm not buying this bounce. I'd rather sell a pullback into **4095–4105**, where the 0.236 Fibonacci lines up with the broken support (now resistance). **Trade: SELL LIMIT XAUUSD
XAUUSD (Gold) – 4050 Support Base: Bulls Target a Strong Recovery XAUUSD Long Gold vs US Dollar

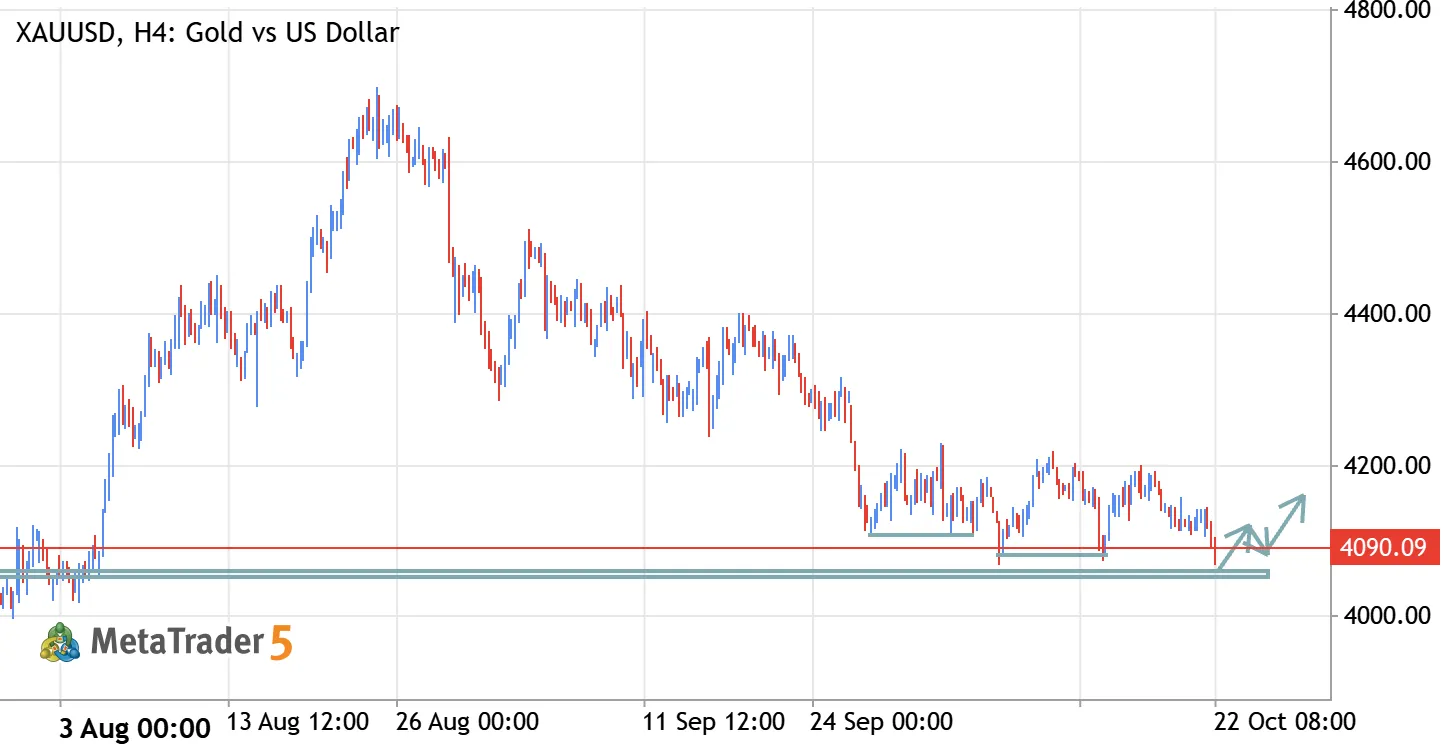
XAUUSD (Gold) – 4050 Support Base: Bulls Target a Strong Recovery

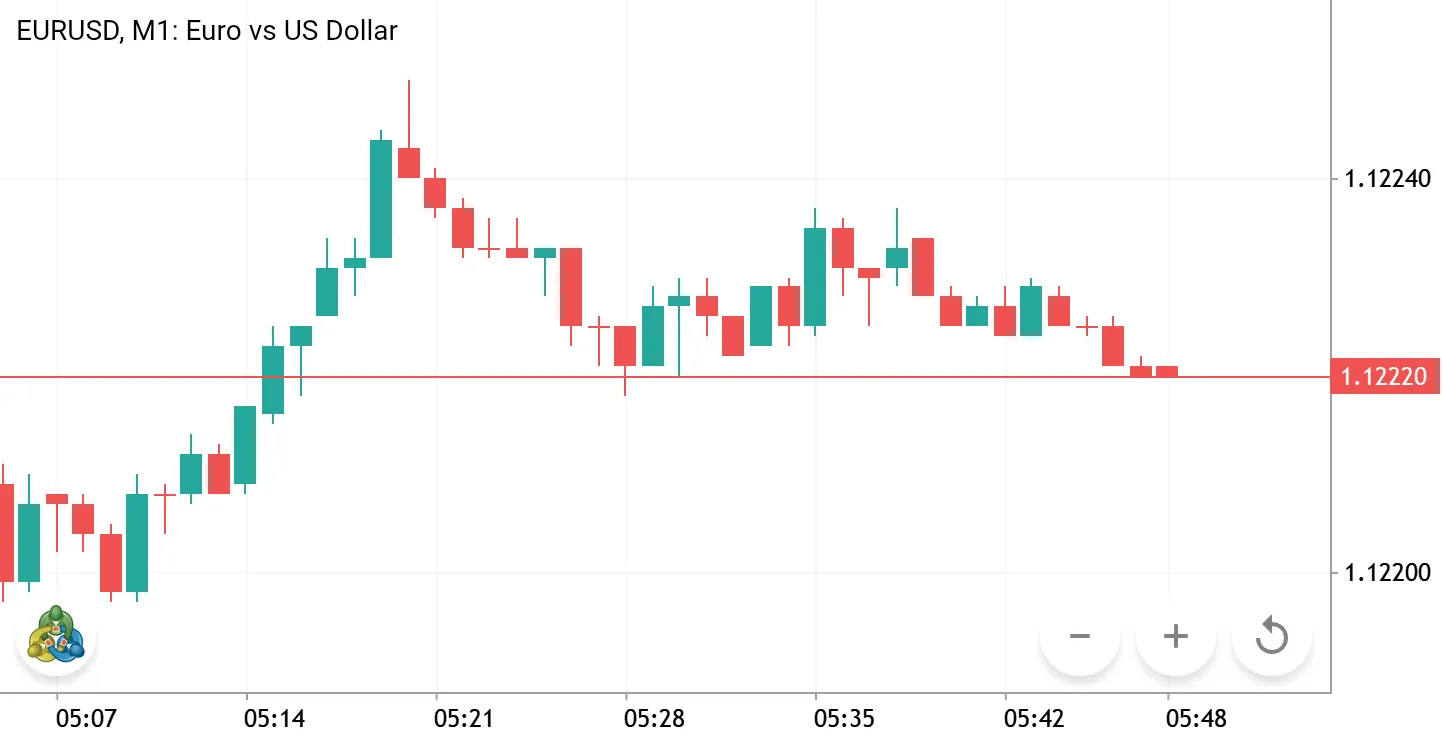
XAU/USD Buy Signal Buy Zone: 4060 – 4050 Stop Loss: 4030 Take Profit 1: 4080 Take Profit 2: 4110 Take Profit 3: 4160 Open Target: Open 📚 Educational Market Idea: Gold may revisit the 4060–4050 zone, where buyers could attempt to establish support and trigger a bullish recovery. If price holds this area and bullish confirmation appears, the next potential targets are 4080, 4110, and 4160. Watch for confirmation such as a strong bullish candle, a bullish engulfing pattern, or a break above nearby resistance before entering. If price breaks below the buy zone with strong bearish momentum, reassess the setup. 📌 Trade Management: Consider securing partial profits at TP1 and TP2 while protecting the remaining position as price moves in your favor. If bullish momentum continues, the remaining
US30 (Dow Jones) – 52000 Demand Zone: Bullish Rebound Setup 📈 30 US30 Long US Wall Street 30 Index

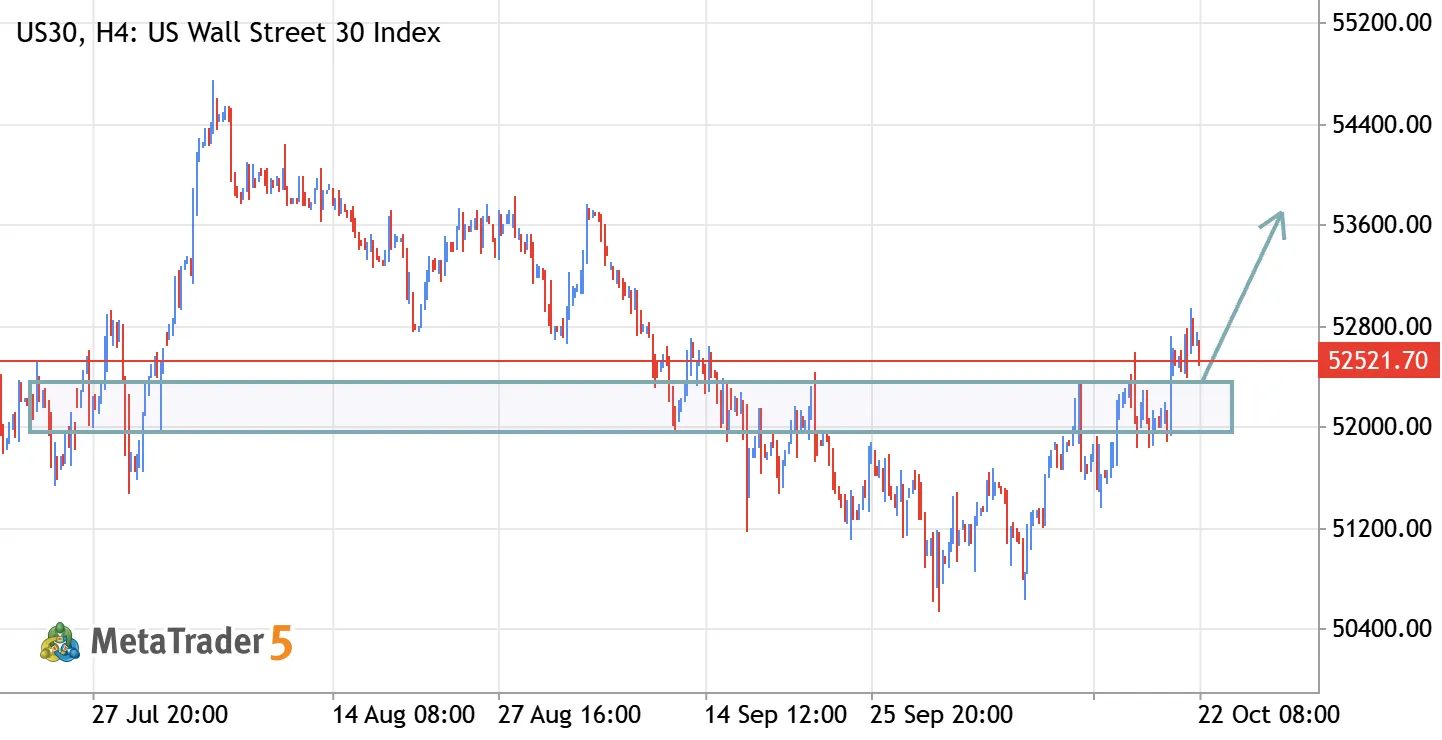
US30 (Dow Jones) – 52000 Demand Zone: Bullish Rebound Setup 📈

🟢 US30 Buy Signal Buy Zone: 52360 – 51960 Stop Loss: 51550 Take Profit 1: 53100 Take Profit 2: 53700 📚 Educational Market Idea: US30 is approaching the 52360–51960 zone, which may act as a potential demand area for buyers. If price reacts positively from this zone and bullish momentum develops, the index could move toward 53100, followed by 53700. Watch for bullish confirmation around the buy zone, such as a strong bullish candle, a bullish engulfing pattern, or a break above nearby resistance before entering. 📌 Trade Management: Consider securing partial profits at TP1 and protecting the remaining position as price moves in your favor. If bullish momentum continues, allow the trade to target TP2. Avoid entering blindly if price breaks below the buy zone with strong bearish momentum. ⏳
XAU/USD (Gold) – Bearish Zone from Support XAUUSD Short Gold vs US Dollar

XAU/USD (Gold) – Bearish Zone from Support

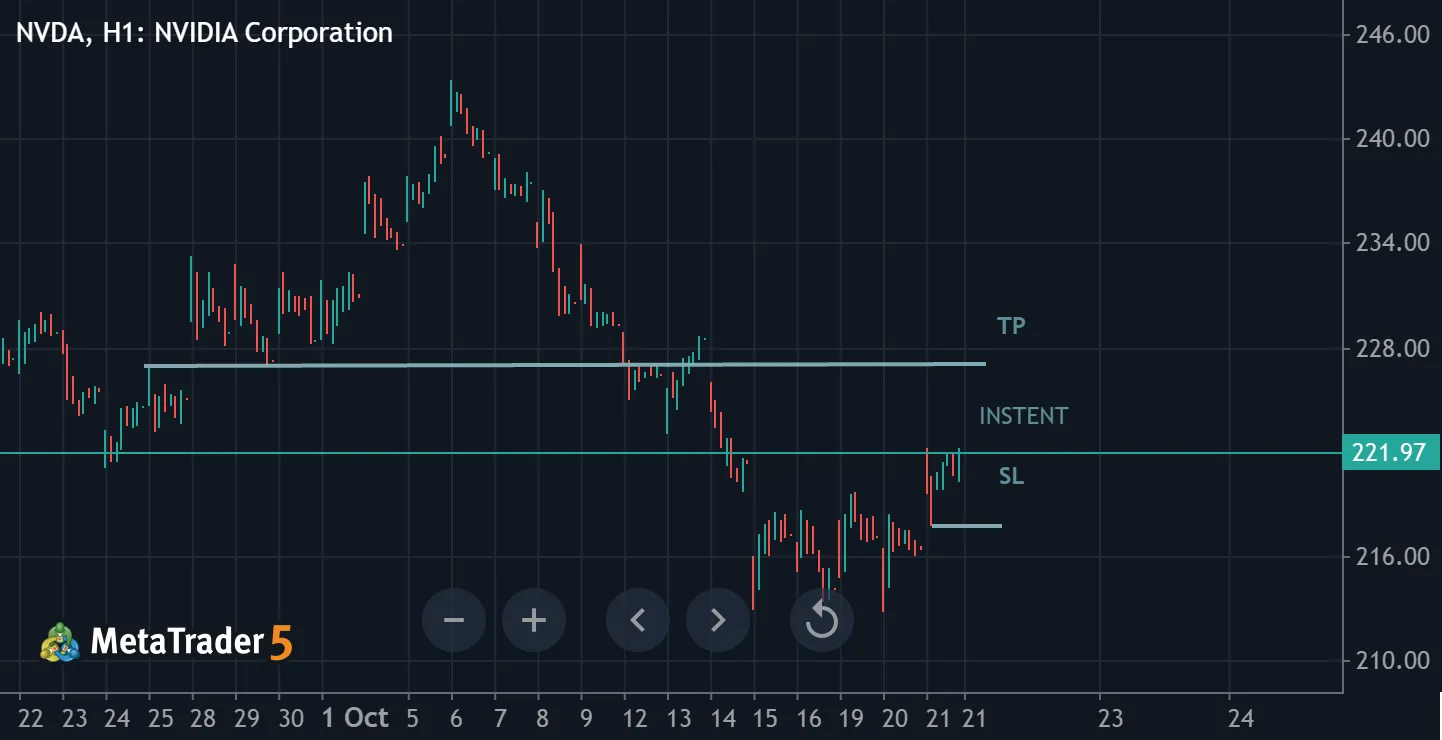
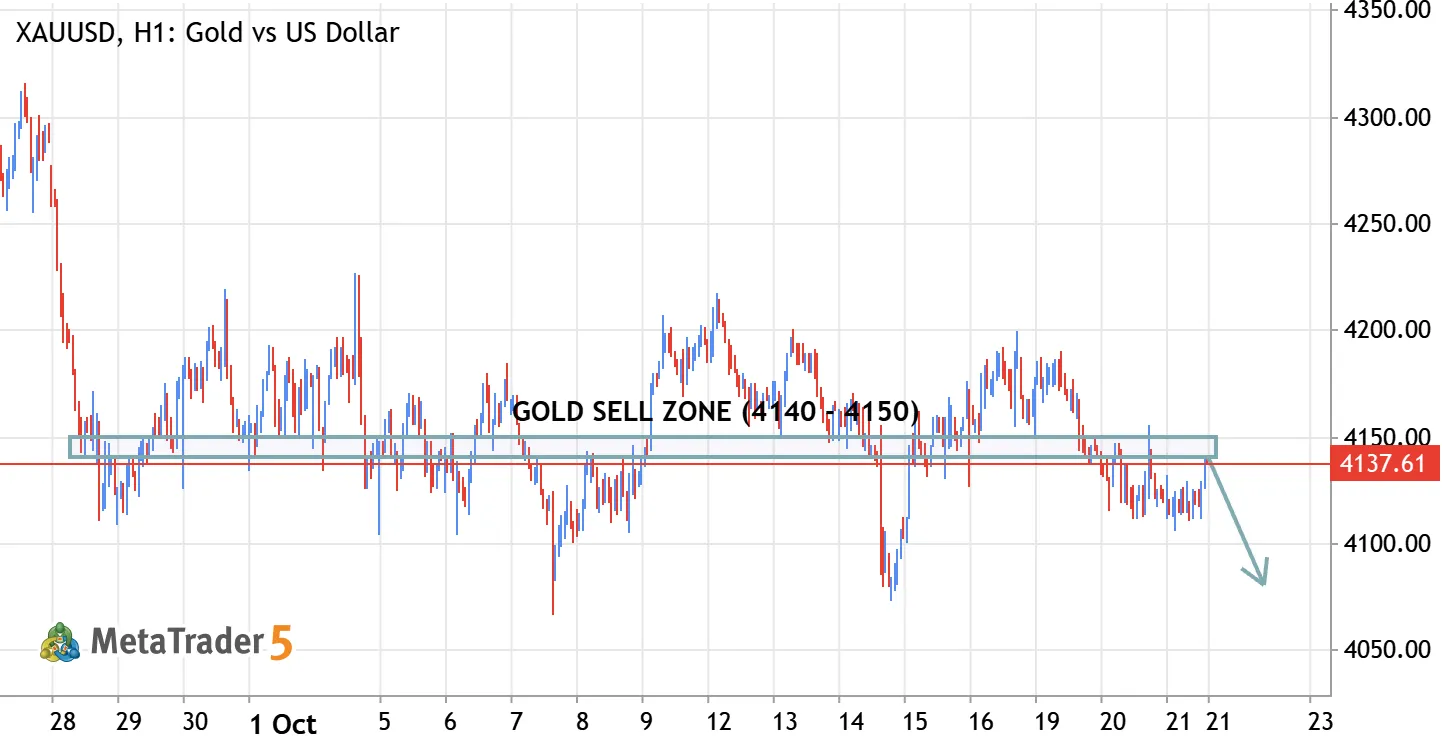
🟢 XAU/USD Buy Signal Sell Zone: 4140 - 4150 Stop Loss: 4165 Take Profit 1: 4130 Take Profit 2: 4110 Take Profit 3: 4090 Open Target: Open 📚 Educational Market Idea: Gold may test the 4140–4150 zone, where buyers could step in and attempt a bullish reversal. If this area holds and price action confirms selling pressure, Gold may recover downward 4130, followed by 4110, 4090 and Open. Watch for bullish confirmation, such as a strong bullish candle, a bullish engulfing pattern, or a recovery above nearby resistance before entering the trade. 📌 Trade Management: Consider securing partial profits at TP1 and TP2. After TP1, consider moving the stop loss toward breakeven if price action supports it. The remaining position can target TP3 or the Open Target if bullish momentum continues. ⏳ Trade
Brent Oil H1: Fibonacci Resistance & Bearish Pullback Setup XBRUSD Brent Oil vs US Dollar

Brent Oil H1: Fibonacci Resistance & Bearish Pullback Setup

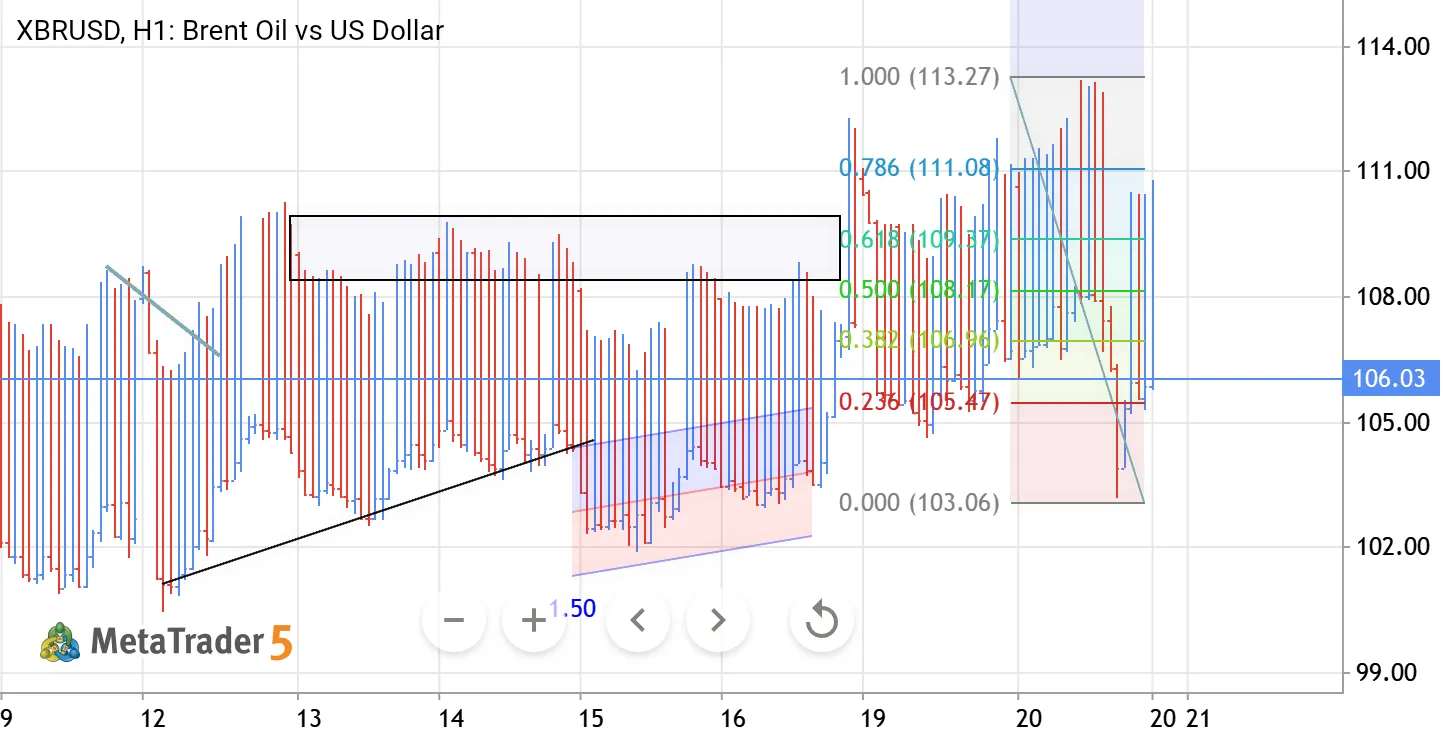
om the 111.00–113.27 resistance zone. The recent move shows strong selling pressure after price failed to sustain the higher Fibonacci levels. The Fibonacci structure highlights 108.16 (0.500) and 109.36 (0.618) as important resistance levels. Price is now below these areas, keeping the short-term structure under pressure. The 105.46 (0.236) level is the immediate support zone. A sustained break below this level could expose the 103.05 Fibonacci base and potentially extend the bearish move. On the upside, reclaiming 108.16–109.36 would weaken the bearish setup and could bring 111.08 back into focus. Key levels: • Resistance: 108.16 → 109.36 → 111.08 • Support: 105.46 → 103.05 • Major resistance: 113.27 This analysis focuses on Fibonacci levels, price structure, and rejection zones. Always