xauusd h4 analysis XAUUSD Gold vs US Dollar

xauusd h4 analysis

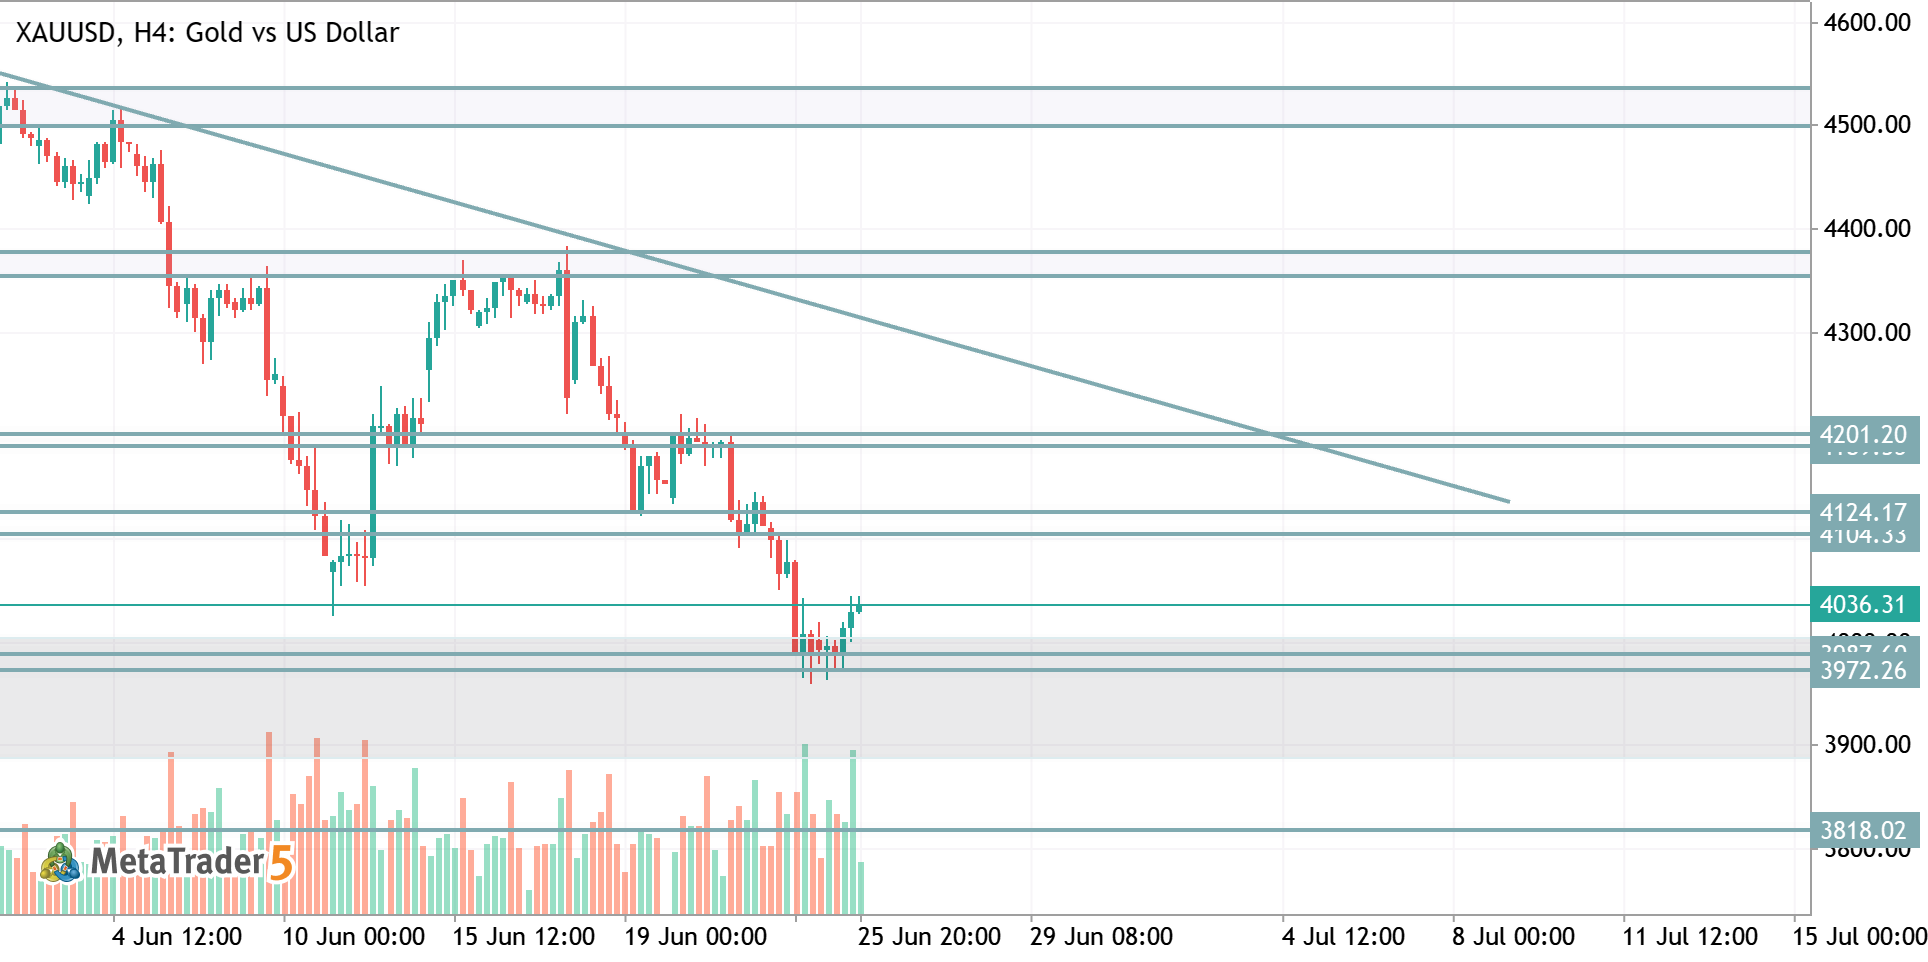
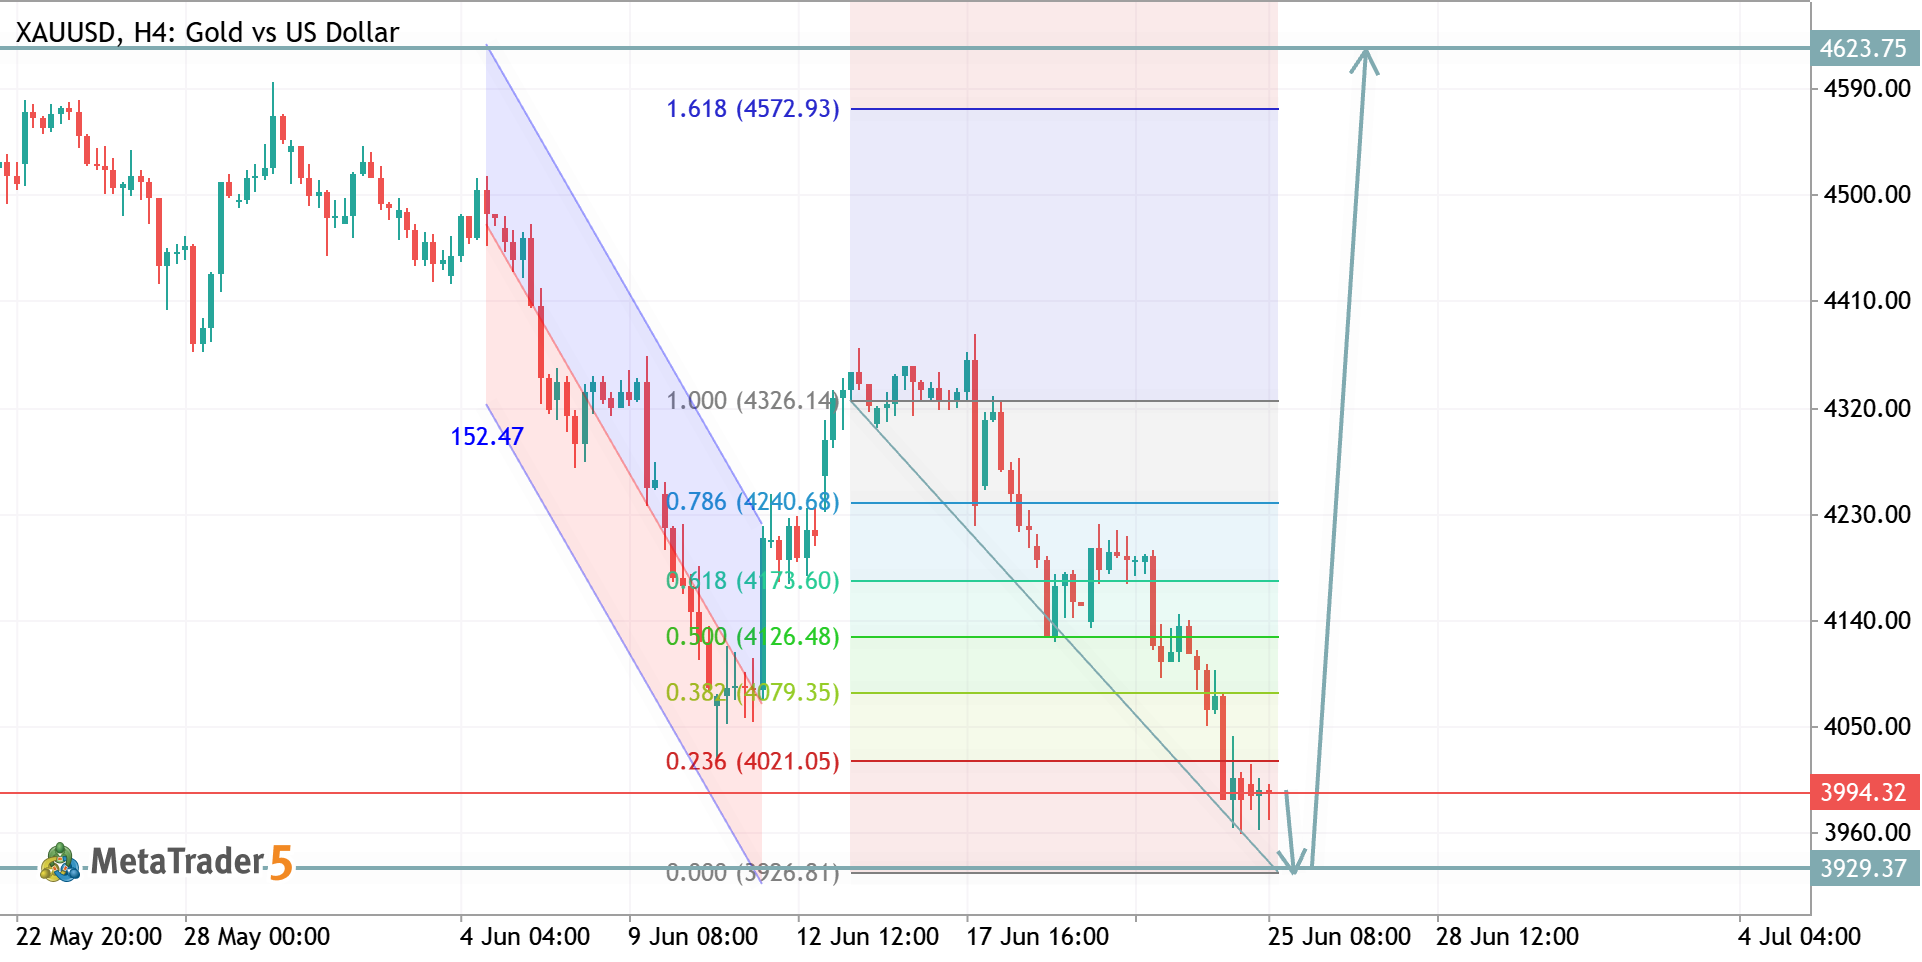
XAUUSD H4 Analysis Gold remains under bearish pressure after breaking below key Fibonacci support. Price is currently testing the 3929–4000 demand zone, where a potential liquidity sweep could trigger a strong reversal. 📉 Bearish scenario: A confirmed break below 3929 may extend the decline. 📈 Bullish scenario: Holding above current support could fuel a recovery toward 4327, with an extended target near 4574 (1.618 Fib level). Key Levels: Support: 3929 Resistance: 4327 Bullish Target: 4574 Watch for bullish confirmation before considering long positions. Risk management remains essential.
XAUUSD TRADE IDEA XAUUSD Long Gold vs US Dollar

XAUUSD TRADE IDEA

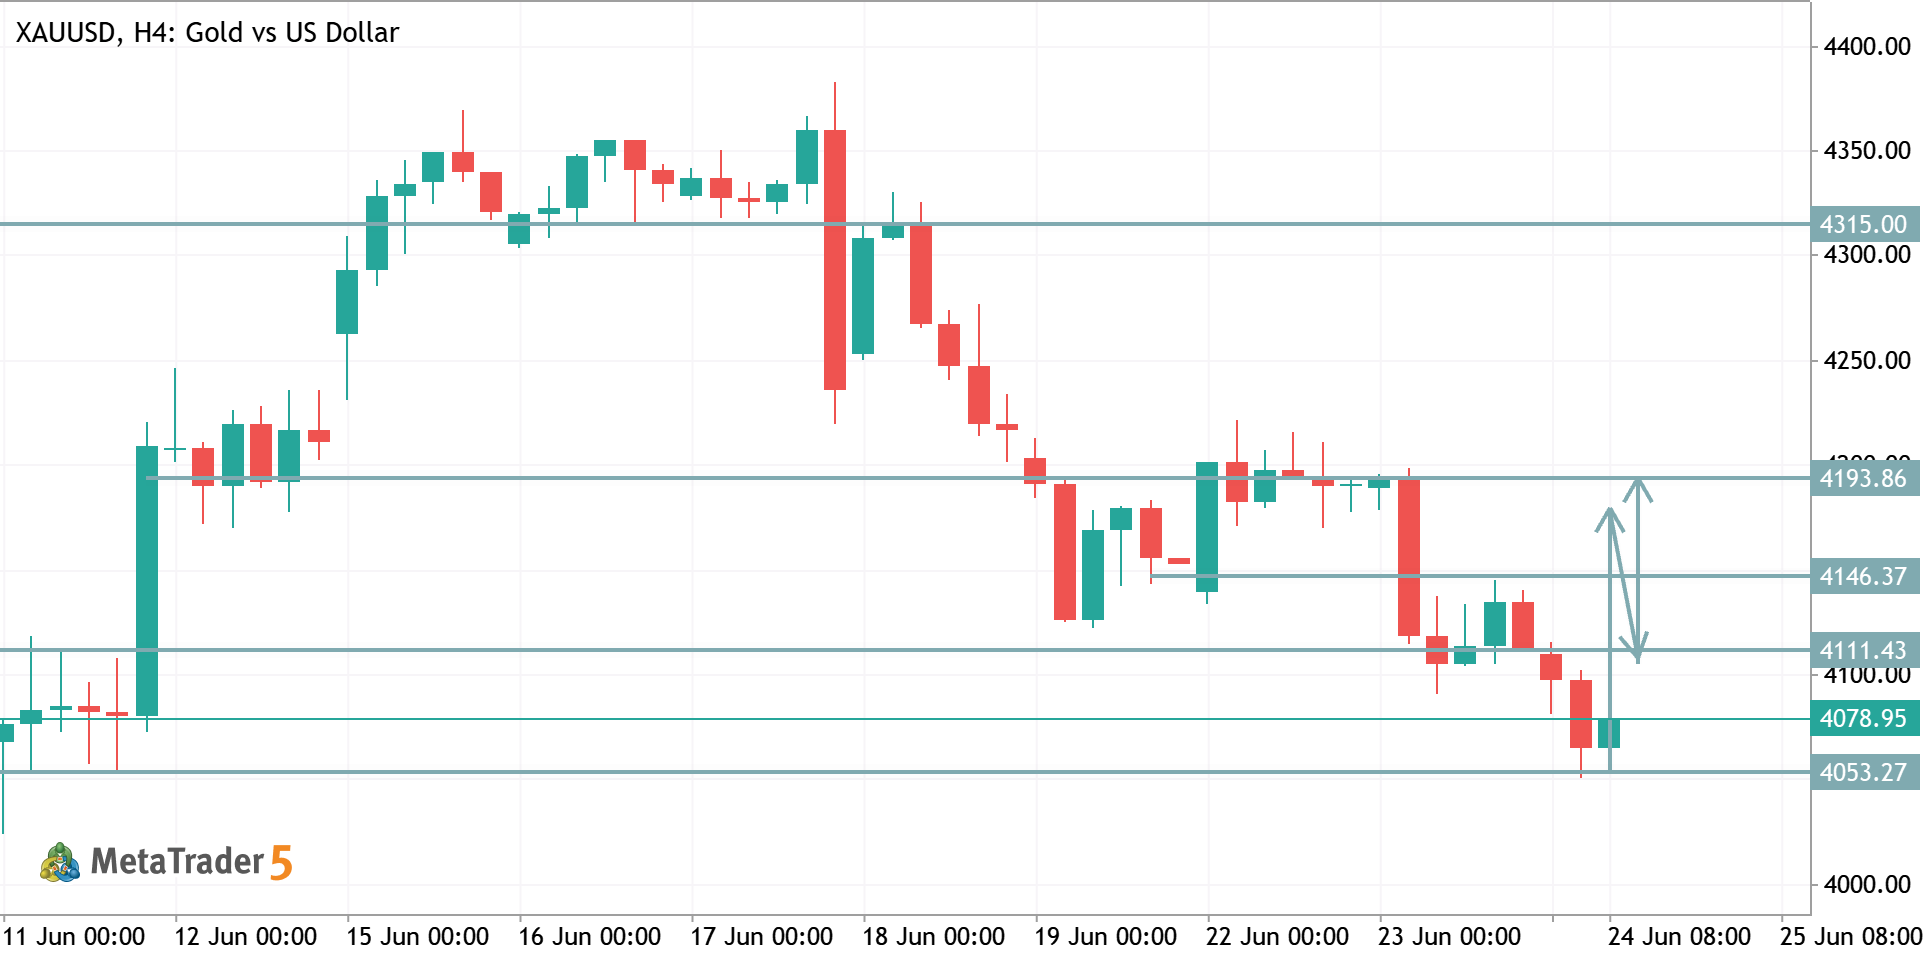
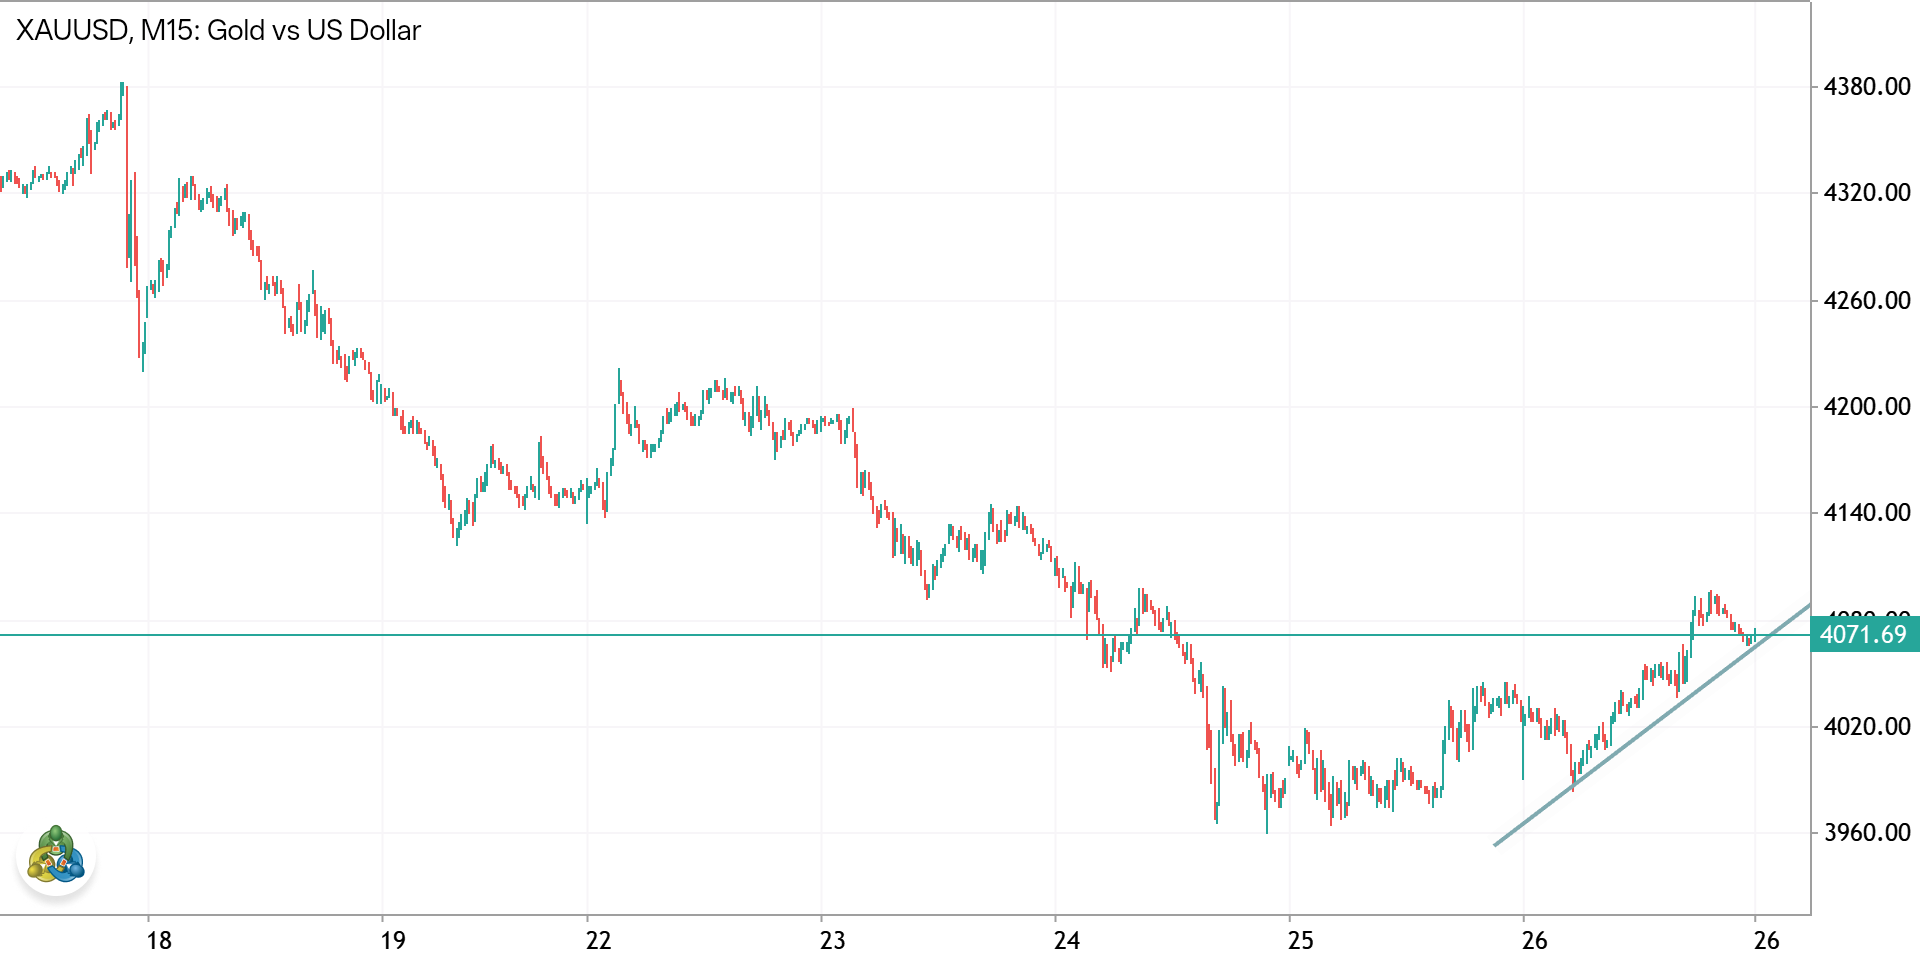
XAUUSD H4 – Buy Analysis Price is testing a strong support zone around 4053–4080 . A bounce from this area could trigger a corrective move higher. Buy Entry Zone: 4055 – 4085 Targets: TP1: 4111 TP2: 4146 TP3: 4194 Stop Loss: Below 4045 Confirmation: Bullish engulfing candle on H4 Strong close above 4080 Higher low formation Summary: A buy trade is attractive while price remains above 4053 . The first objective is 4111 , followed by 4146 if bullish momentum continues. The broader trend remains bearish, so treat buys as a counter-trend setup unless price breaks and holds above 4194 .
XAUUSD bullish reversal setup XAUUSD Long Gold vs US Dollar

XAUUSD bullish reversal setup

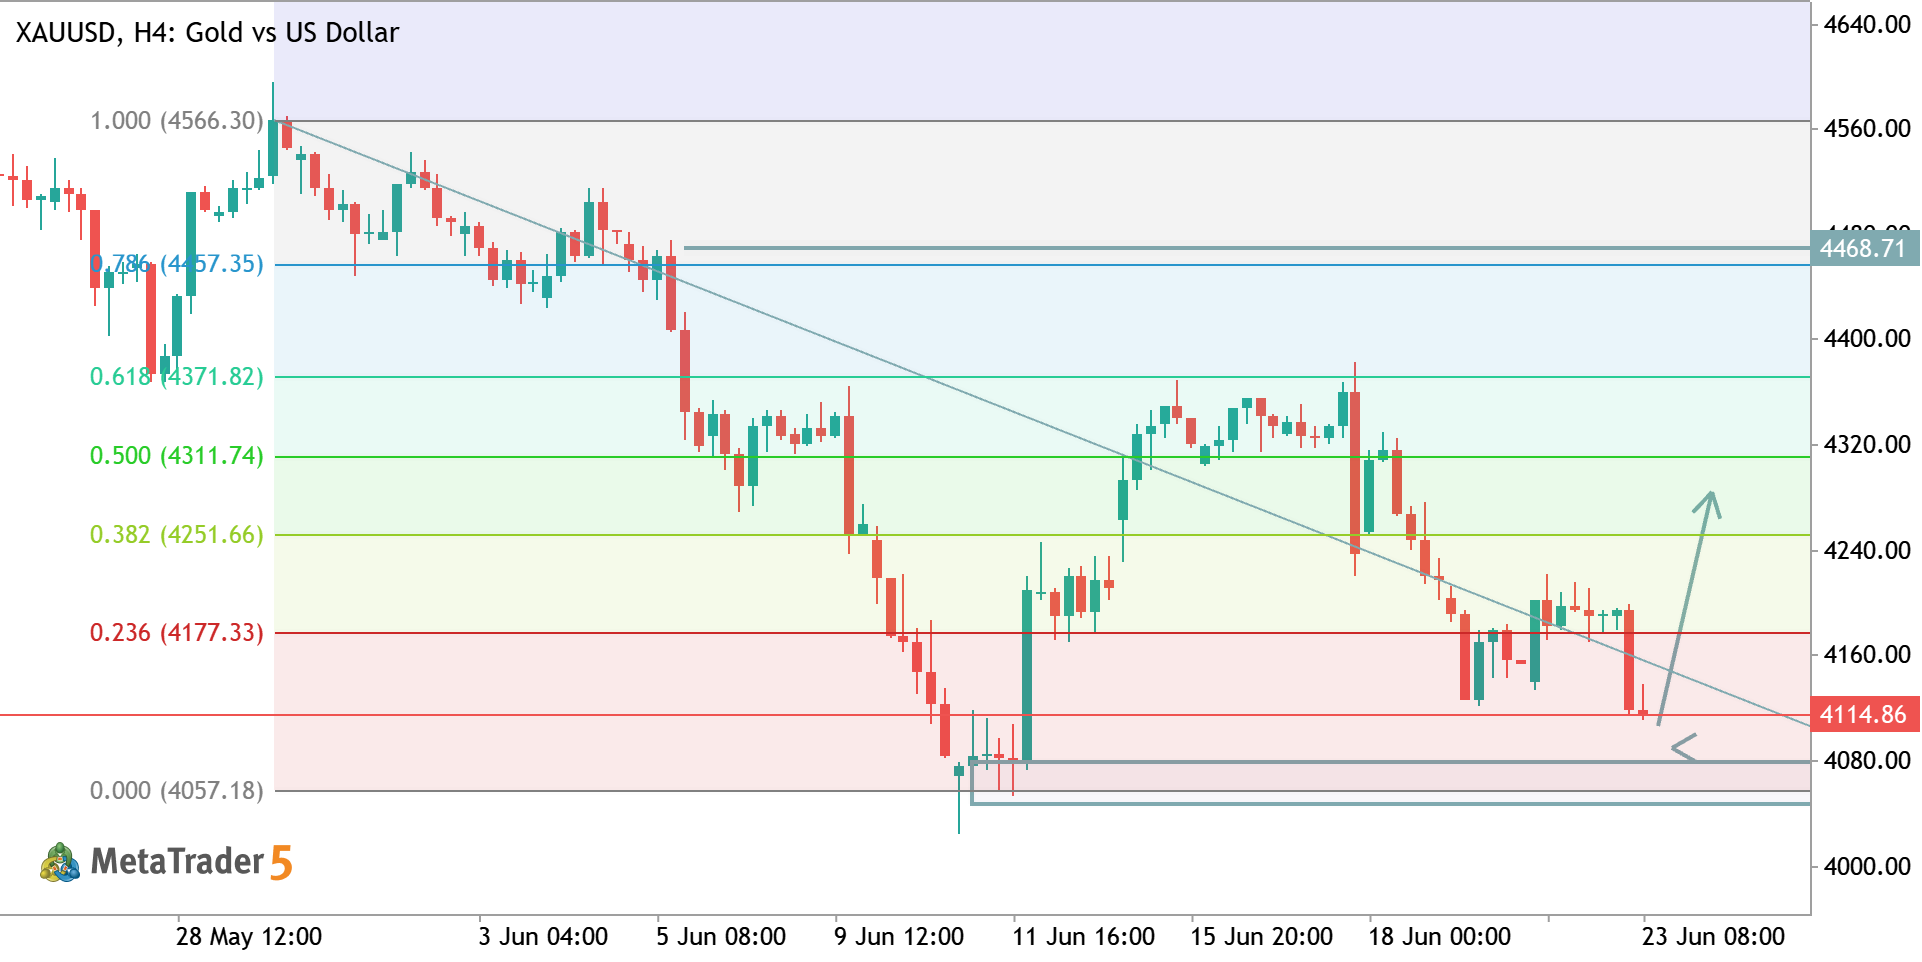
$Gold is testing a major demand zone after a prolonged decline, with price reacting near the 0.236 Fibonacci support. This area could provide the foundation for a bullish recovery if buyers step in with strong momentum. Market structure • Downtrend trendline still in play • Price holding above the key support zone • Strong demand area being tested • Potential bullish reversal from support Trade scenario Wait for a strong bullish confirmation candle before entering. A successful rebound from the current support zone could trigger a recovery toward the next Fibonacci resistance levels. Targets TP1: 4252.02 TP2: 4312.09 TP3: 4372.17 TP4: 4457.70 Invalidation A decisive break below the current support zone would invalidate the bullish setup and increase the probability of further downside
GBPUSD H1 ANALYSIS GBPUSD Pound Sterling vs US Dollar

GBPUSD H1 ANALYSIS

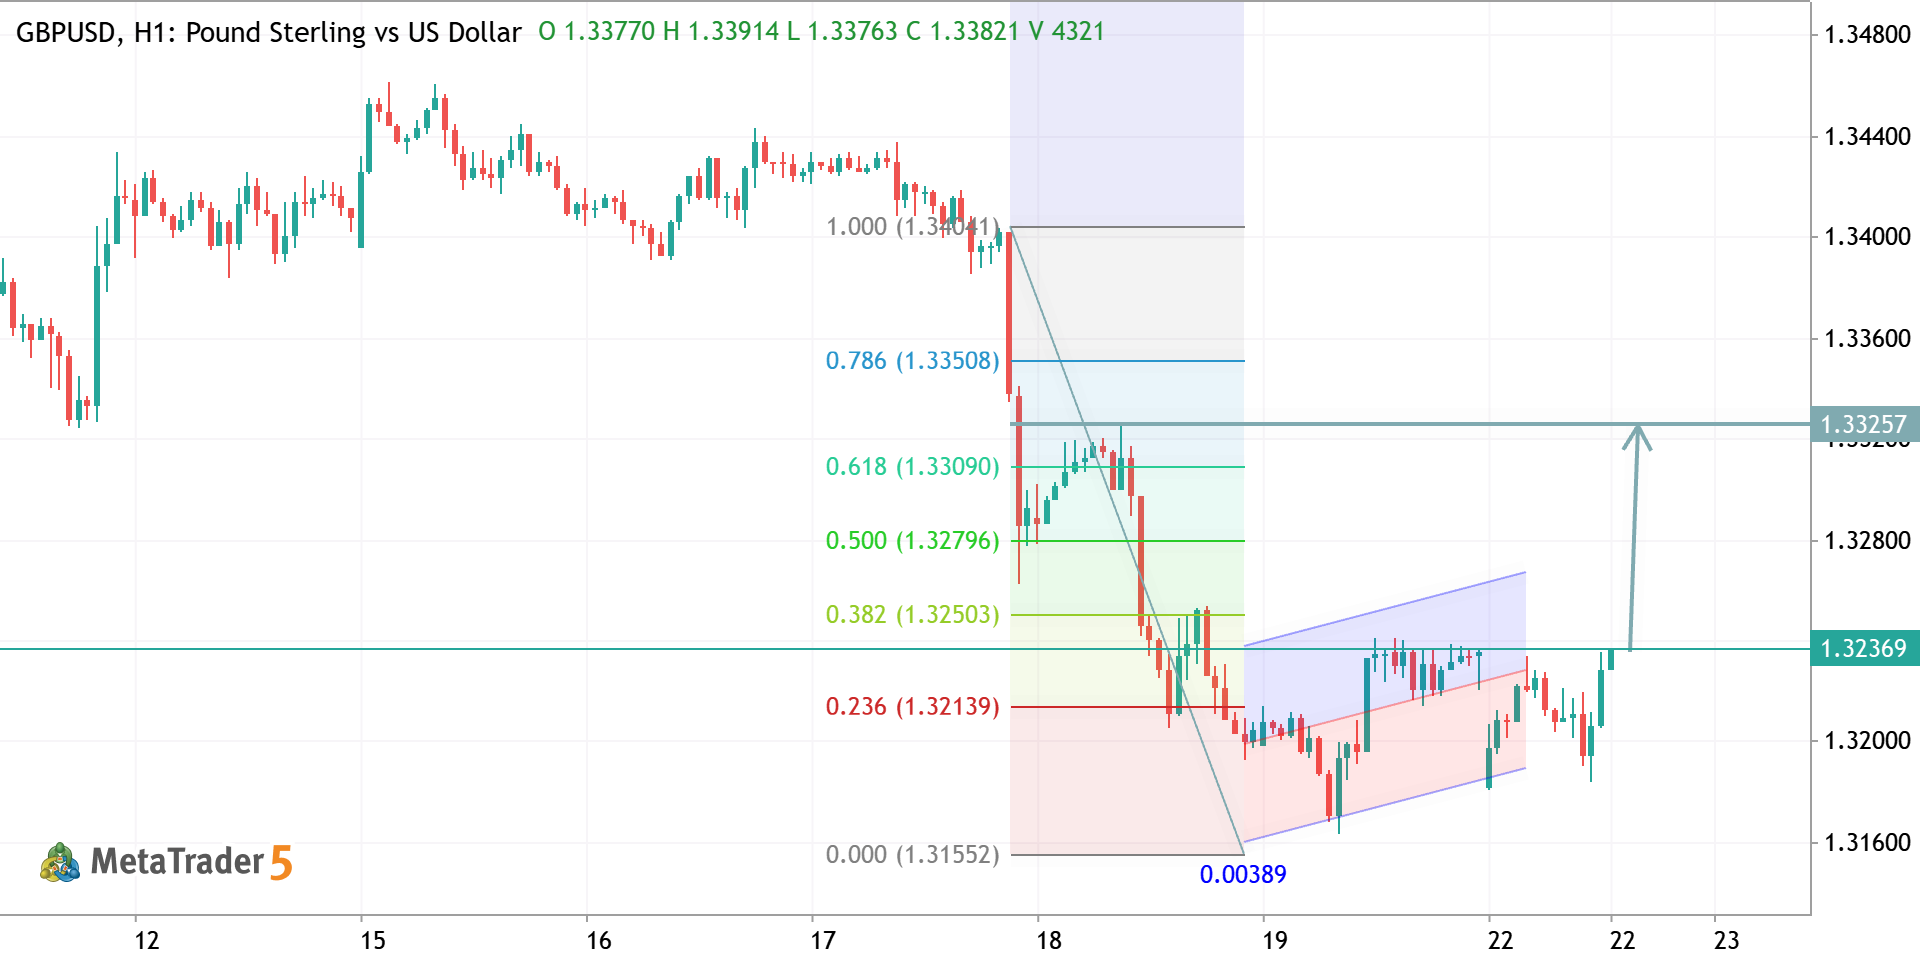
GBPUSD | H1 Analysis Price has completed a corrective move and is now breaking out of a bullish channel. The recent rebound from support and strong momentum above the Fibonacci mid-level suggest buyers are back in control. 📈 Bullish Target: A sustained move above 1.3240 could drive price toward the 1.3320 – 1.3350 resistance zone. ⚠️ Risk: A drop back below 1.3200 may weaken the bullish structure and trigger a deeper pullback. Bias: Bullish 🚀 | Trend favors upside continuation while above key support.
EURUSD H4 ANALYSIS EURUSD Euro vs US Dollar

EURUSD H4 ANALYSIS

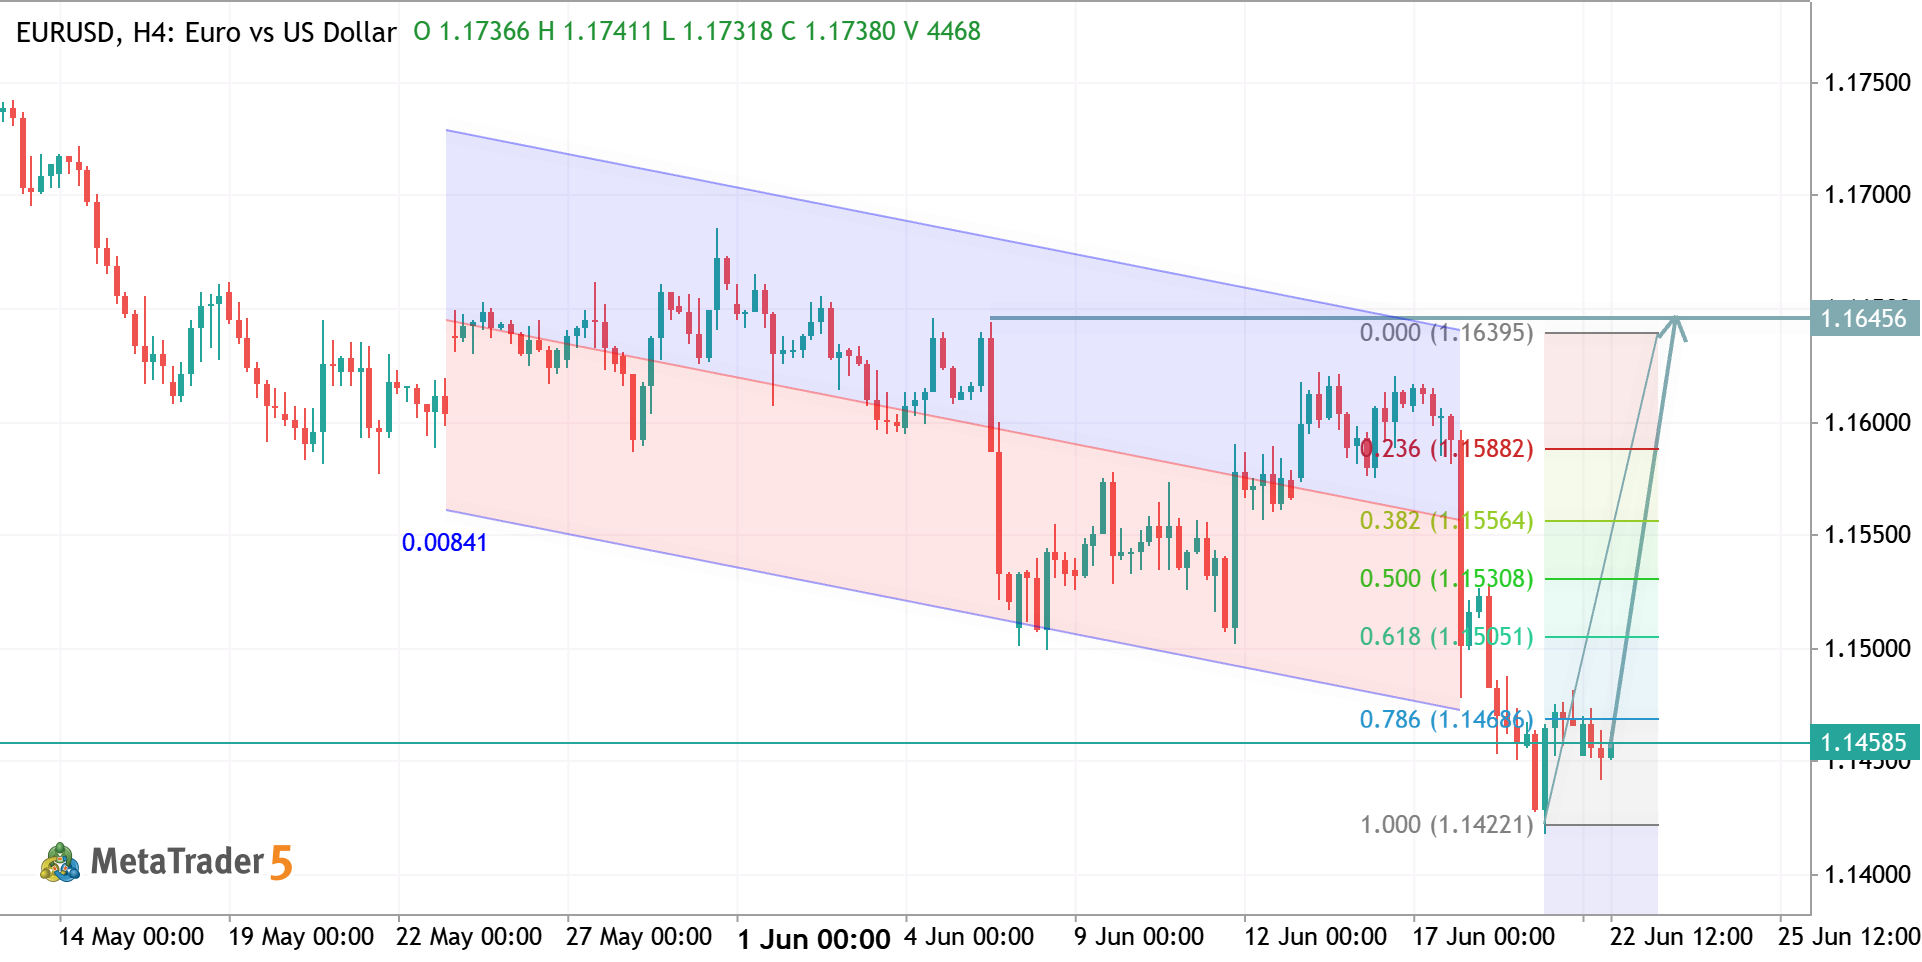
EURUSD | H4 Analysis Price is trading inside a broad range and has recently bounced from key support near 1.1450. The Fibonacci retracement shows buyers regaining control, with price targeting the upper resistance zone around 1.1660. 📈 Bullish Outlook: Holding above support keeps the path open for a move toward 1.1660+. ⚠️ Invalidation: A break below 1.1450 could shift momentum back to the downside. Bias: Bullish | Buying pressure remains strong above support. 🚀
BTCUSD H4 ANALYSIS BTCUSD Bitcoin vs US Dollar

BTCUSD H4 ANALYSIS

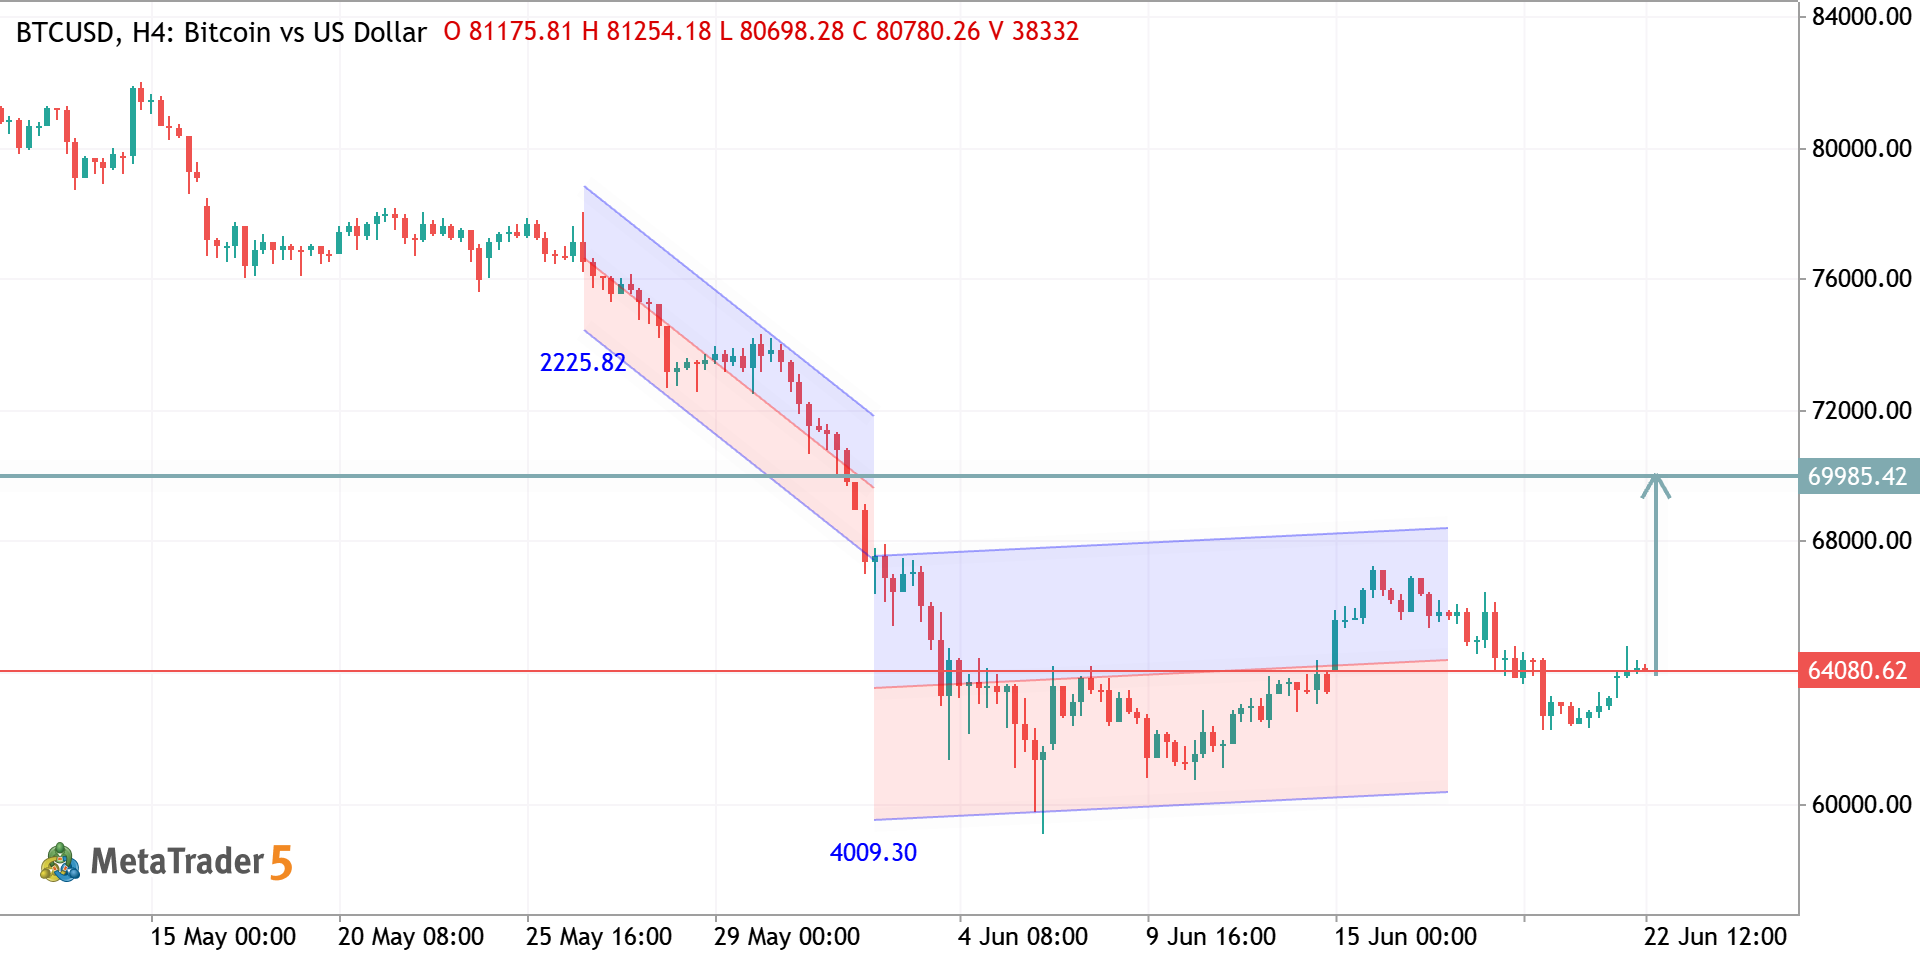
BTCUSD | H4 Analysis Price has successfully broken out of the consolidation range and is showing strong bullish momentum. The recent retest of support around 64,000 held firmly, confirming buyer strength. 📈 Bullish Scenario: As long as price remains above the breakout zone, the next target is around 69,800 – 70,000. ⚠️ Risk: A sustained move back below 64,000 could invalidate the bullish outlook and trigger a deeper correction. Bias: Bullish 🚀 | Buy the dips while above key support.
BTCUSD TRADE IDEA BTCUSD Long Bitcoin vs US Dollar

BTCUSD TRADE IDEA

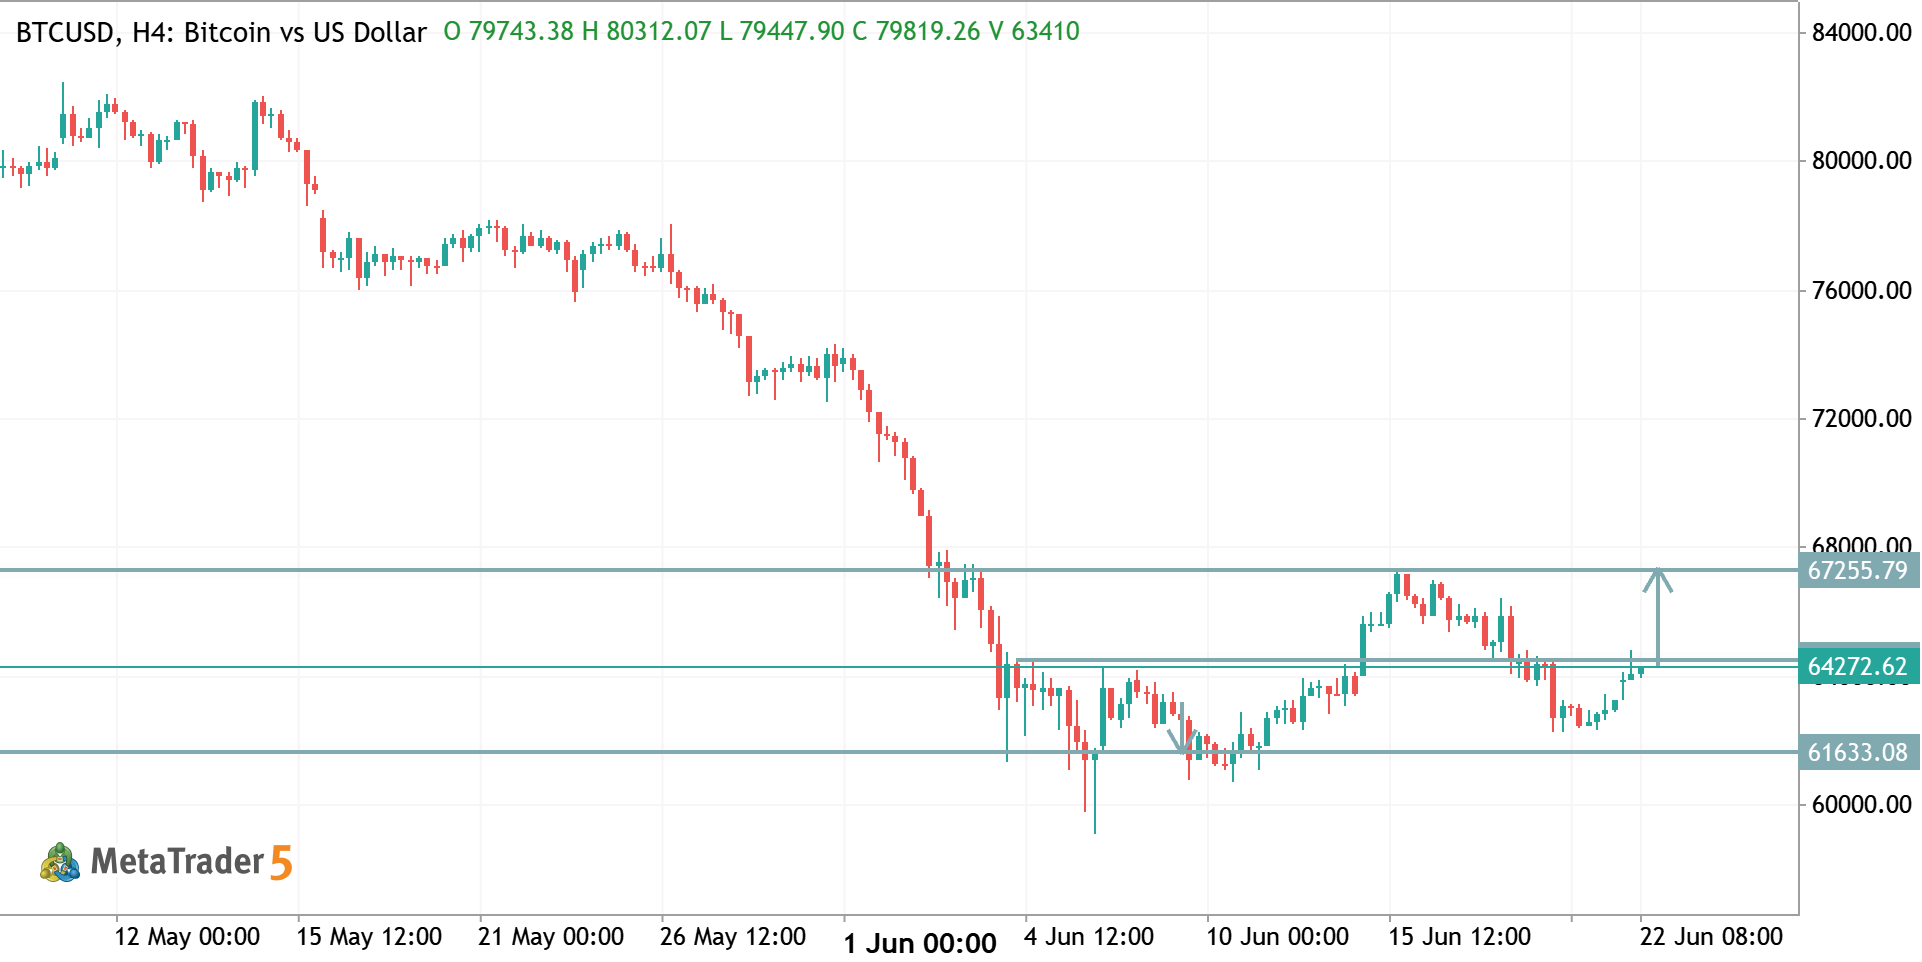
BTCUSD (H4) – Buy Analysis 📈 Bias: Bullish (Short-Term Recovery) Entry Zone: 63,800 – 64,400 Stop Loss: 61,500 Take Profit Targets: TP1: 66,000 TP2: 67,255 TP3: 70,000 Technical Reasoning: Strong support is holding around 61,633 . Price has formed a higher low after the recent selloff. BTC is attempting to reclaim and hold above the 64,330 resistance zone. A breakout above 64,330 could trigger momentum toward 67,255 . Confirmation Signal: Wait for an H4 candle close above 64,330 . Increased bullish volume would strengthen the setup. Trade Idea: Buy above 64,330 , targeting 67,255 , while keeping risk below 61,500 . A successful breakout could signal a larger recovery move. 📈🚀
XAUUSD TRADE IDEA XAUUSD Long Gold vs US Dollar

XAUUSD TRADE IDEA

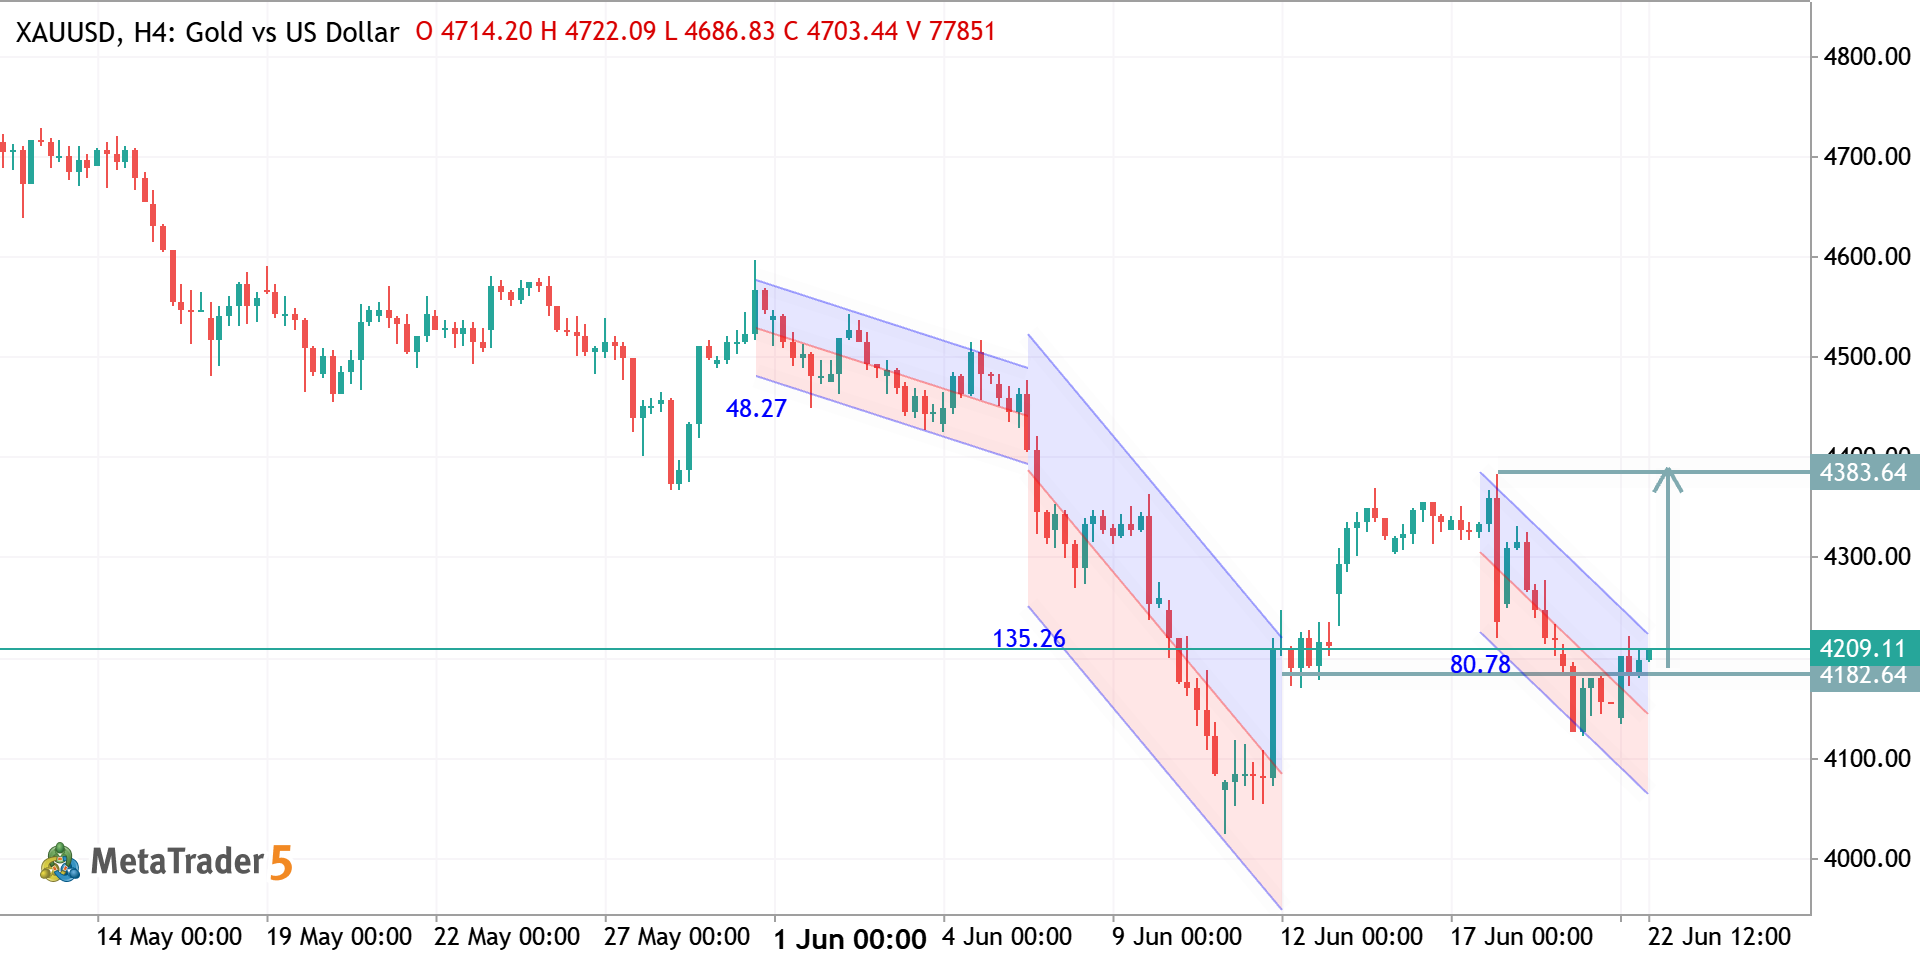
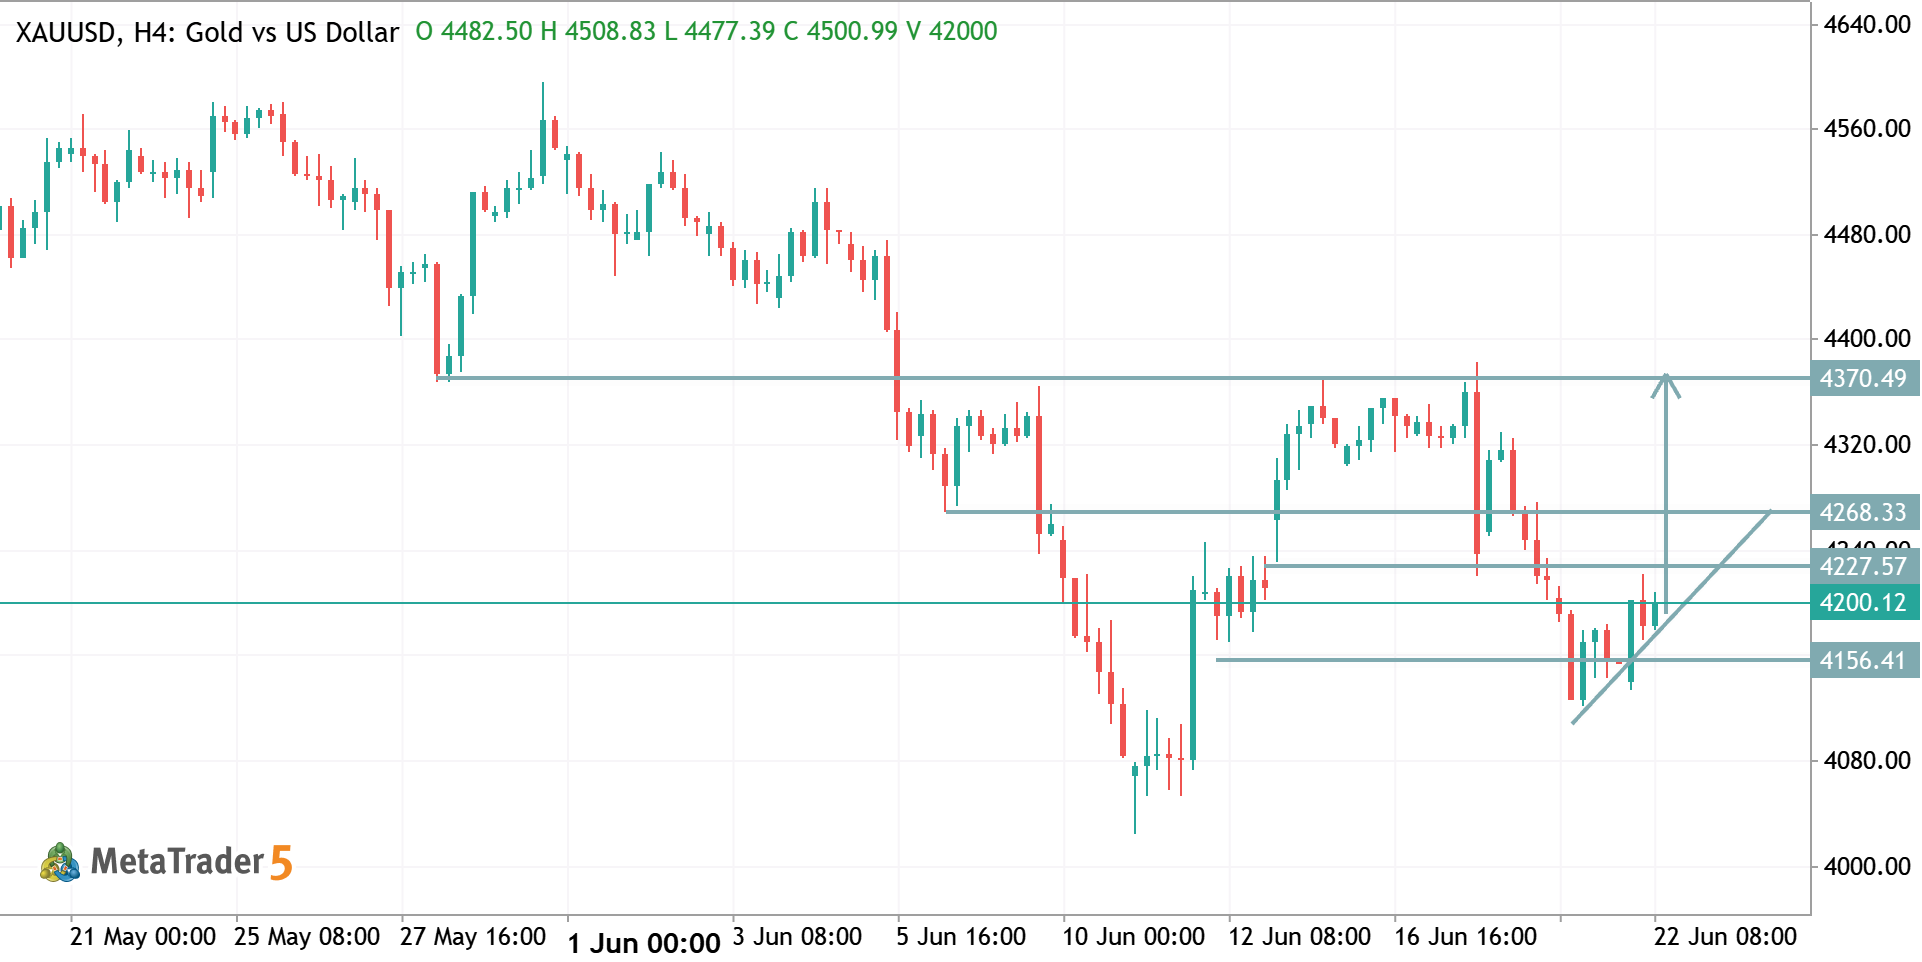
XAUUSD H4 – Buy Analysis 📈 Buy Bias Price has formed a strong reaction from the 4156 support zone . The ascending trendline indicates increasing buying pressure. A break above 4201 would confirm bullish continuation. Buy Entry: Above 4201 (after H4 candle confirmation) Targets: 🎯 TP1: 4227 🎯 TP2: 4268 🎯 TP3: 4370 Stop Loss: 🔻 Below 4156 Outlook: As long as price remains above 4156 , buyers have the advantage and the market may continue higher toward 4268–4370 .
GBPUSD - Daily Trading Forecast GBPUSD Short Pound Sterling vs US Dollar

GBPUSD - Daily Trading Forecast

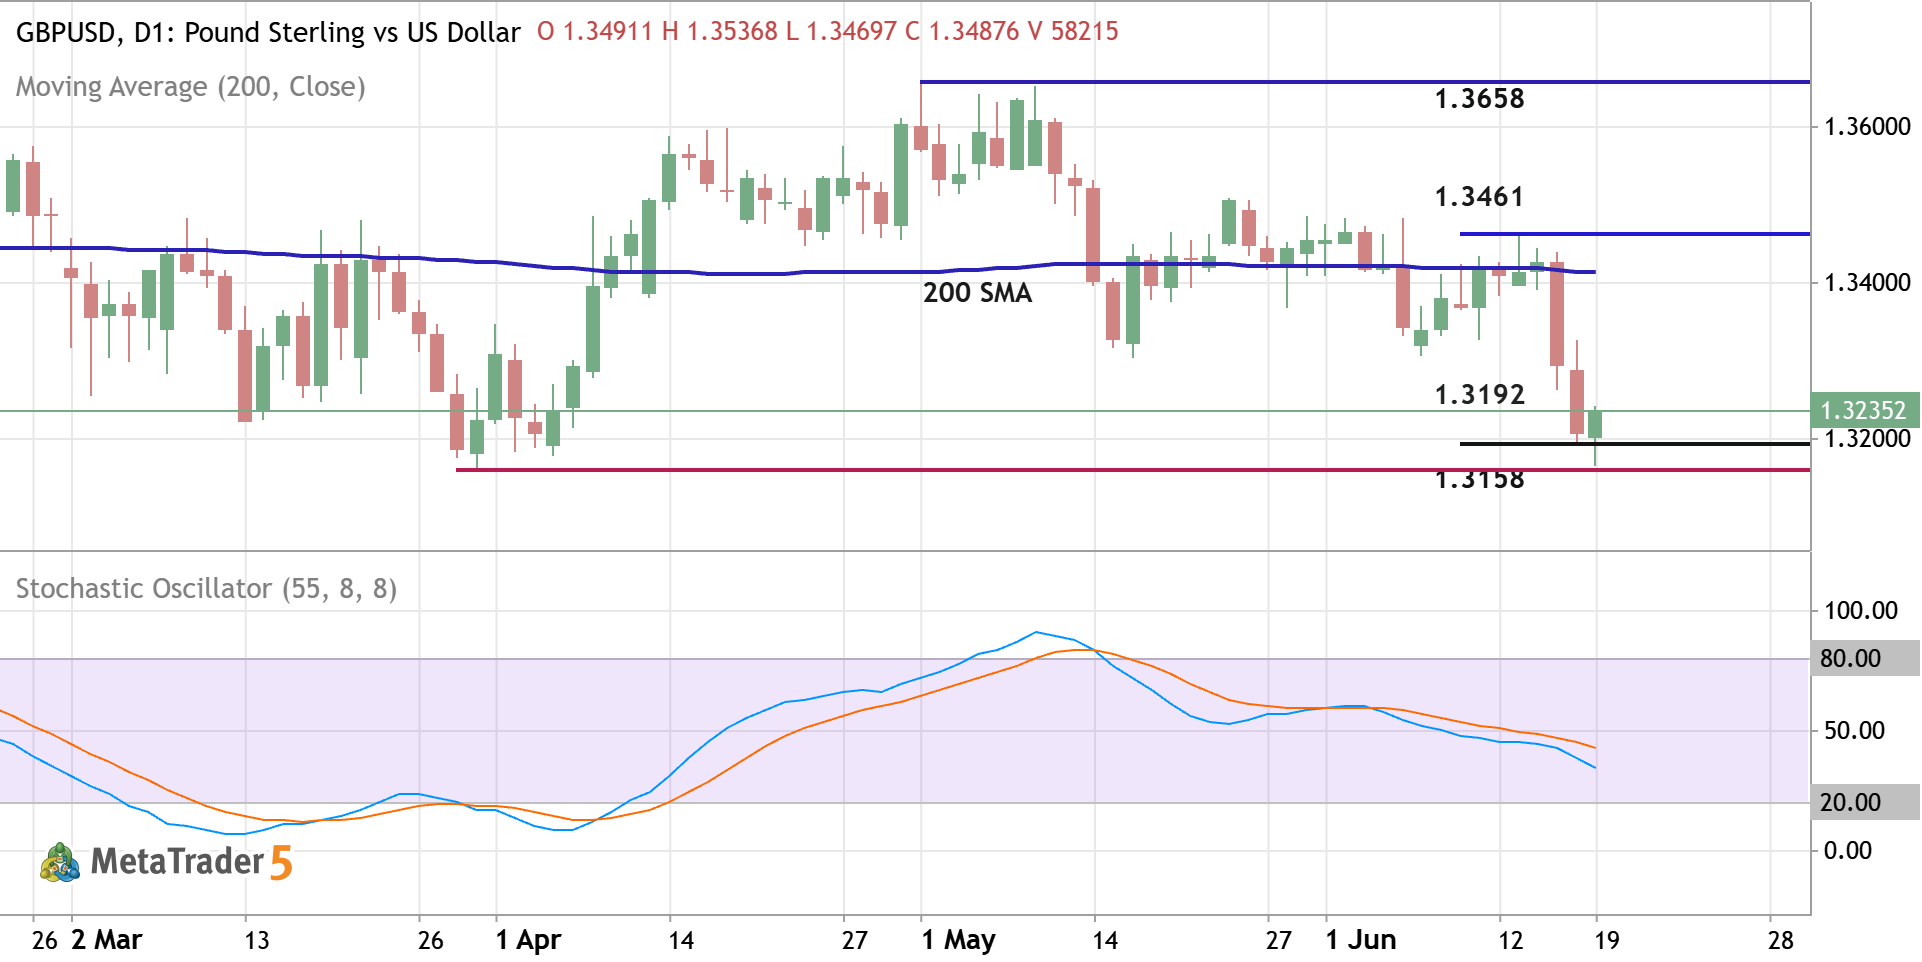
Daily price broke 200 SMA for the primary bearish reversal. The price is trying to cross the support level at 1.3192 for the bearish trend to be continuing. If the price breaks resistance level at 1.3461 together with 200 SMA to above so the primary bullish reversal will be started with 1.3658 possible target to re-enter. If the price crosses the support level at 1.3192 and support level at 1.3158 as well to below so the bearish trend will be continuing with 1.3009 possible global target. Alternatively, the price will be on secondary ranging within the primary bearish trend waiting for the direction of the bullish reversal to be started or the strong bearish trend to be continuing. Trading Summary : bearish breakdown; ready for the bear market rally to be started.