BTCUSD H1 ANALYSIS BTCUSD Bitcoin vs US Dollar

BTCUSD H1 ANALYSIS

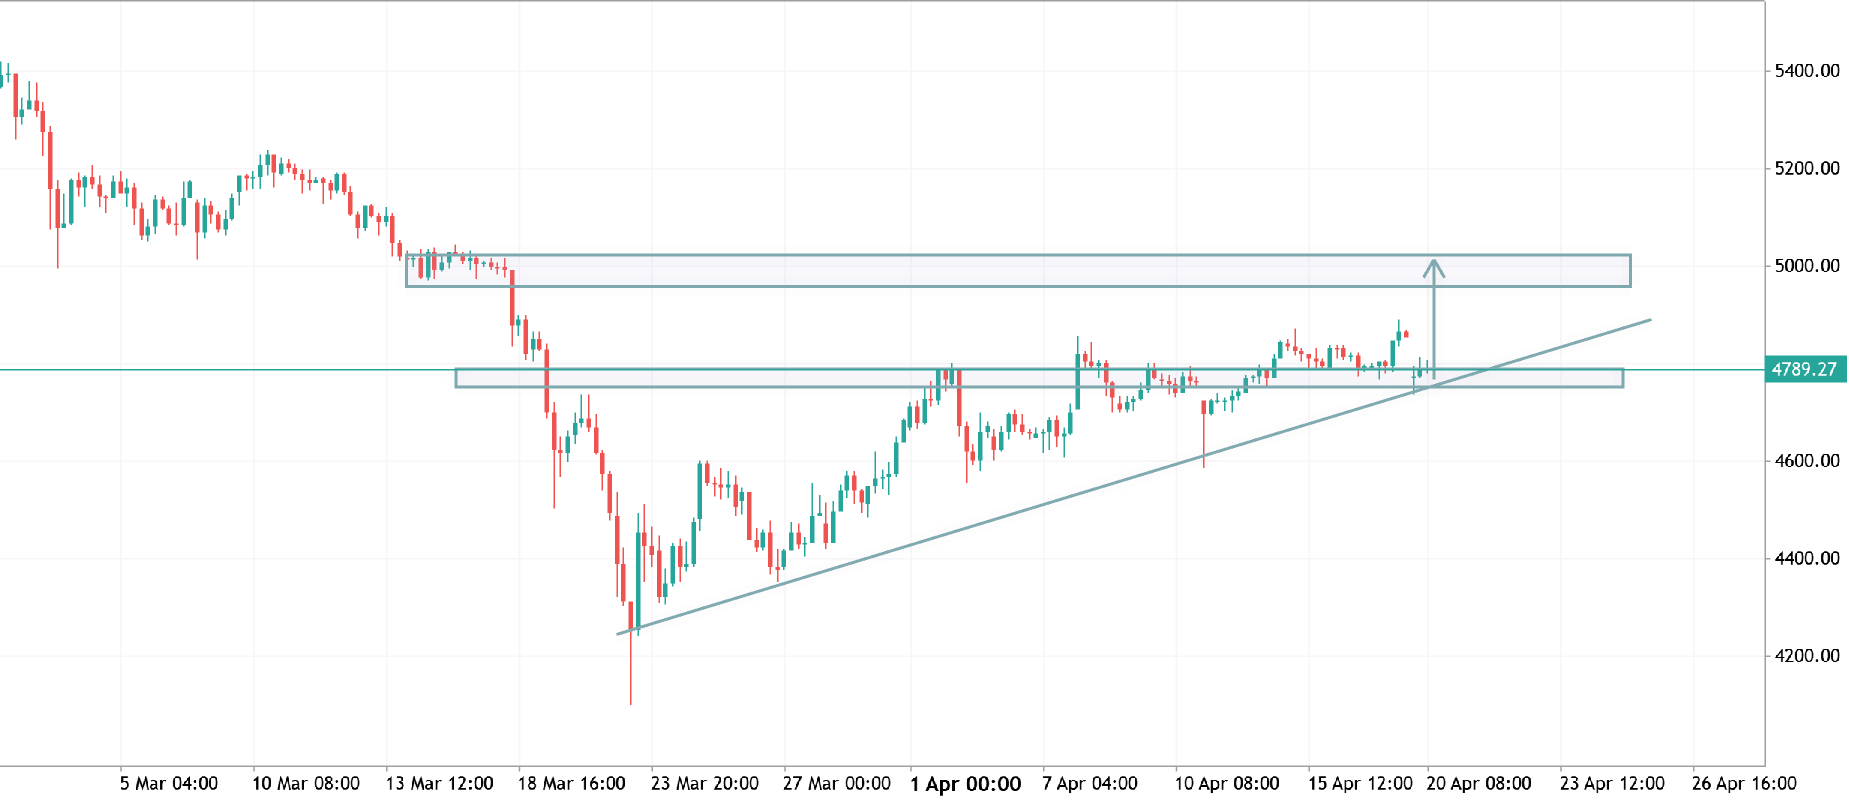
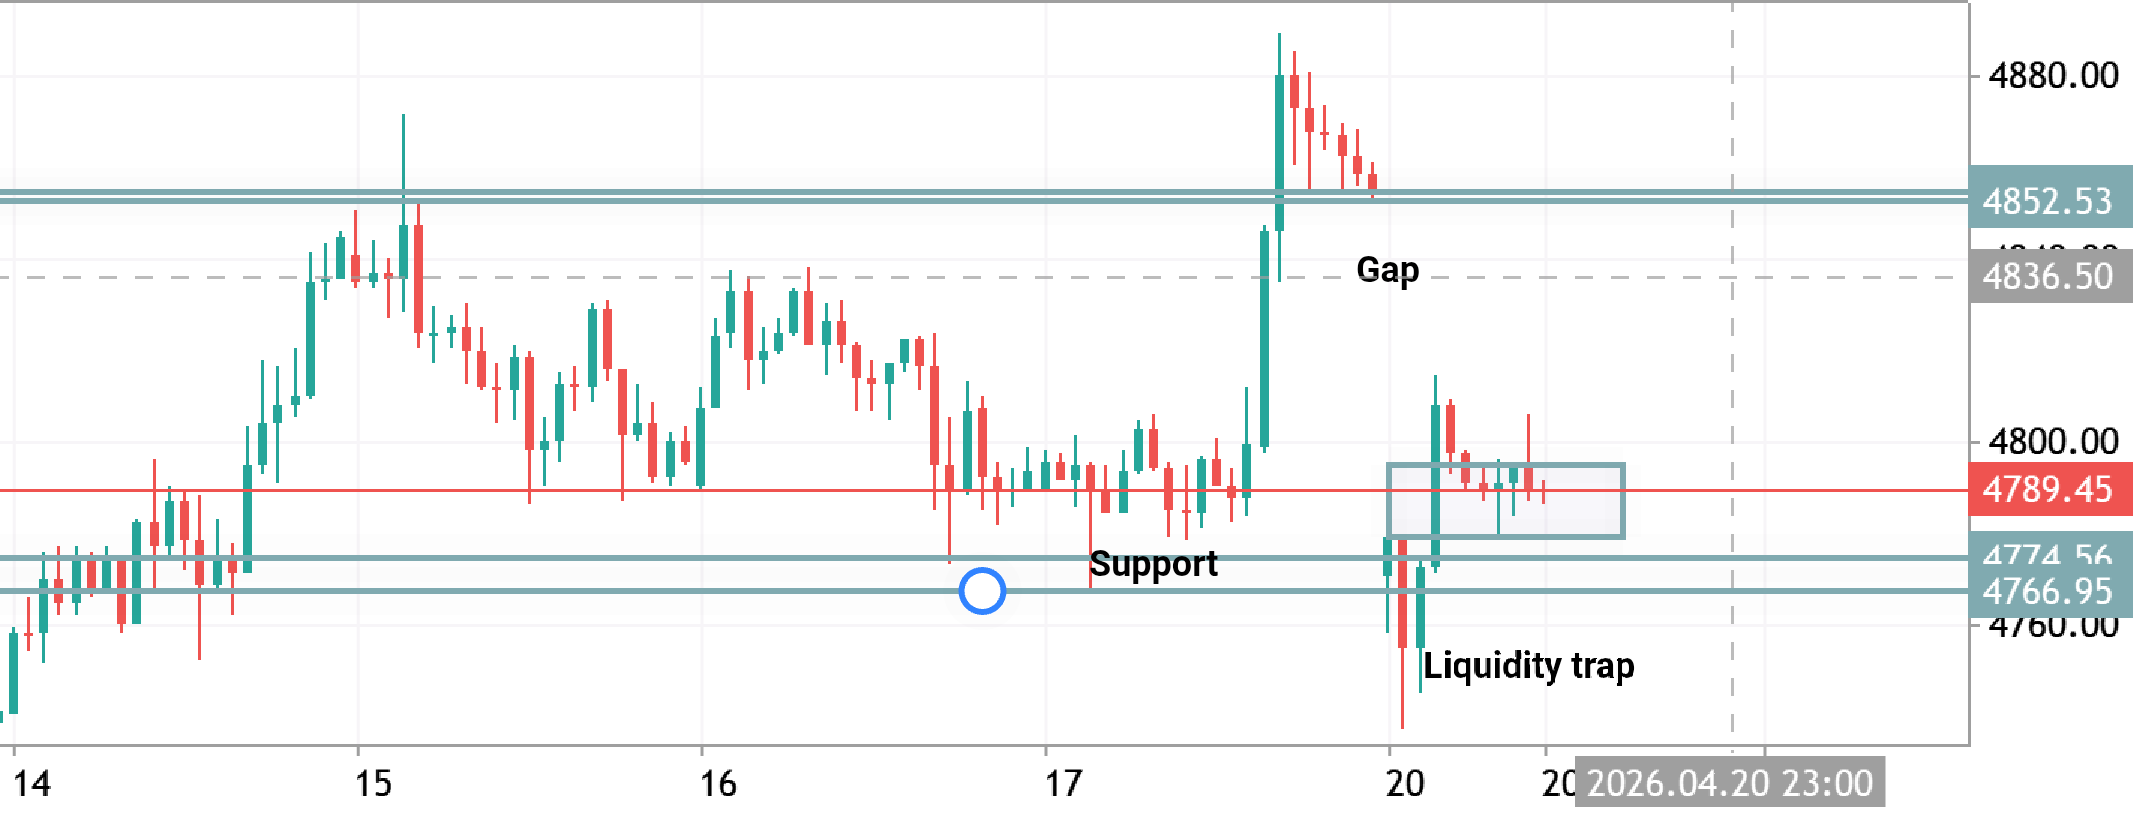
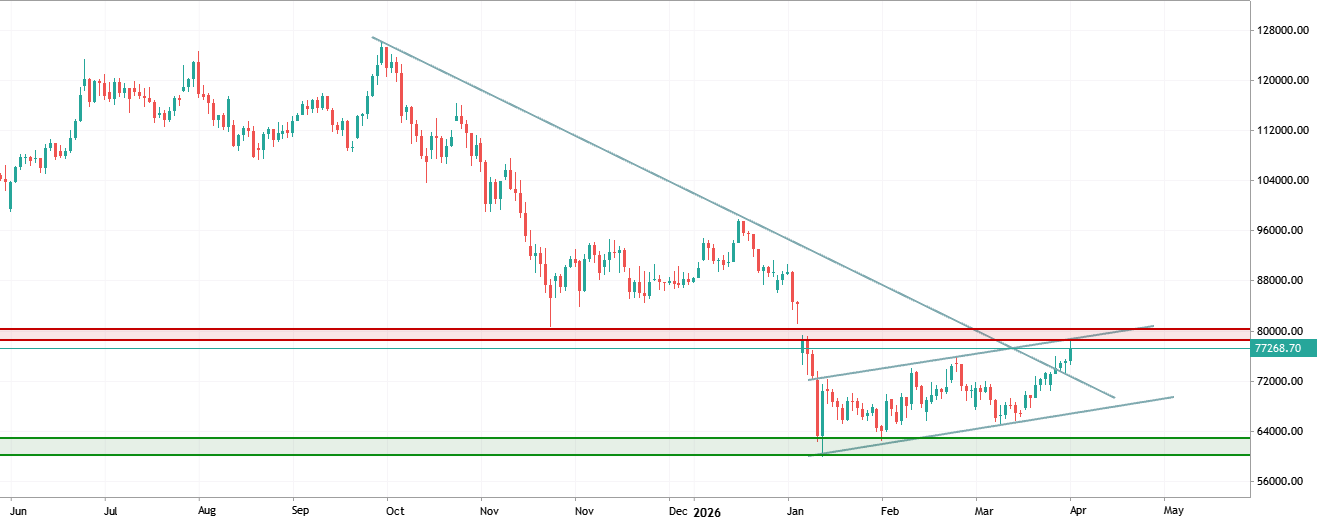
BTCUSD H1 Analysis BTCUSD is holding above a key demand zone after a strong rebound from recent lows. Price is attempting to break higher, with the 64.8k–65.1k resistance area acting as the next major target. A sustained move above this zone could accelerate bullish momentum. Bias: Bullish Key Support: 63,200 – 63,000 Key Resistance: 64,800 – 65,100 Wait for confirmation before entry and always use proper risk management.
GBPUSD H4 ANALYSIS GBPUSD Pound Sterling vs US Dollar

GBPUSD H4 ANALYSIS

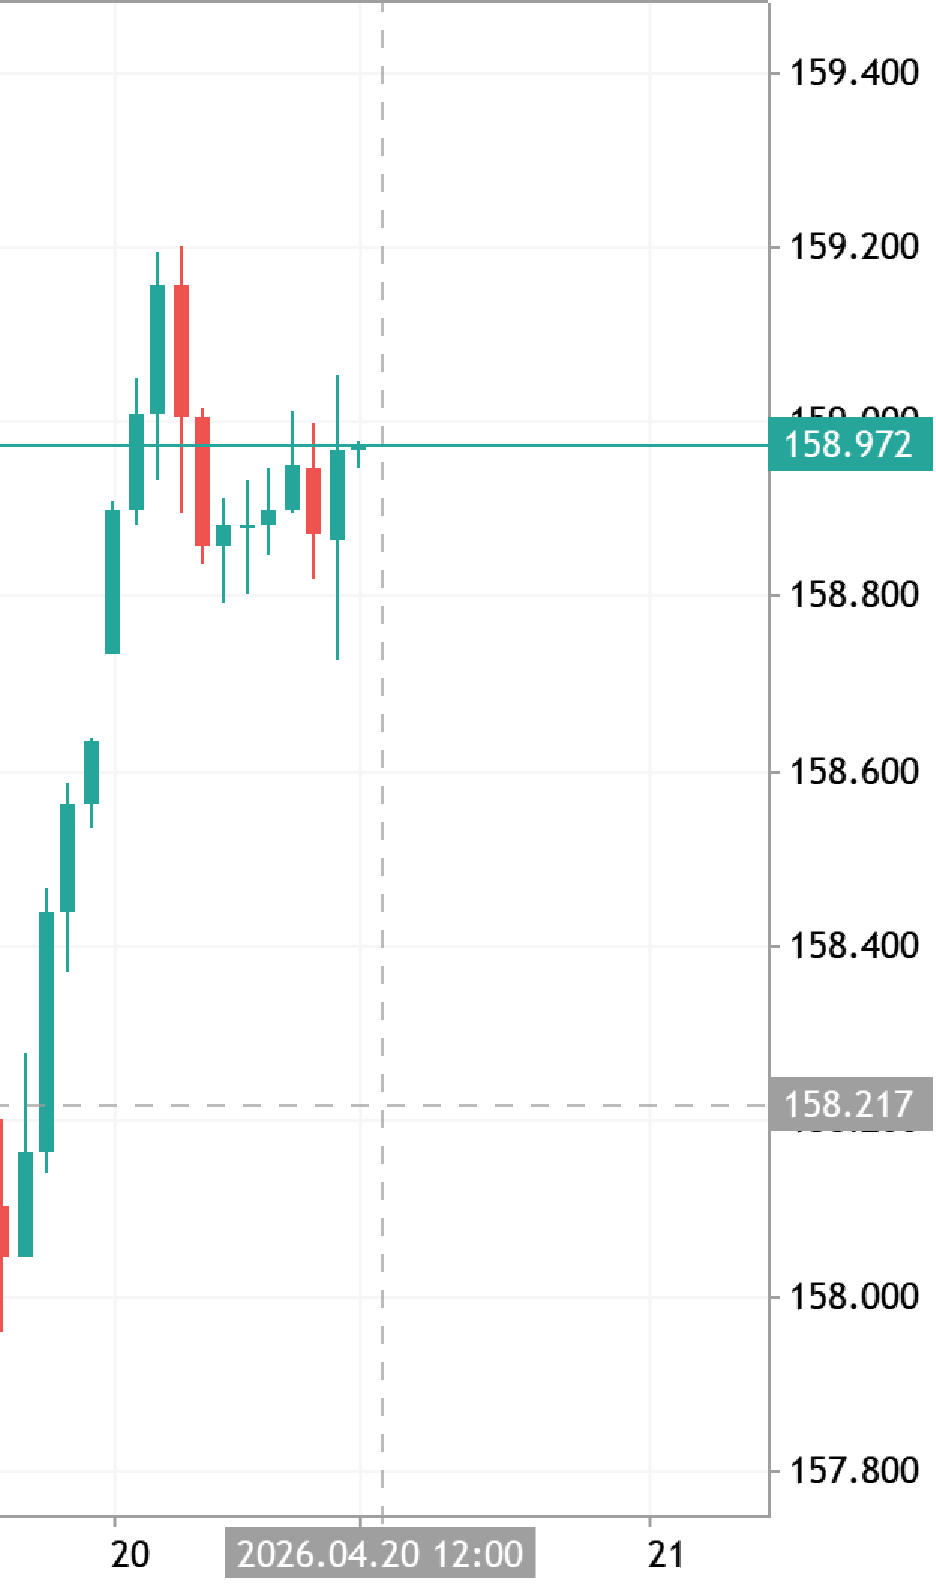
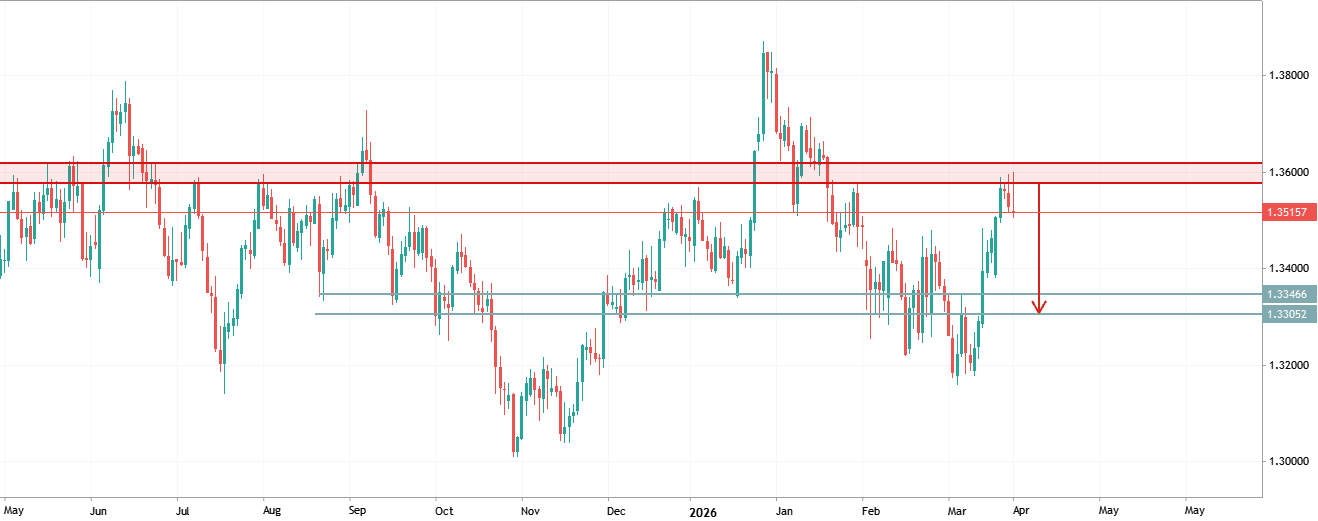
GBP/USD – Technical Outlook (H4) Price is reacting around the 0.382 Fibonacci retracement, showing hesitation after a strong bullish recovery. A sustained break above 1.3480–1.3510 could confirm bullish continuation toward higher resistance. However, rejection from the current zone may trigger a pullback to 1.3380 and 1.3330 support before the next move. Bias: Neutral to Bullish Key Levels: Resistance: 1.3480 / 1.3510 | Support: 1.3380 / 1.3330 Trade with proper risk management and wait for confirmation before entering.
EURUSD H4 ANALYSIS EURUSD Euro vs US Dollar

EURUSD H4 ANALYSIS

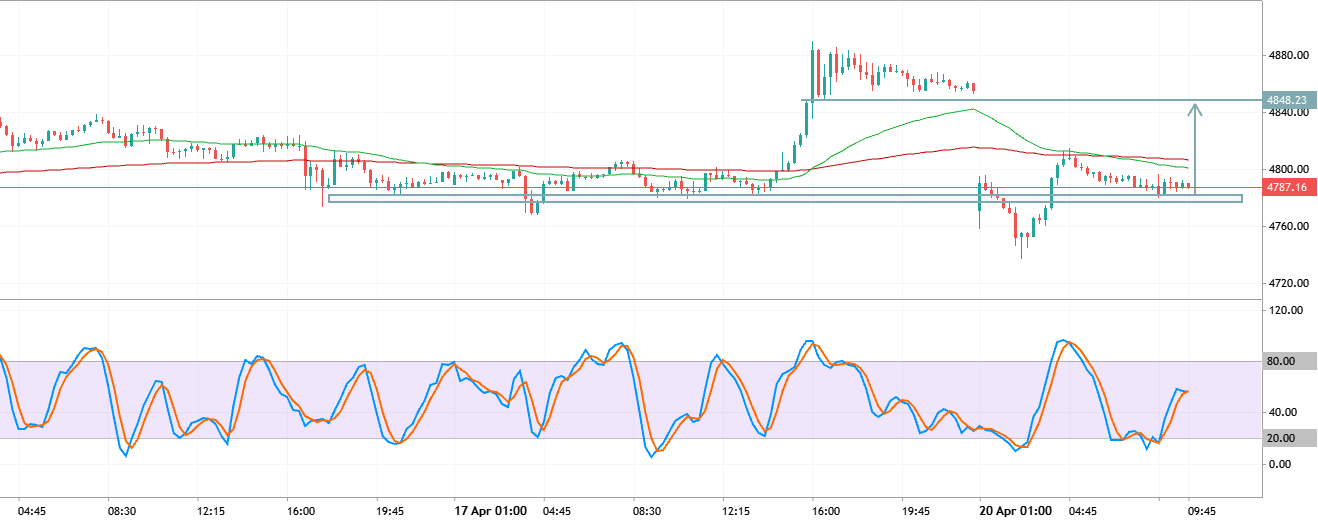
EURUSD Technical Analysis (H4) EURUSD remains in an overall bullish structure after a strong impulse move. Price is currently retesting the Fibonacci support zone, where buyers may regain control. 📈 Bullish Scenario: Holding above the 0.618–0.786 retracement could trigger another push toward the 1.1550–1.1600 resistance area. 📉 Bearish Scenario: A confirmed break below the support zone may lead to a deeper correction before the next bullish leg. Trade Smart: Wait for price confirmation before entering. Risk management is essential. #EURUSD #Forex #TechnicalAnalysis #PriceAction #MQL5
XAUUSD TRADE IDEA XAUUSD Long Gold vs US Dollar

XAUUSD TRADE IDEA

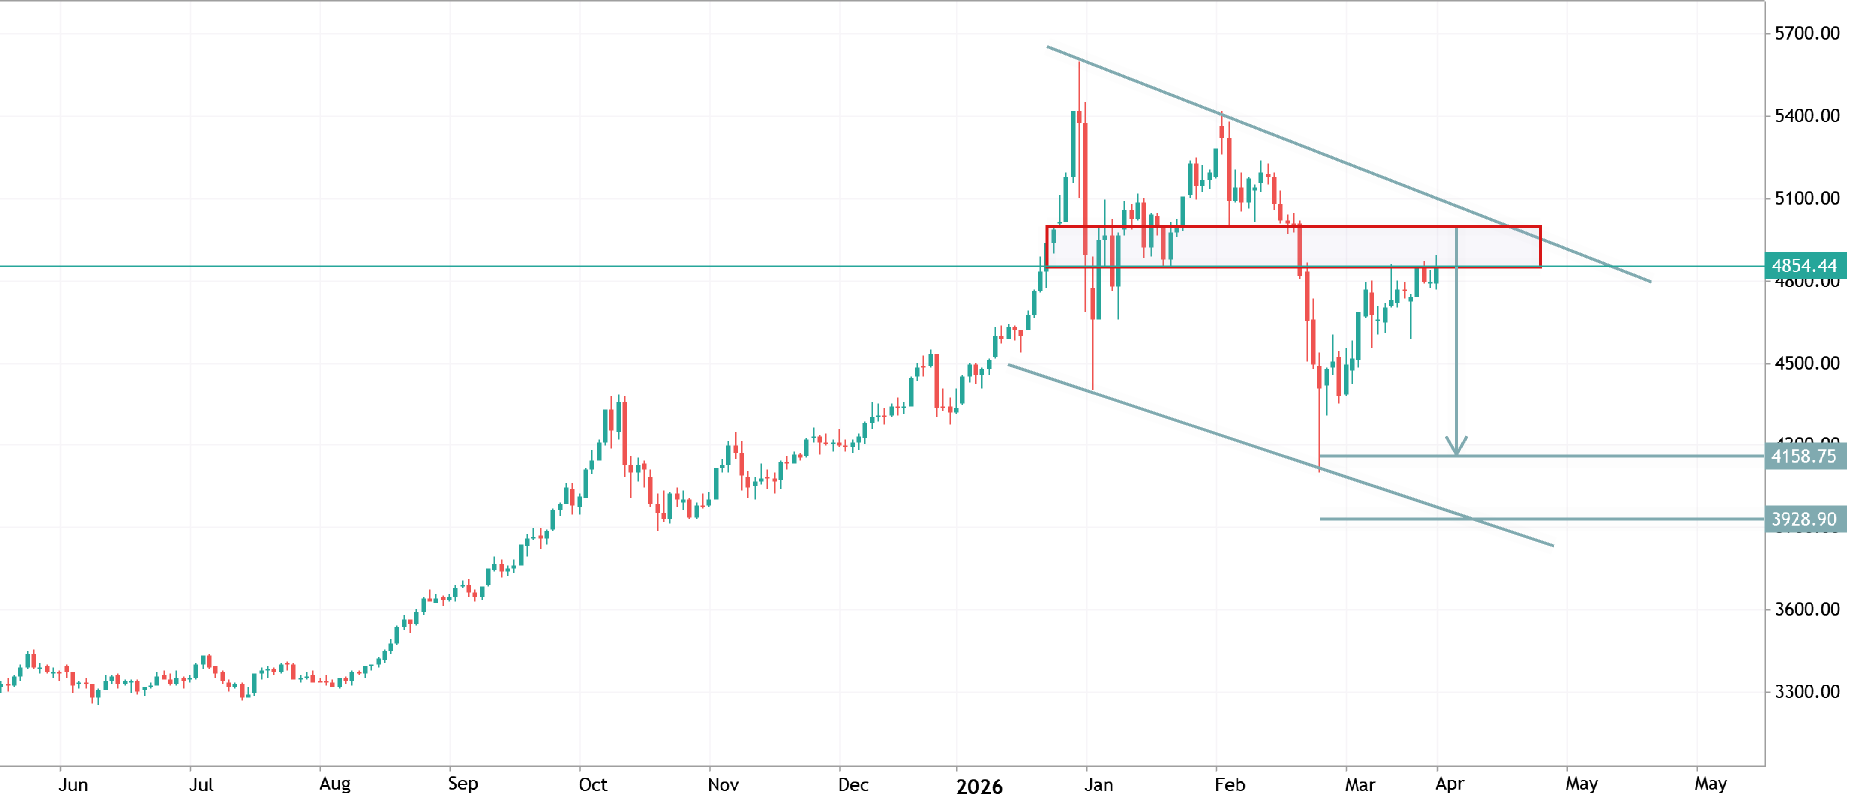
XAUUSD (H4 Bias: Bearish below 4072 Market Structure: Price is consolidating below a major resistance zone after failing to sustain higher highs. The ascending trendline is being tested. Resistance: 4072–4126 Support: 4053 , then 4038 , followed by 3959 Short Setup Entry: 4068–4072 (after bearish rejection/confirmation) Stop Loss: Above 4126 Take Profit 1: 4053 Take Profit 2: 4038 Take Profit 3: 3959 Summary: The H4 chart remains neutral-to-bearish while price trades below 4072 . A rejection from the resistance zone favors a move toward 4053 , 4038 , and potentially 3959 . A confirmed breakout and close above 4126 would invalidate the short setup and shift the bias to bullish.
Today analysis short idea to sell from 4070 - 4073 XAUUSD Short Gold vs US Dollar

Today analysis short idea to sell from 4070 - 4073

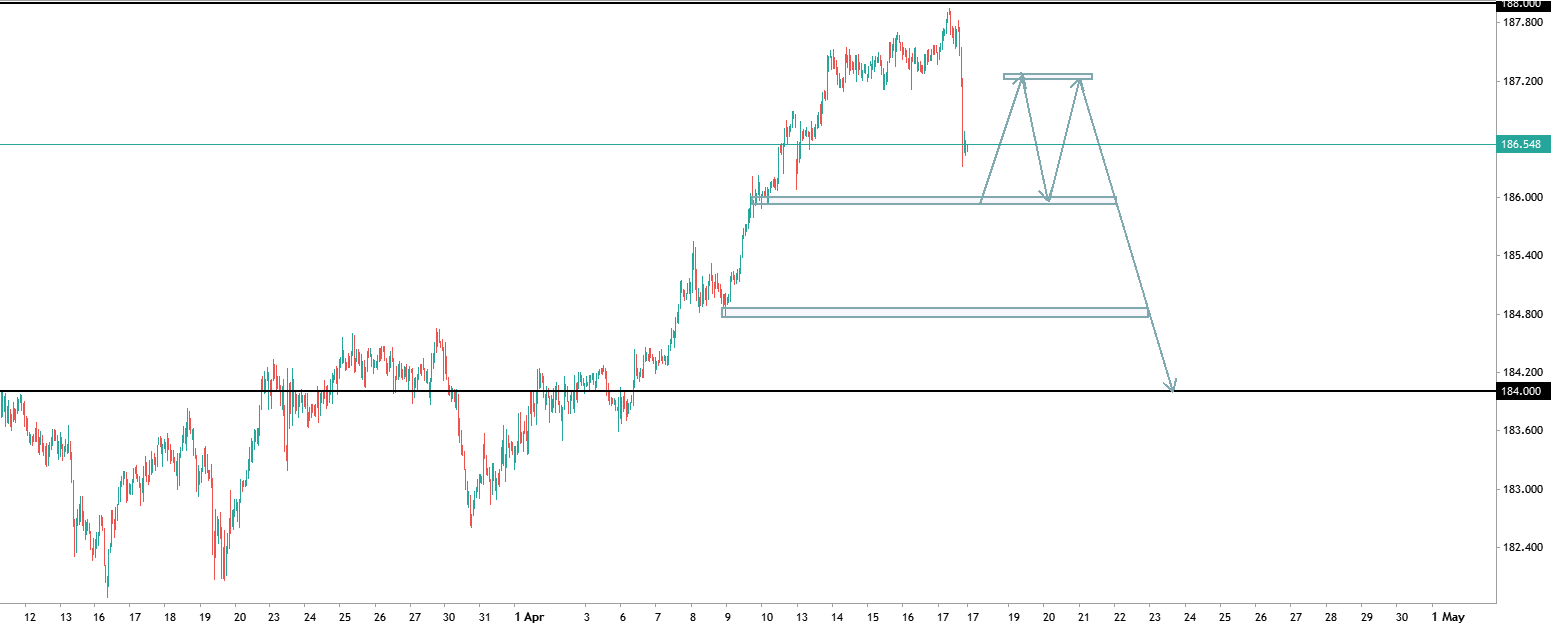
🔴 XAU/USD (Gold) Sell Signal Entry Zone: 4070 – 4073 Stop Loss: 4080 Take Profit 1: 4030 Take Profit 2: 4010 📉 Gold is approaching a key resistance zone, presenting a potential selling opportunity. The first target is set at 4030, with an extended target of 4010. If bearish momentum strengthens, Gold could continue to decline beyond the second target. Consider securing partial profits at TP1 and allowing the remaining position to run toward TP2 while adjusting your stop loss according to your risk management plan. Risk Disclaimer: Trading forex and commodities involves substantial risk. Always use proper risk management and never risk more than you can afford to lose.
XAUUSD (Gold) Bullish Setup: Golden Pocket Bounce & Market Structure Shift XAUUSD Long Gold vs US Dollar

XAUUSD (Gold) Bullish Setup: Golden Pocket Bounce & Market Structure Shift

Trade Signal: LONG (BUY) Asset: XAUUSD (Gold - M15) Entry Zone: 4052.00 – 4058.00 Stop Loss (SL): 4045.00 (Below recent swing low / 1.0 Fib level) Take Profit 1 (TP1): 4080.00 (Recent local high) Take Profit 2 (TP2): 4090.00 (Key resistance level / Liquidity pool) Key Technical Reasons Fibonacci Golden Level Retracement: Price cleanly retested the 0.618–0.786 Fibonacci retracement zone (~4056.70 – 4052.44), showing strong buyer absorption at the golden pocket. Major Support Retest: The entry area aligns with a key horizontal support level, acting as strong confluence for a higher-low formation. Market Structure Shift (MSS): Lower-timeframe (M15) price action shows a transition from a bearish pullback to higher highs and higher lows, confirming a shift in momentum to the upside. ⚠️