xauusd h1 analysis XAUUSD Gold vs US Dollar

xauusd h1 analysis

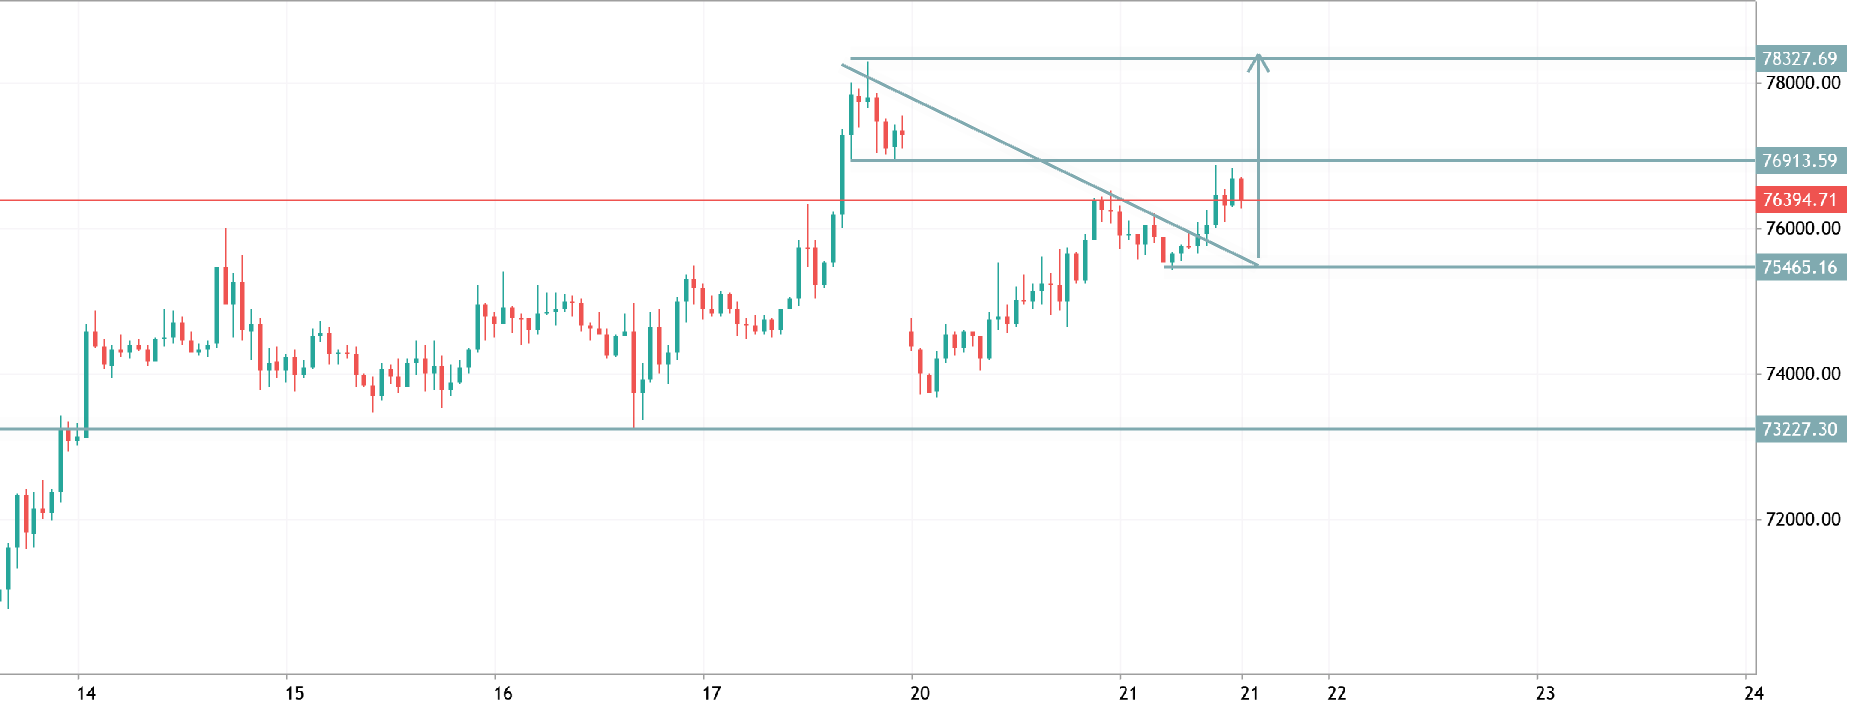
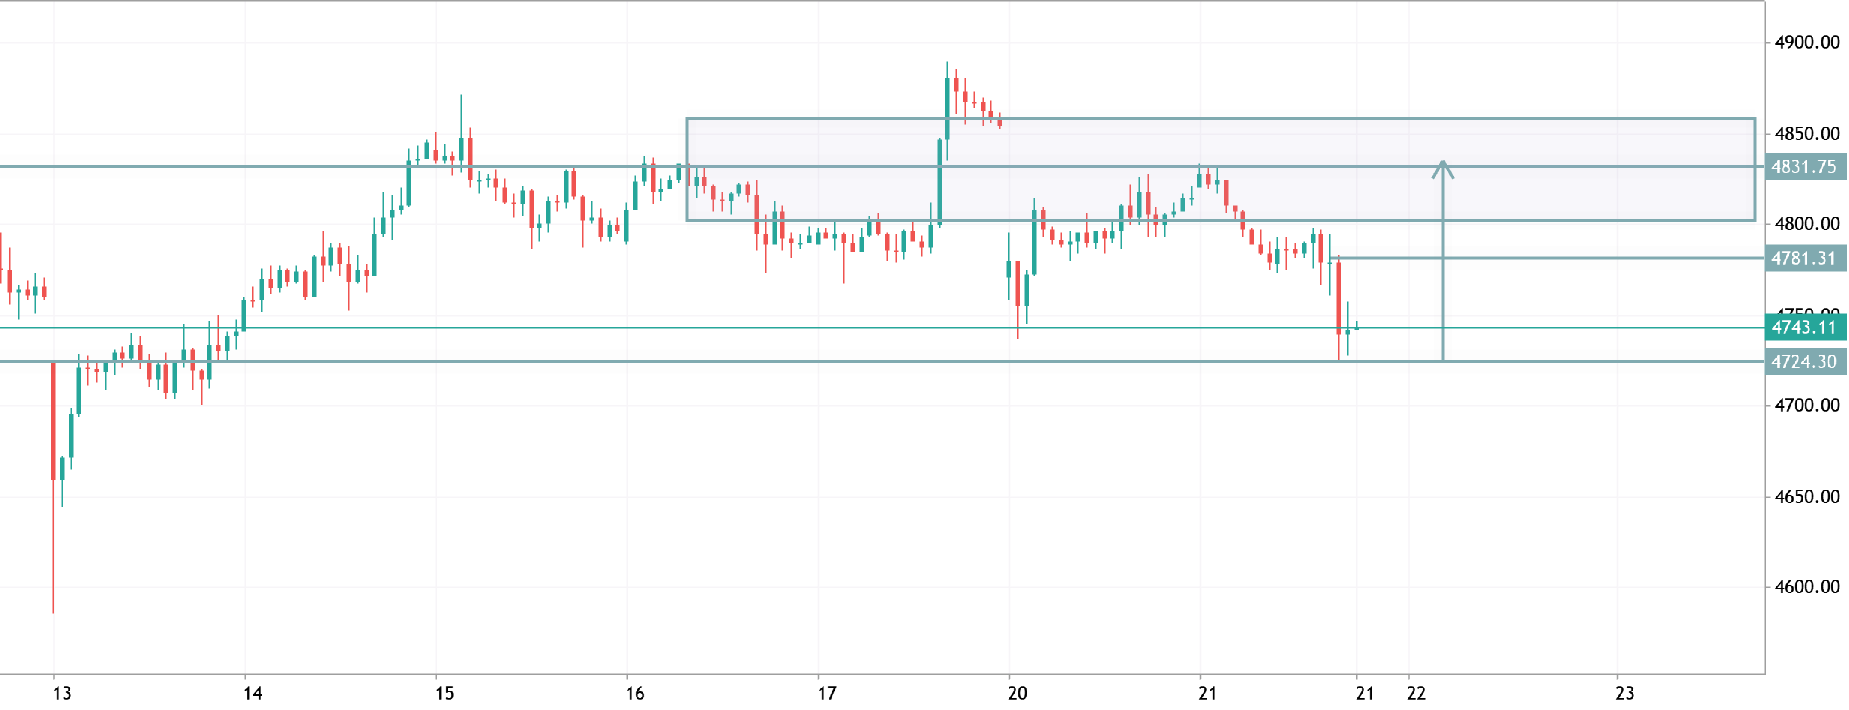
XAUUSD H1 Analysis Price is ranging between strong support at 4724–4743 and resistance around 4830–4850. Recent rejection from support shows buying interest, with a potential move toward the upper range. As long as price holds above 4720, bullish momentum can push toward 4830+. A break above resistance may trigger further upside, while a drop below 4720 will invalidate the bullish outlook and expose lower levels. Bias: Short-term bullish within range

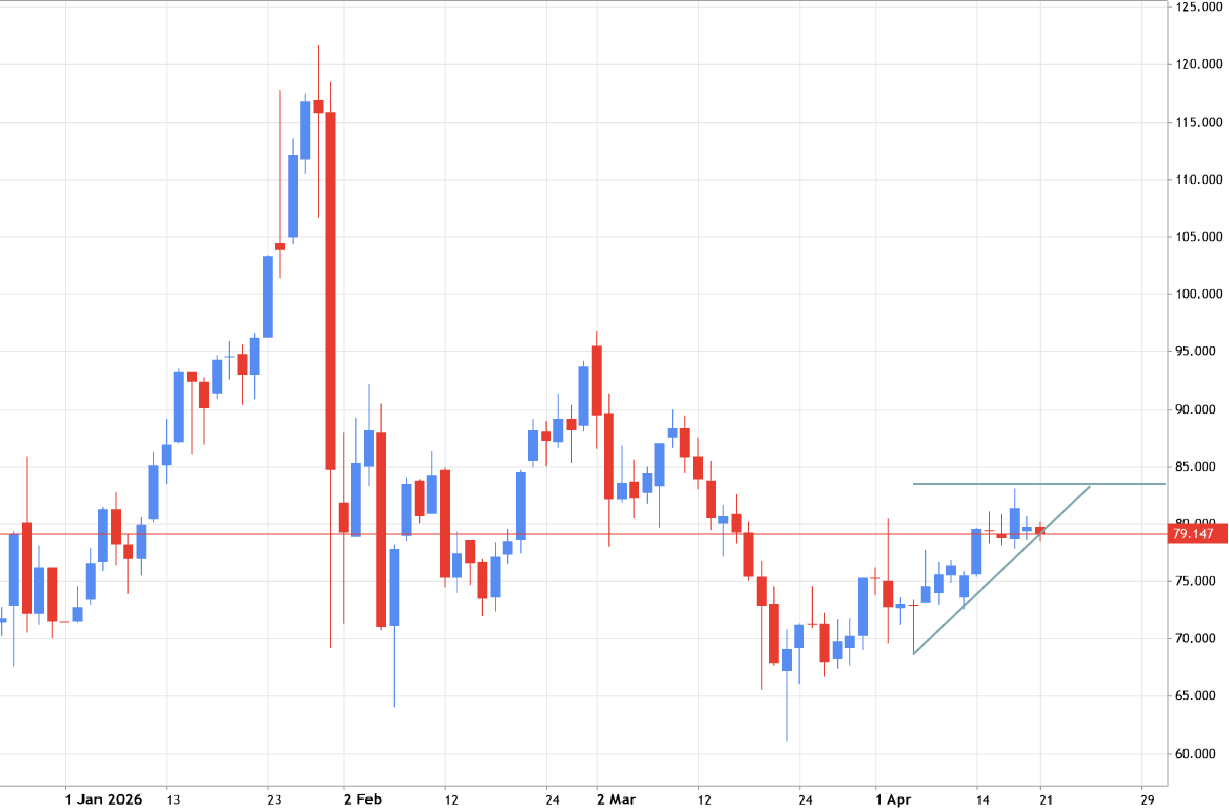
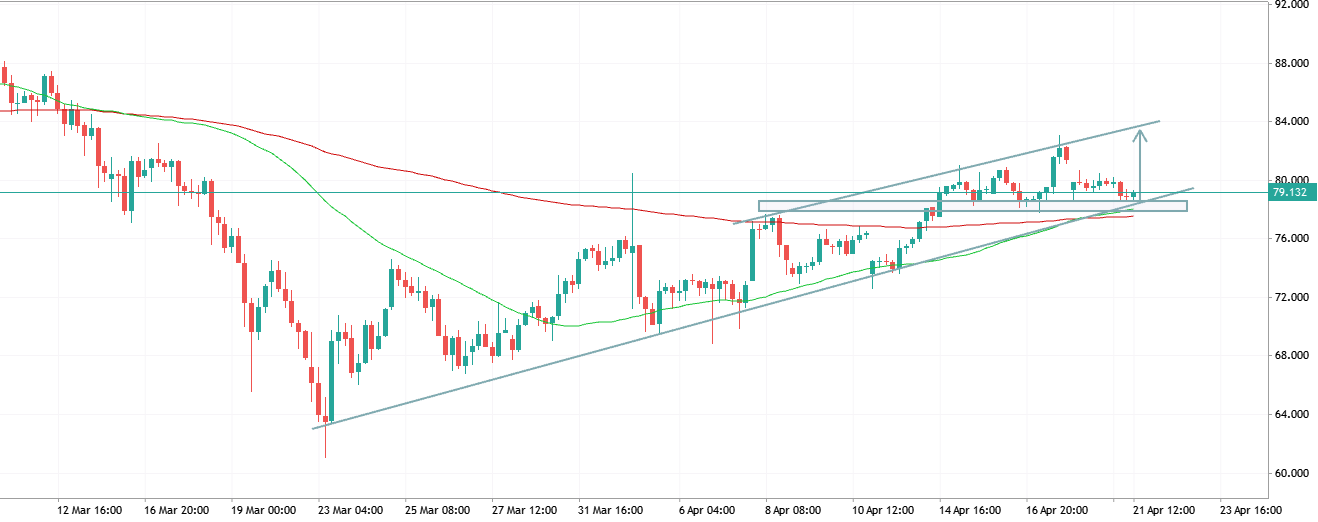
XAGUSD Ascending Structure – Continuation Expected XAGUSD Silver vs US Dollar

XAGUSD Ascending Structure – Continuation Expected

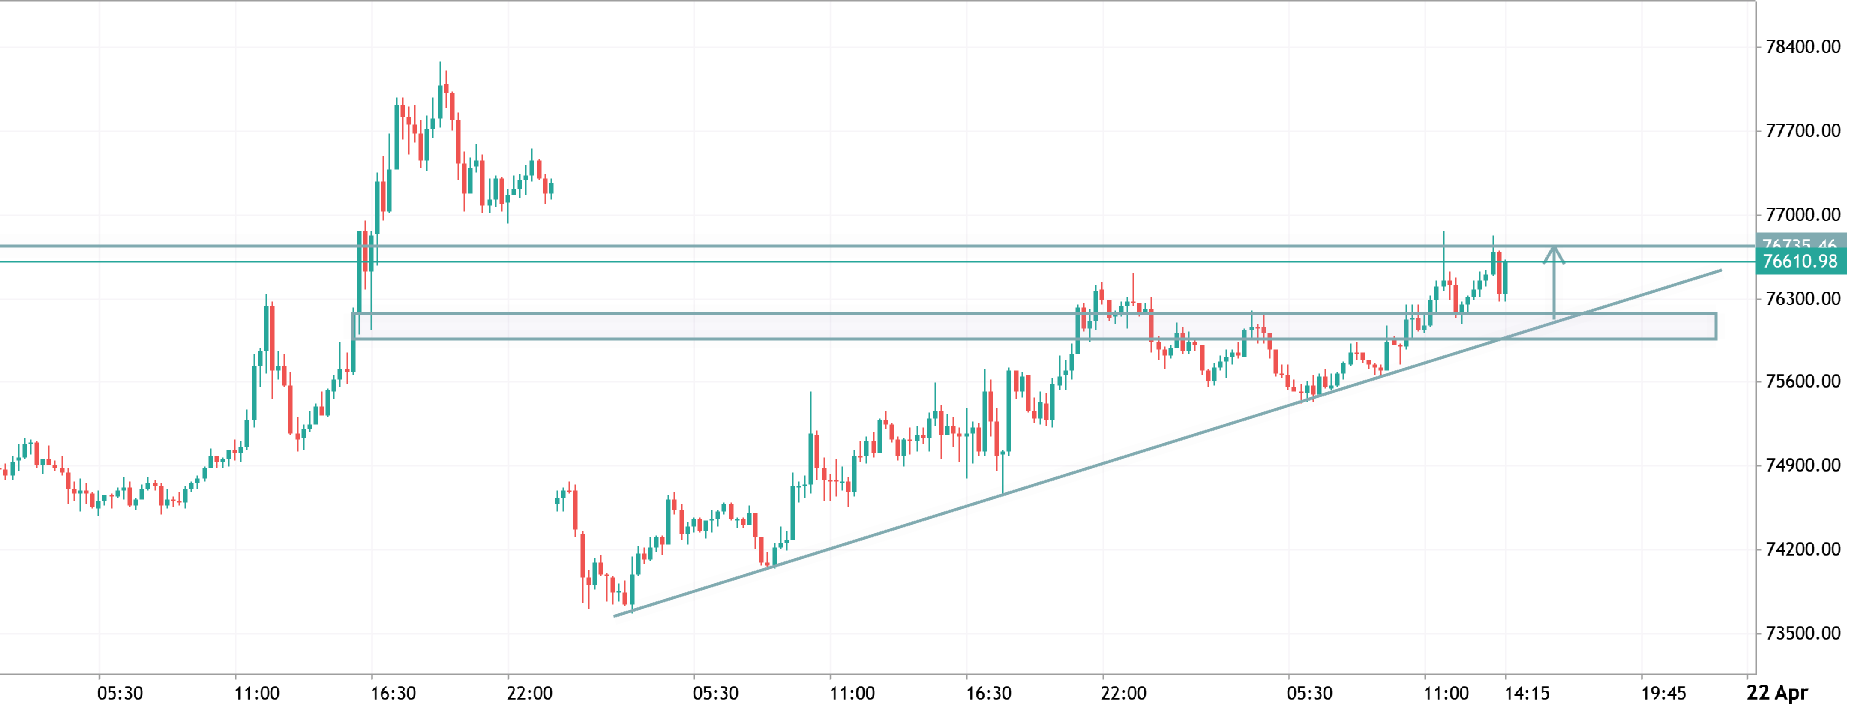
Price is moving in an ascending channel, showing a clear bullish structure with higher highs and higher lows. Currently, the market is consolidating near a key support zone after a strong push up. The trend remains bullish as long as price holds above the highlighted support area and the trendline. A continuation move is expected if momentum builds, targeting the upper resistance zone. However, a breakdown below support could shift short-term sentiment bearish and lead to a deeper pullback. Bias: Bullish continuation above support Key Zone: Support holding inside channel Scenario: Breakout → further upside | Breakdown → correction
XAUUSD Triangle Consolidation – Breakout Incoming XAUUSD Gold vs US Dollar

XAUUSD Triangle Consolidation – Breakout Incoming

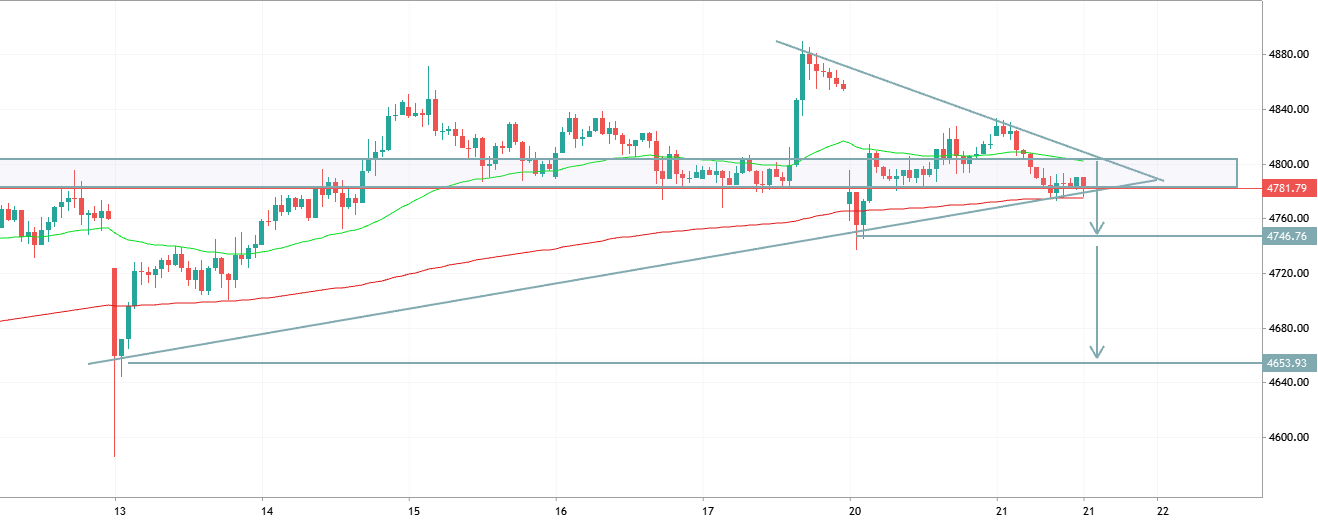
Gold is currently consolidating within a symmetrical triangle, showing compression after a ranging market phase. Price is respecting both descending resistance and ascending support, indicating a potential breakout setup. Market structure remains neutral-to-slightly bullish, but momentum is weakening near resistance. A liquidity zone is visible below the support area, suggesting possible downside sweep before any strong move. Overall, this is a decision zone — breakout or fakeout likely. Traders should watch for a clear move outside the triangle for confirmation of direction
gbp jpy intraday smart analysis GBPJPY Pound Sterling vs Yen

gbp jpy intraday smart analysis

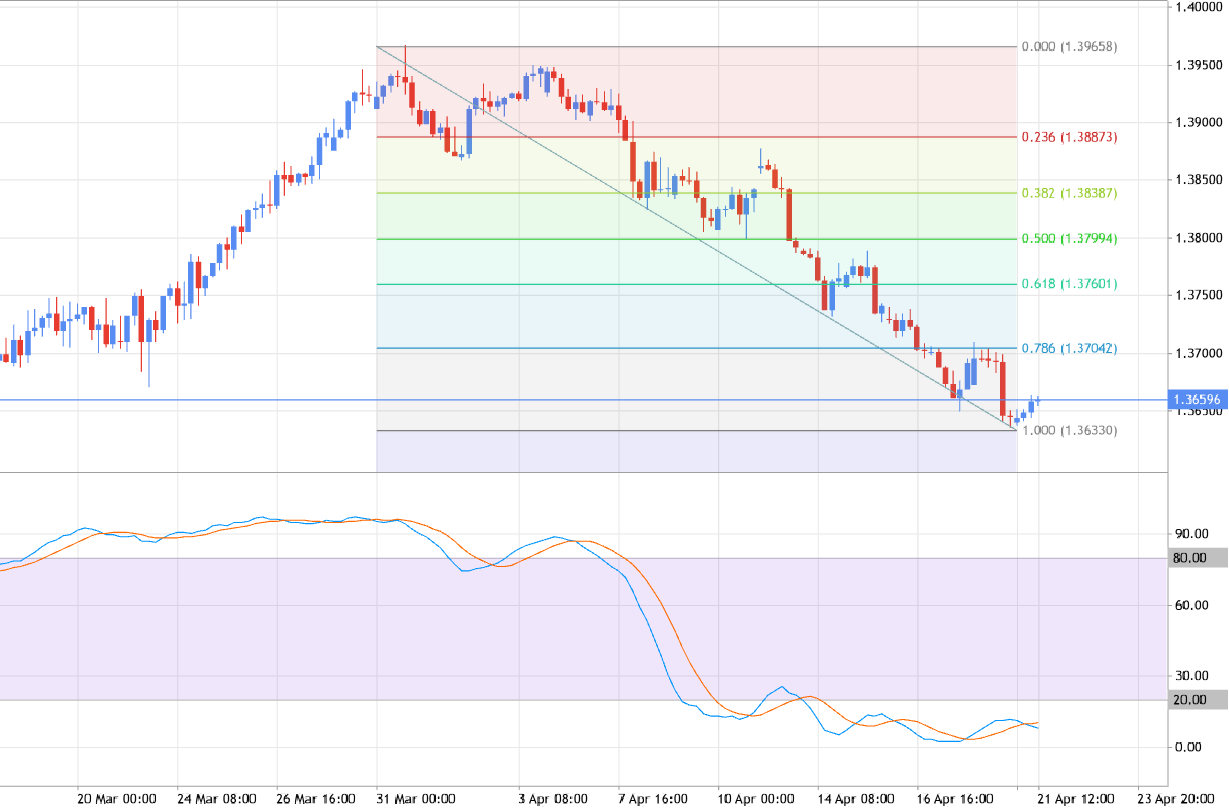
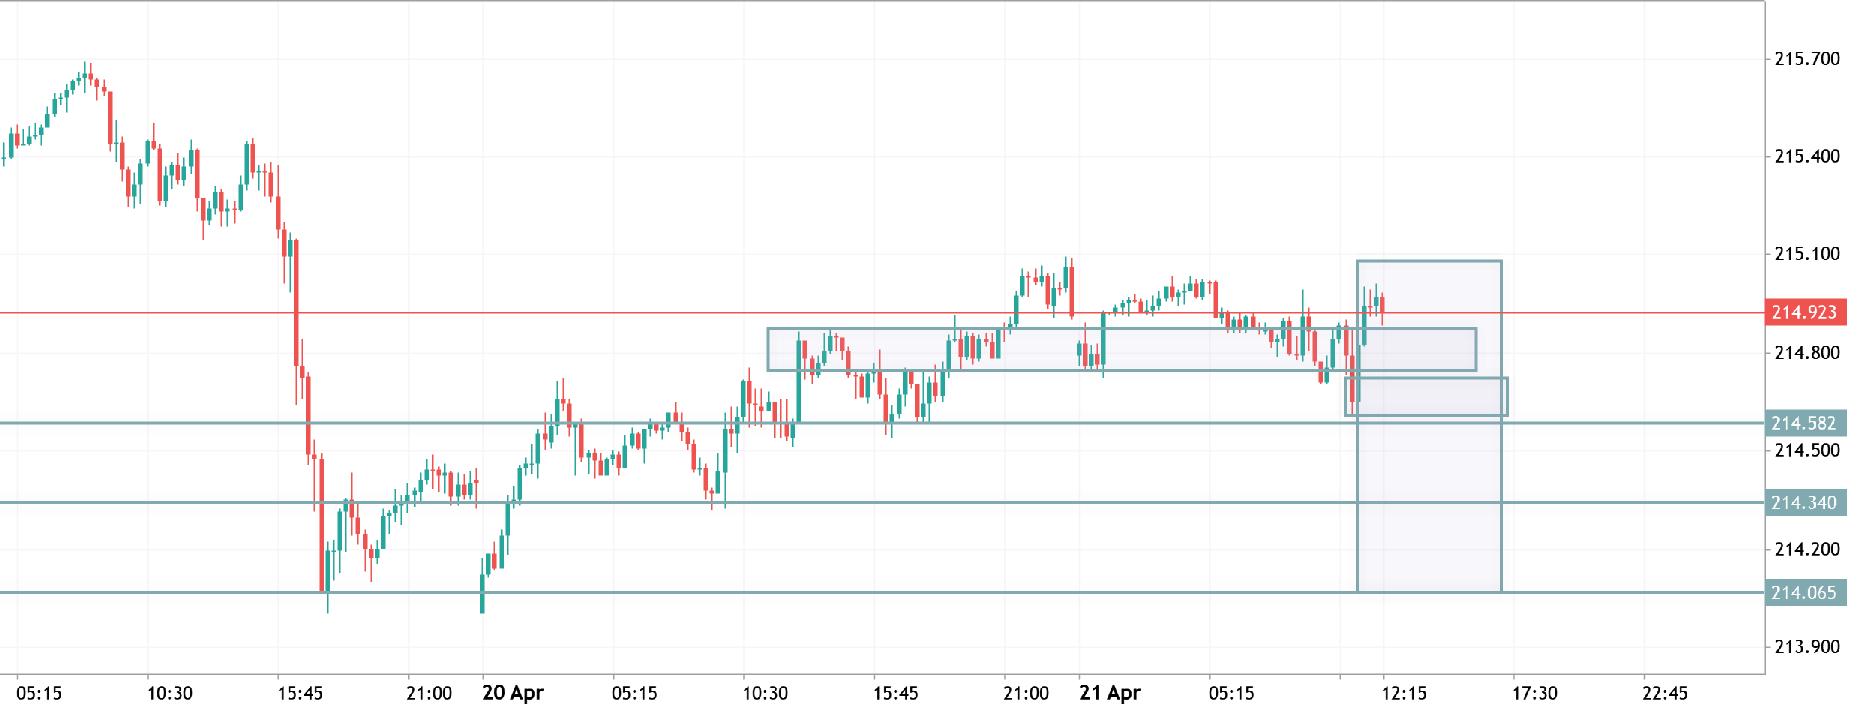
GBP JPY Intraday – Smart Analysis Price is moving inside a clear consolidation range after an impulsive move up. Multiple rejections from resistance show weakening bullish momentum. 🔹 Structure: Range-bound between support & resistance Liquidity building on both sides 🔻 Bearish Scenario: Break below range support → continuation toward lower demand zone Recent fake breakout suggests downside liquidity grab 🔸 Bullish Scenario: Clean breakout + hold above resistance → continuation of uptrend 📌 Conclusion: Currently in accumulation/distribution phase — wait for confirmed breakout. Short bias below support, bullish only on strong breakout and retest