MRNA - Long-Term Technical Forecast MRNA Moderna, Inc. - Common Stock

MRNA - Long-Term Technical Forecast

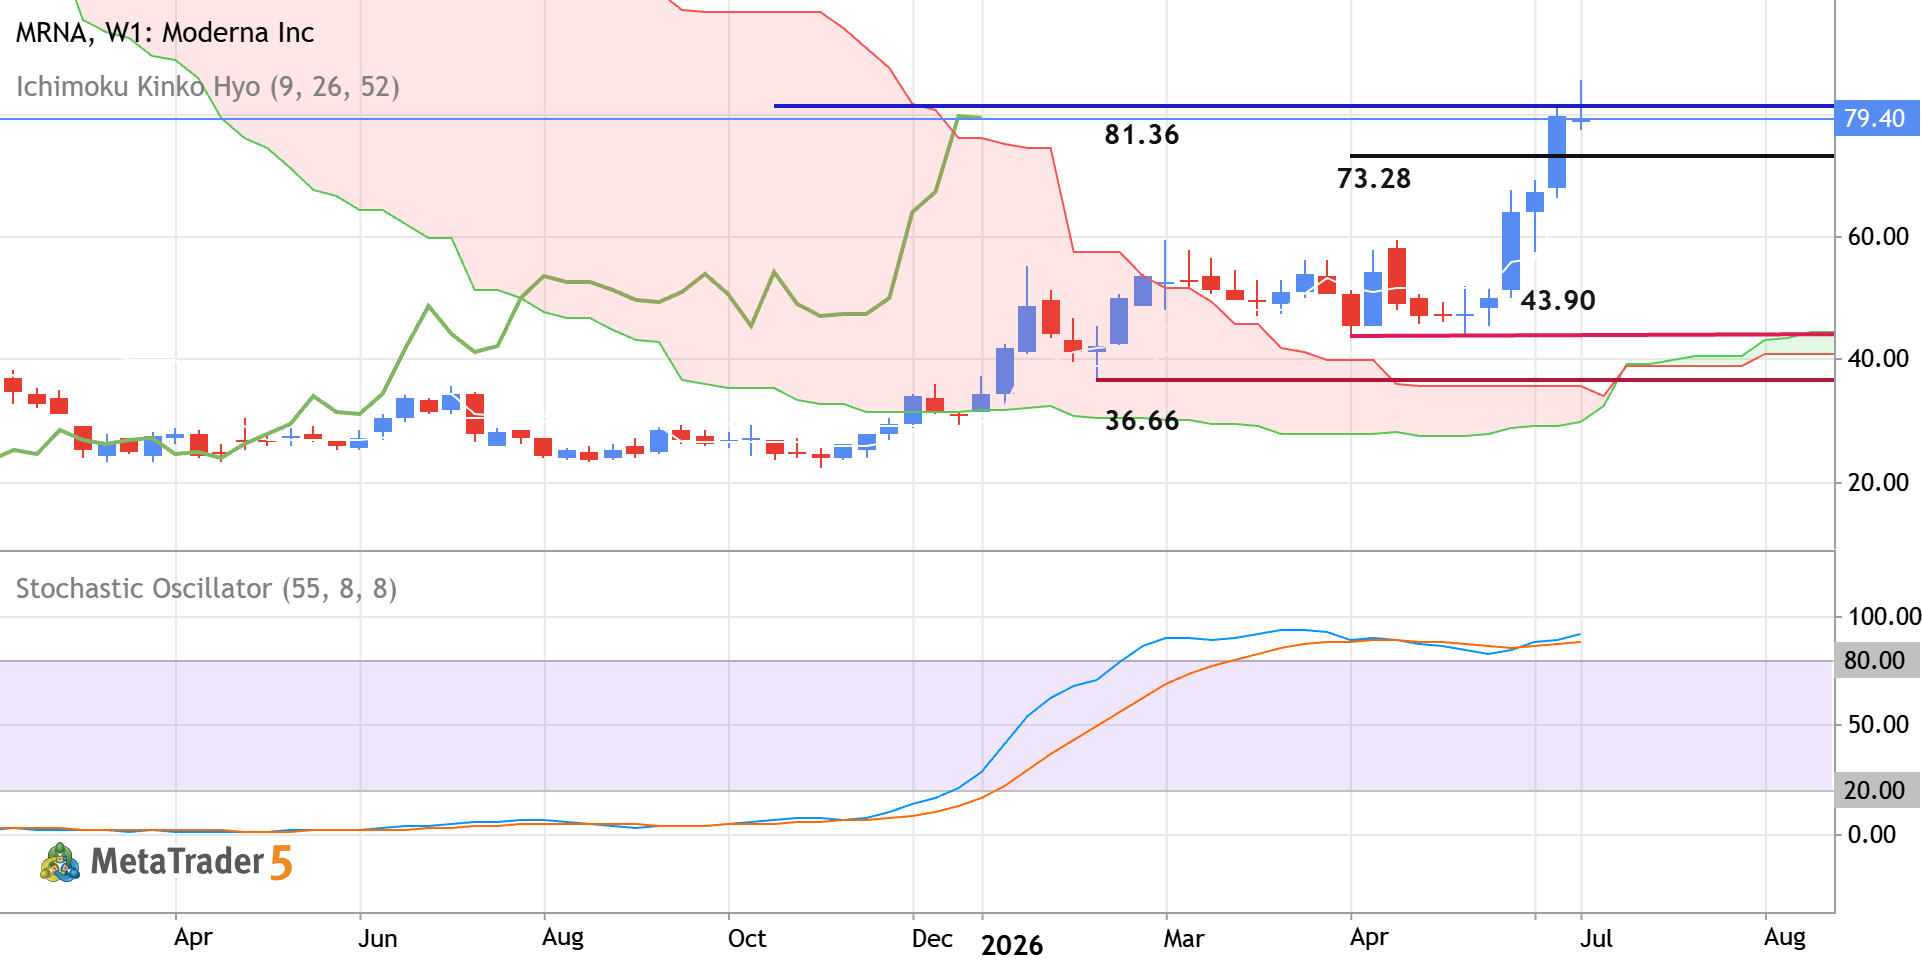
Weekly price is located above Ichimoku cloud in the bullish area of the chart for trying to cross the level at 81.36 to above for the strong bullish trend to be continuing. The price is on strong bullish breakout which is confirmed by Stochastic oscillator and Chinkou Span line. If the price breaks the 81.36 level to above on weekly close bar so the strong bullish trend will be continuing. If the price crosses the level at 73.28 to below so the secondary correction will be started. If the price breaks the support level at 43.90 to 36.66 to be crossed on weekly close bar so we may see the primary bearish reversal to be started on this W1 timeframe for example. Alternatively, the price will be on ranging to be near and above Ichimoku cloud waiting for direction. Trading Summary : bullish

GBPUSD TRADE IDEA GBPUSD Short Pound Sterling vs US Dollar

GBPUSD TRADE IDEA

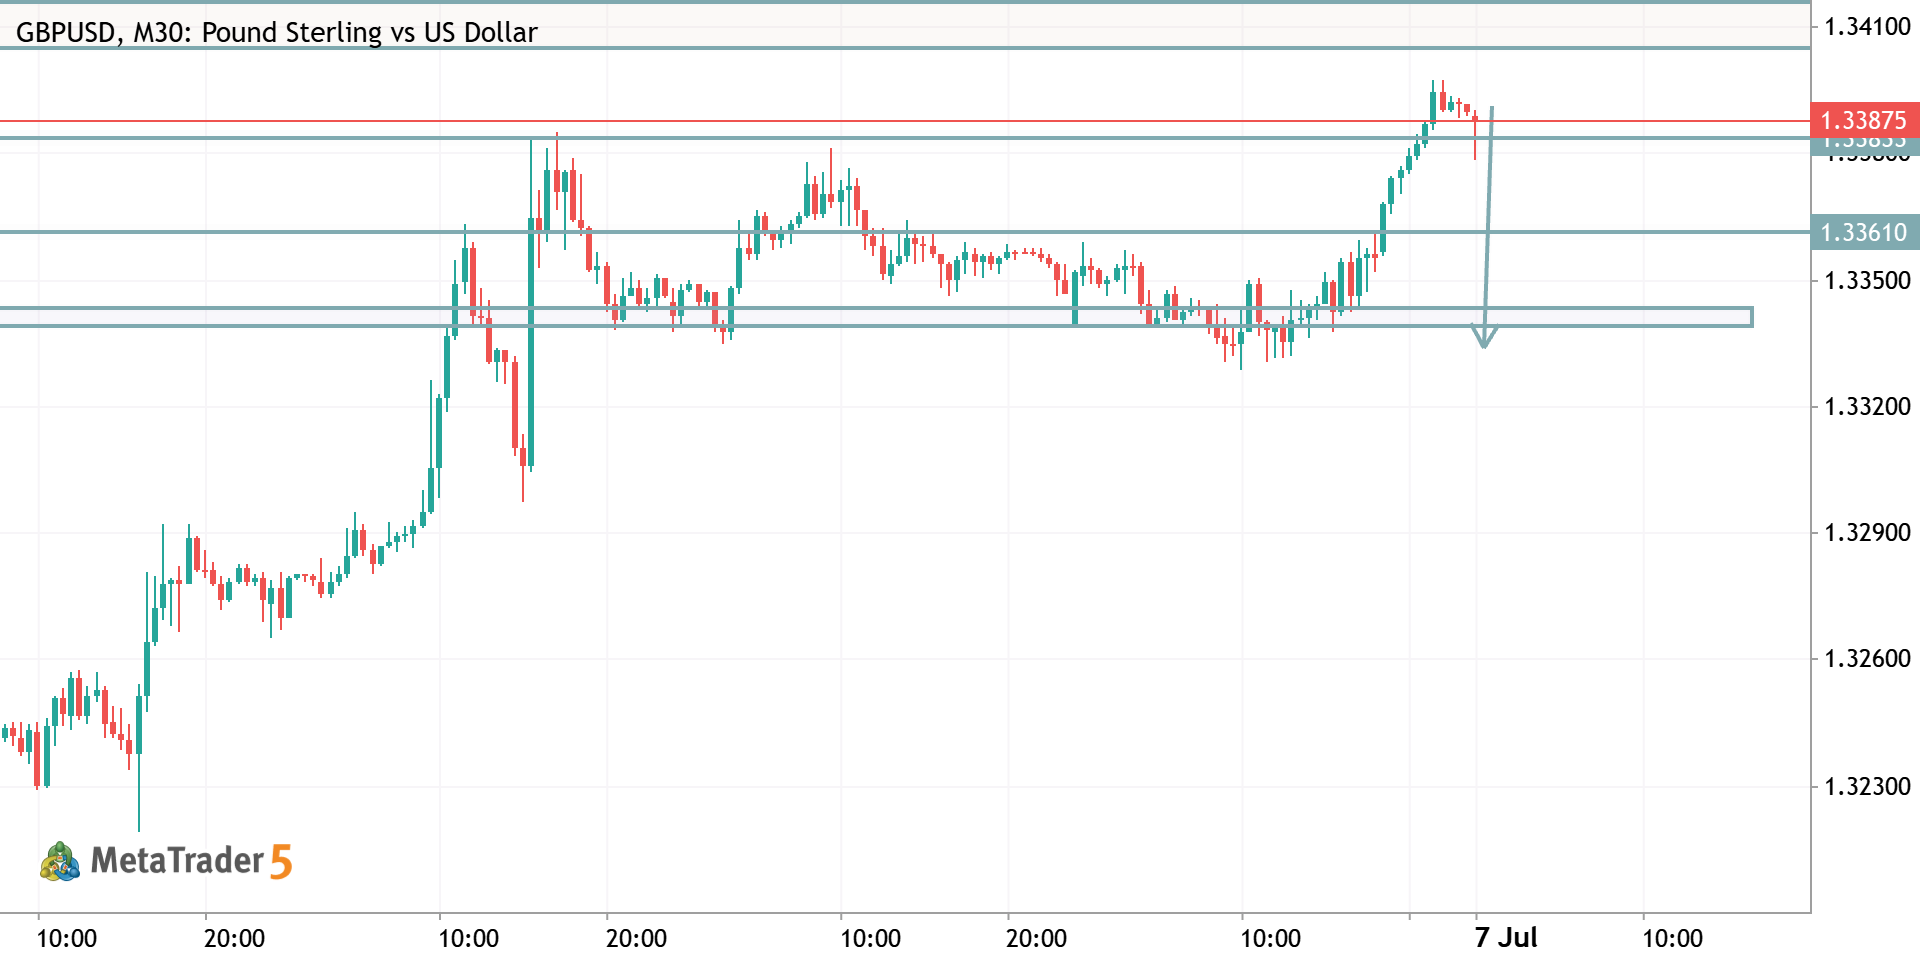
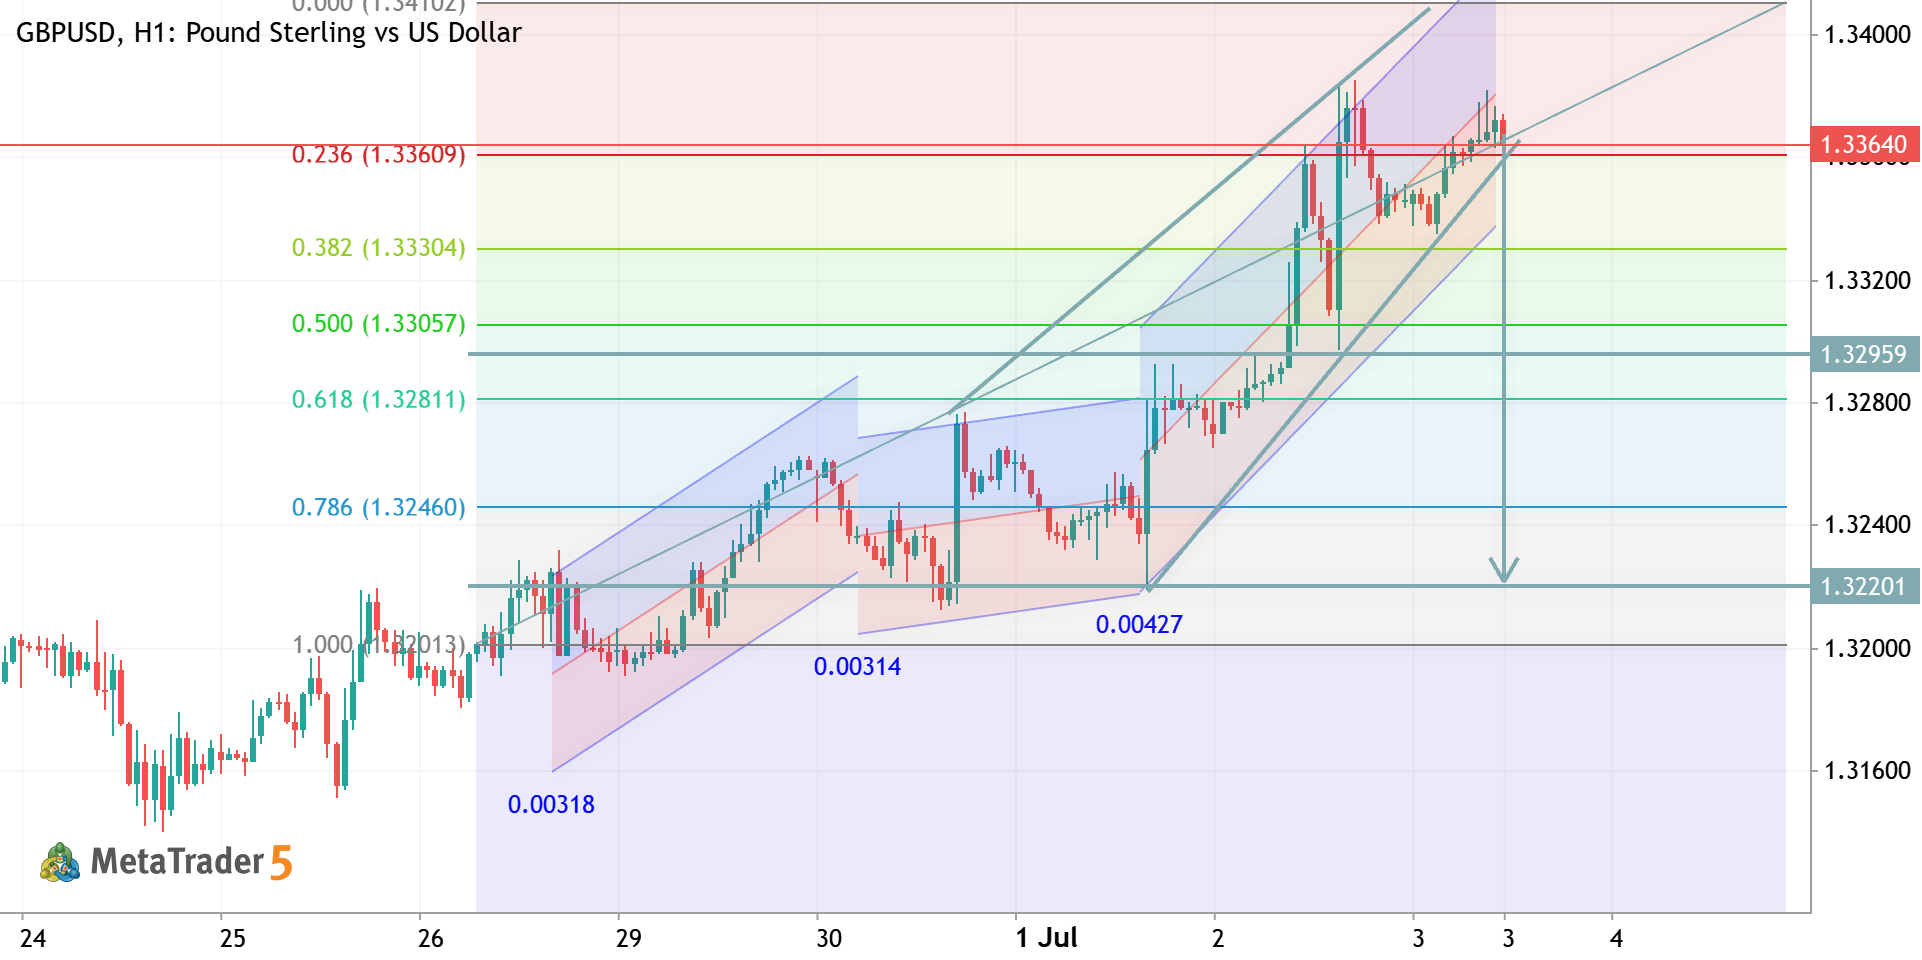
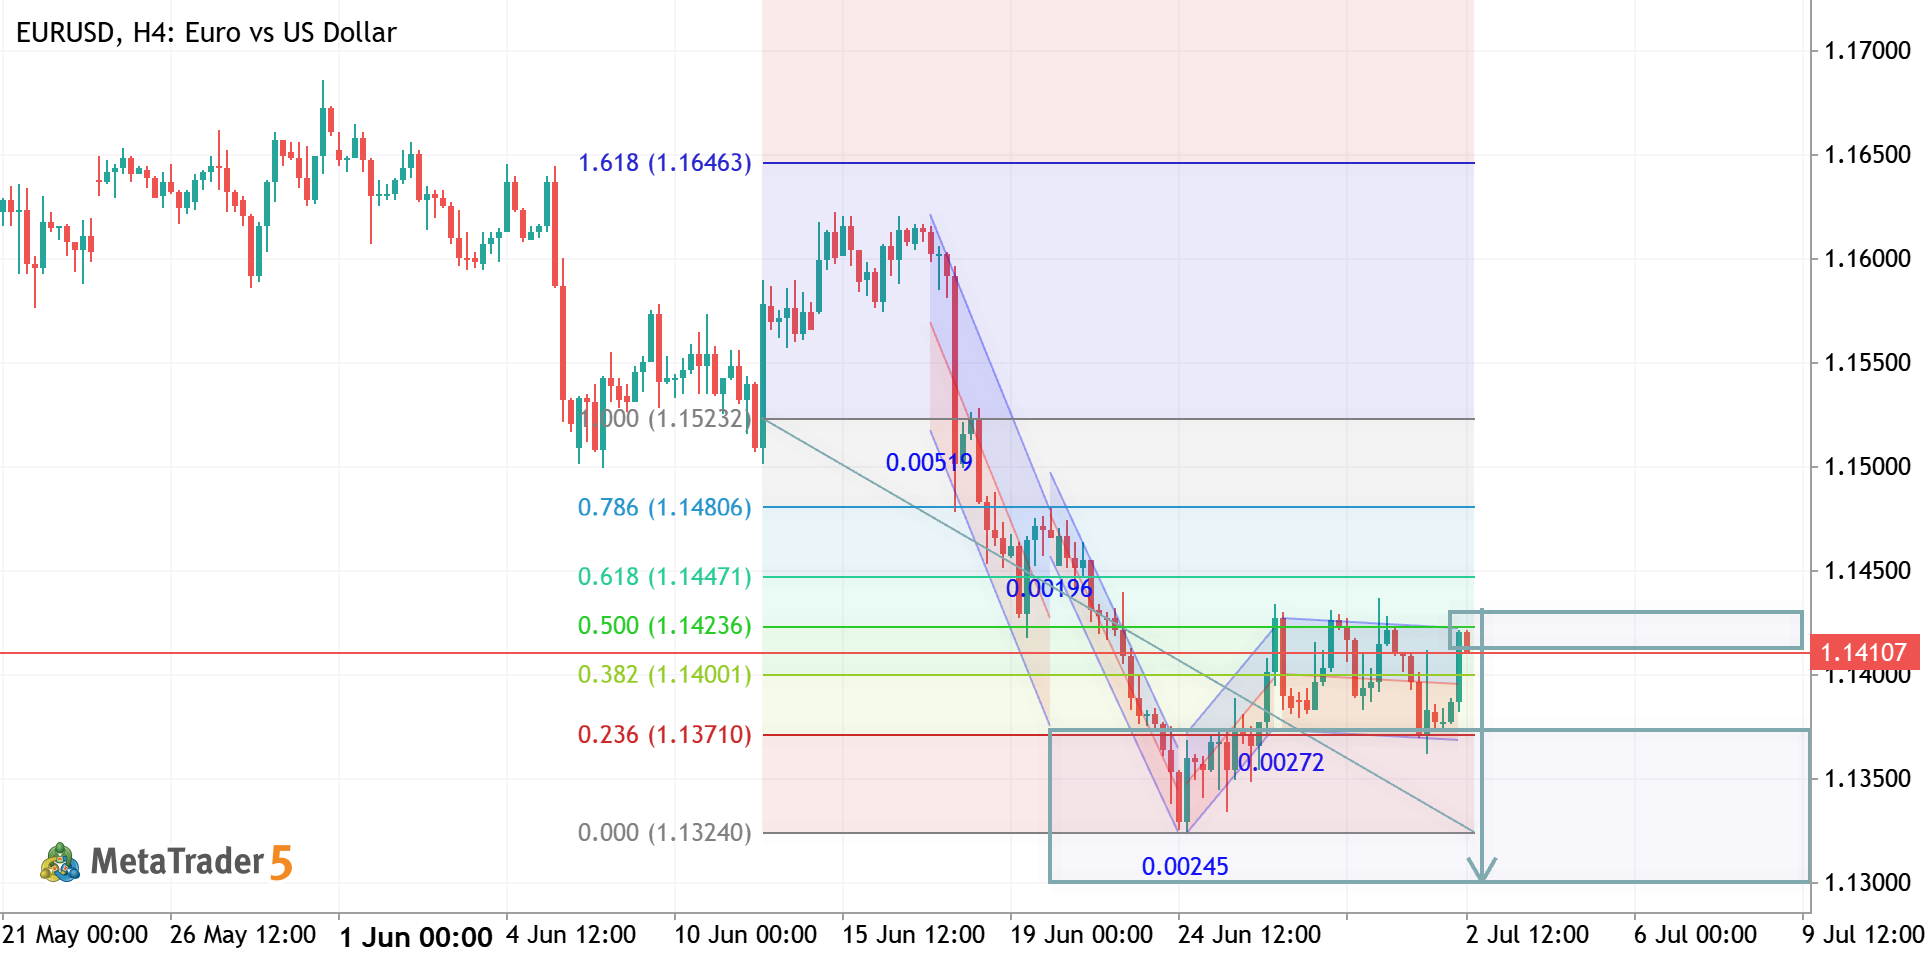
GBP/USD (M30) Trade Setup 🔴 Short (Sell) Entry Entry: 1.3385 – 1.3392 Stop Loss: 1.3408 Take Profit 1: 1.3361 Take Profit 2: 1.3345 Take Profit 3: 1.3335 Confirmation: Wait for a bearish rejection candle or bearish engulfing pattern at the resistance zone before entering. 🟢 Buy Entry Buy only if price retraces into support . Entry: 1.3335 – 1.3342 Stop Loss: 1.3320 Take Profit 1: 1.3361 Take Profit 2: 1.3383 Take Profit 3: 1.3390 Alternative Buy: If price closes strongly above 1.3395 and then retests it as support, look for buy confirmations targeting 1.3410+ . Current Bias: Sell from resistance has the higher probability until 1.3395 is broken decisively.
SHIP - Long-Term Technical Forecast SHIP Seanergy Maritime Holdings Corp. - Common Stock

SHIP - Long-Term Technical Forecast

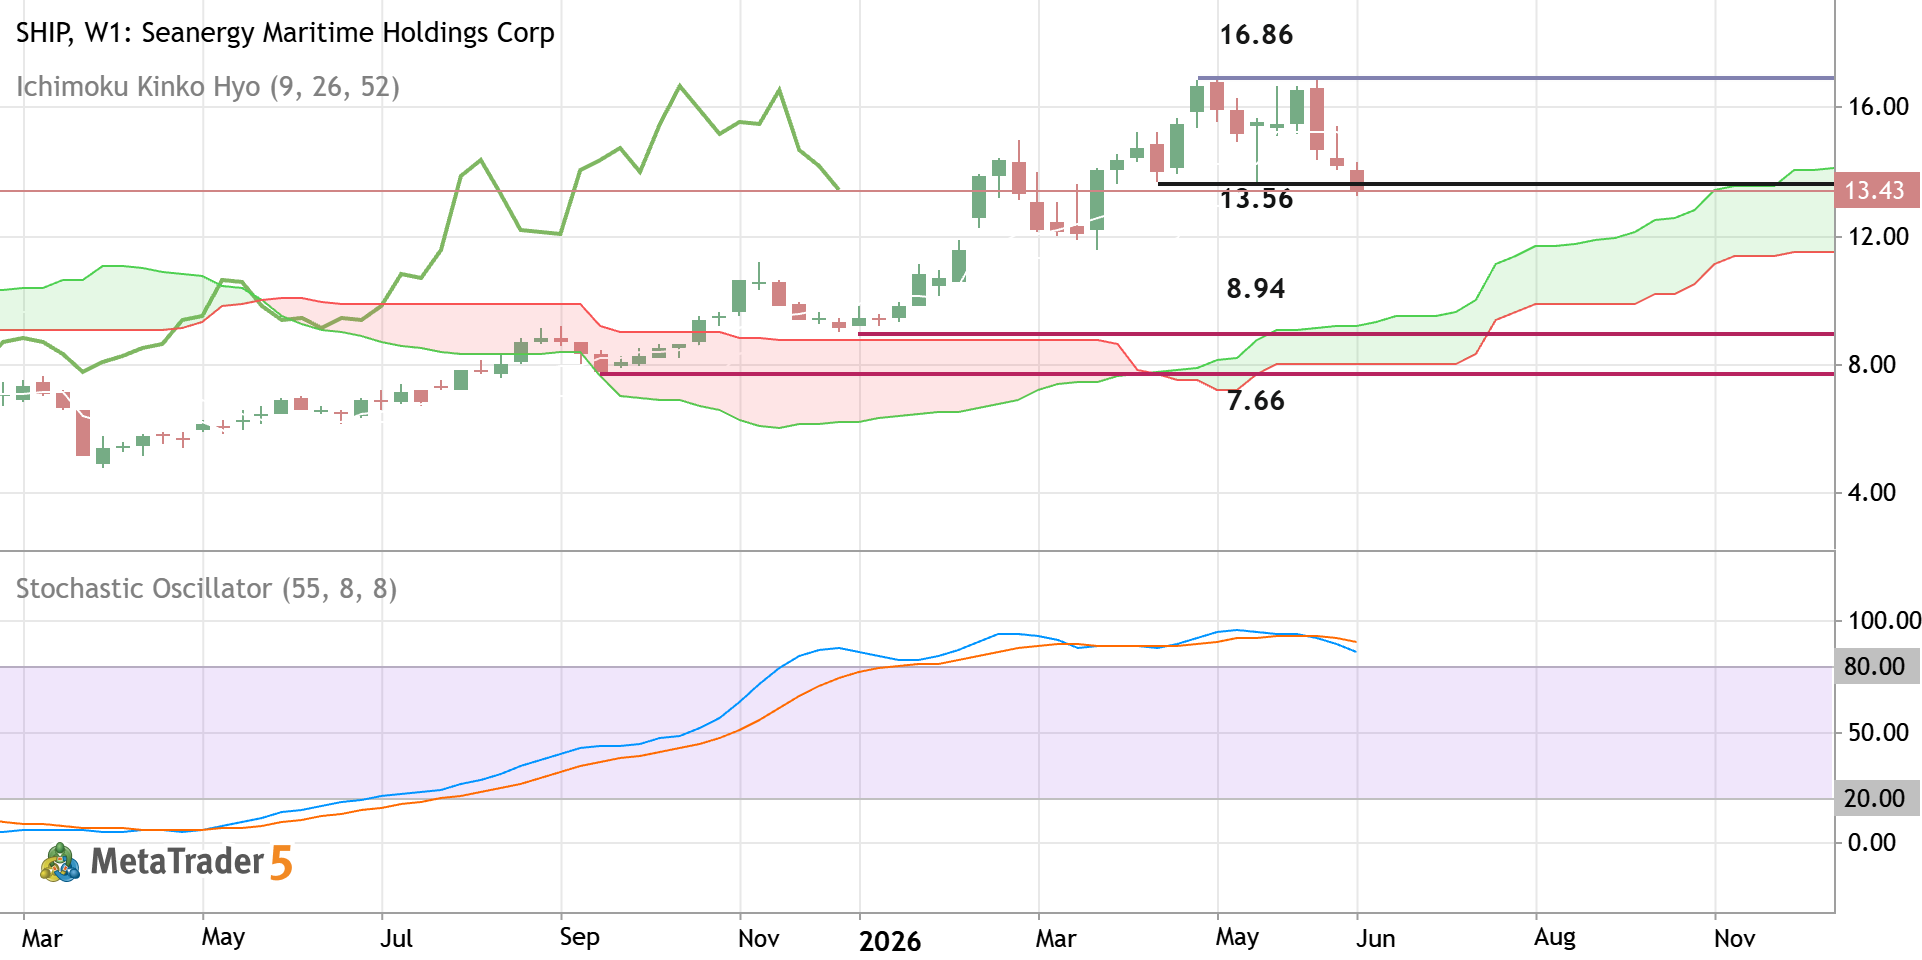
The weekly price is located above Ichimoku cloud in the bullish area of the chart. The price was bounced from support level at 16.86 to below for trying to break the next support level at 13.56 for the secondary correction to be started. If the price breaks the level at 13.56 to below on weekly close bar so we may see the secondary correction within the primary bullish market condition. If the price crosses 8.94 support to below together with the next support level at 7.66 so the primary bearish reversal will be started. Alternatively, the price will be on ranging to be near and above Ichimoku cloud waiting for the direction of the strong trend to be started. Trading Summary : ranging to the secondary correction
BGC - Daily Trading Forecast BGC BGC Group, Inc. - Class A Common Stock

BGC - Daily Trading Forecast

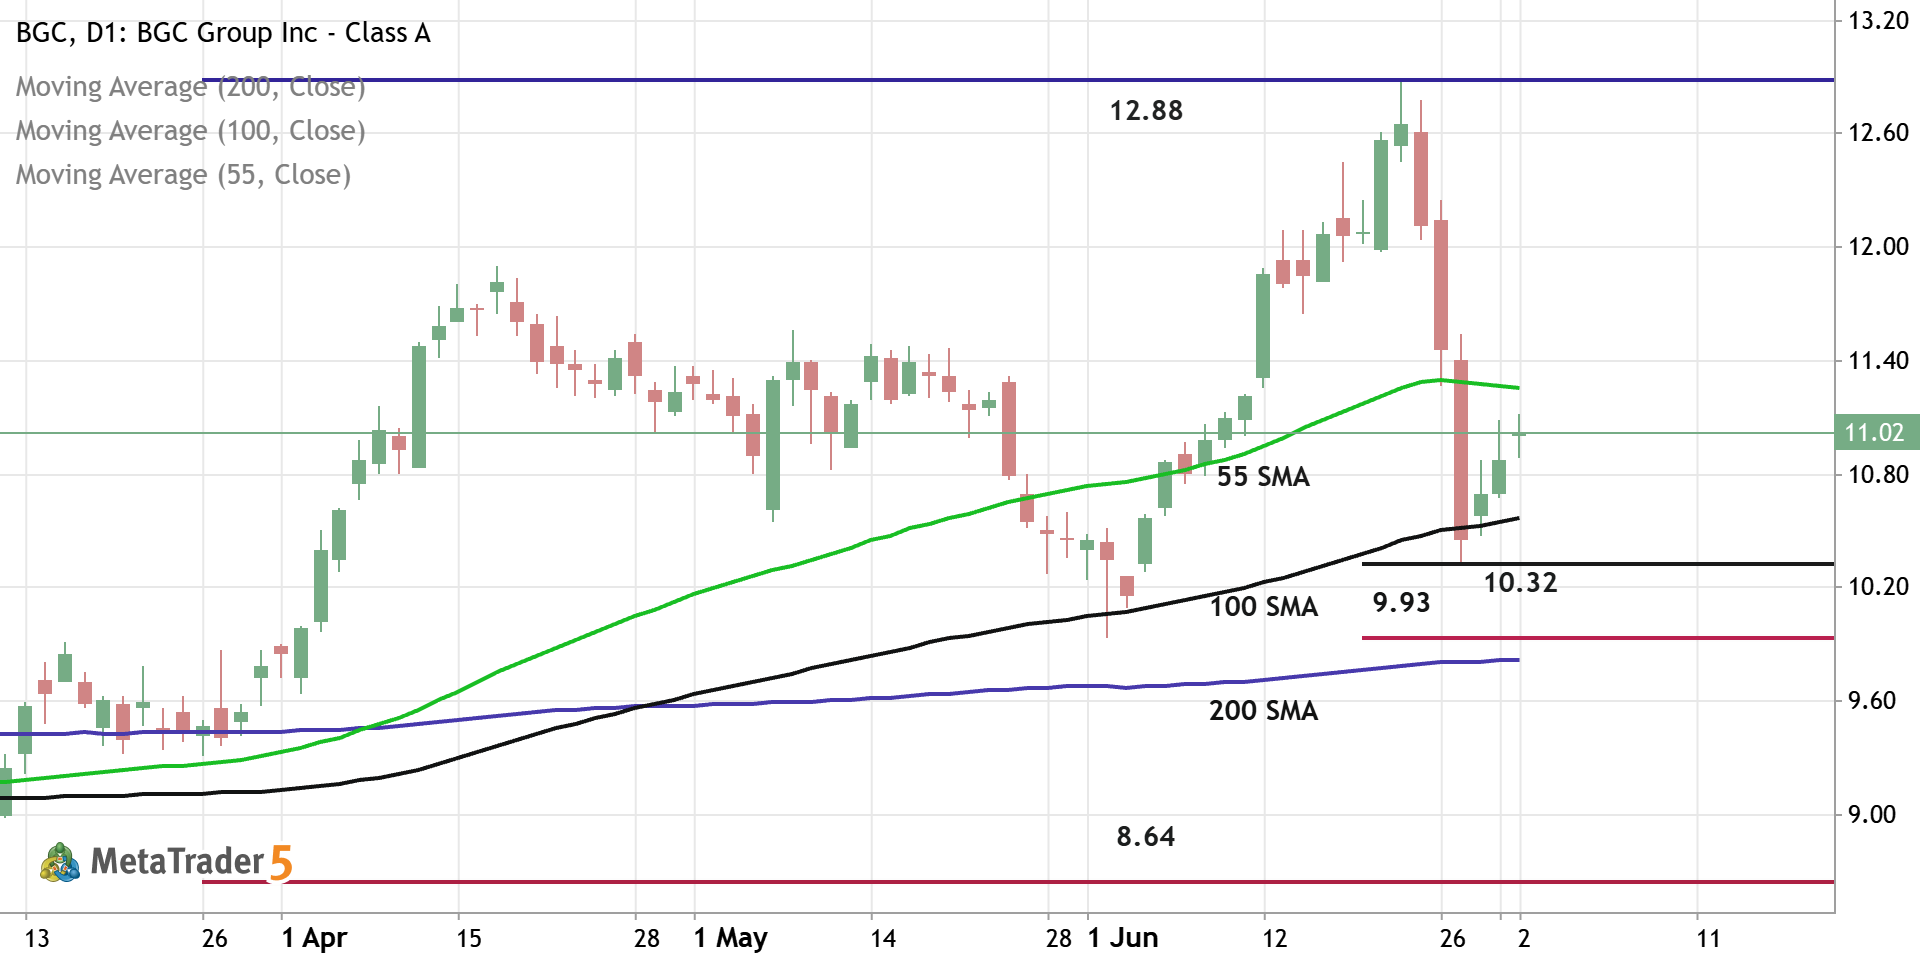
Daily price is located above 200-SMA in the bullish area of the chart. The price was bounced from support level at 10.32 and from 100-SMA to above for the pimary bullish trend to be continuing. If the price breaks 55-SMA to above so the strong bullish trend will be resumed with 12.88 resistance as the global possible target. If the price crosses support level at 9.93 together with 200-SMA to below so the primary bearish reversal will be started with 8.64 support level as the global possible target. Aternatively, the price will be on secondary ranging to be near and above 200 SMA waiting for direction. Trading Summary : waiting for direction
XAUUSD TRADE IDEA XAUUSD Long Gold vs US Dollar

XAUUSD TRADE IDEA

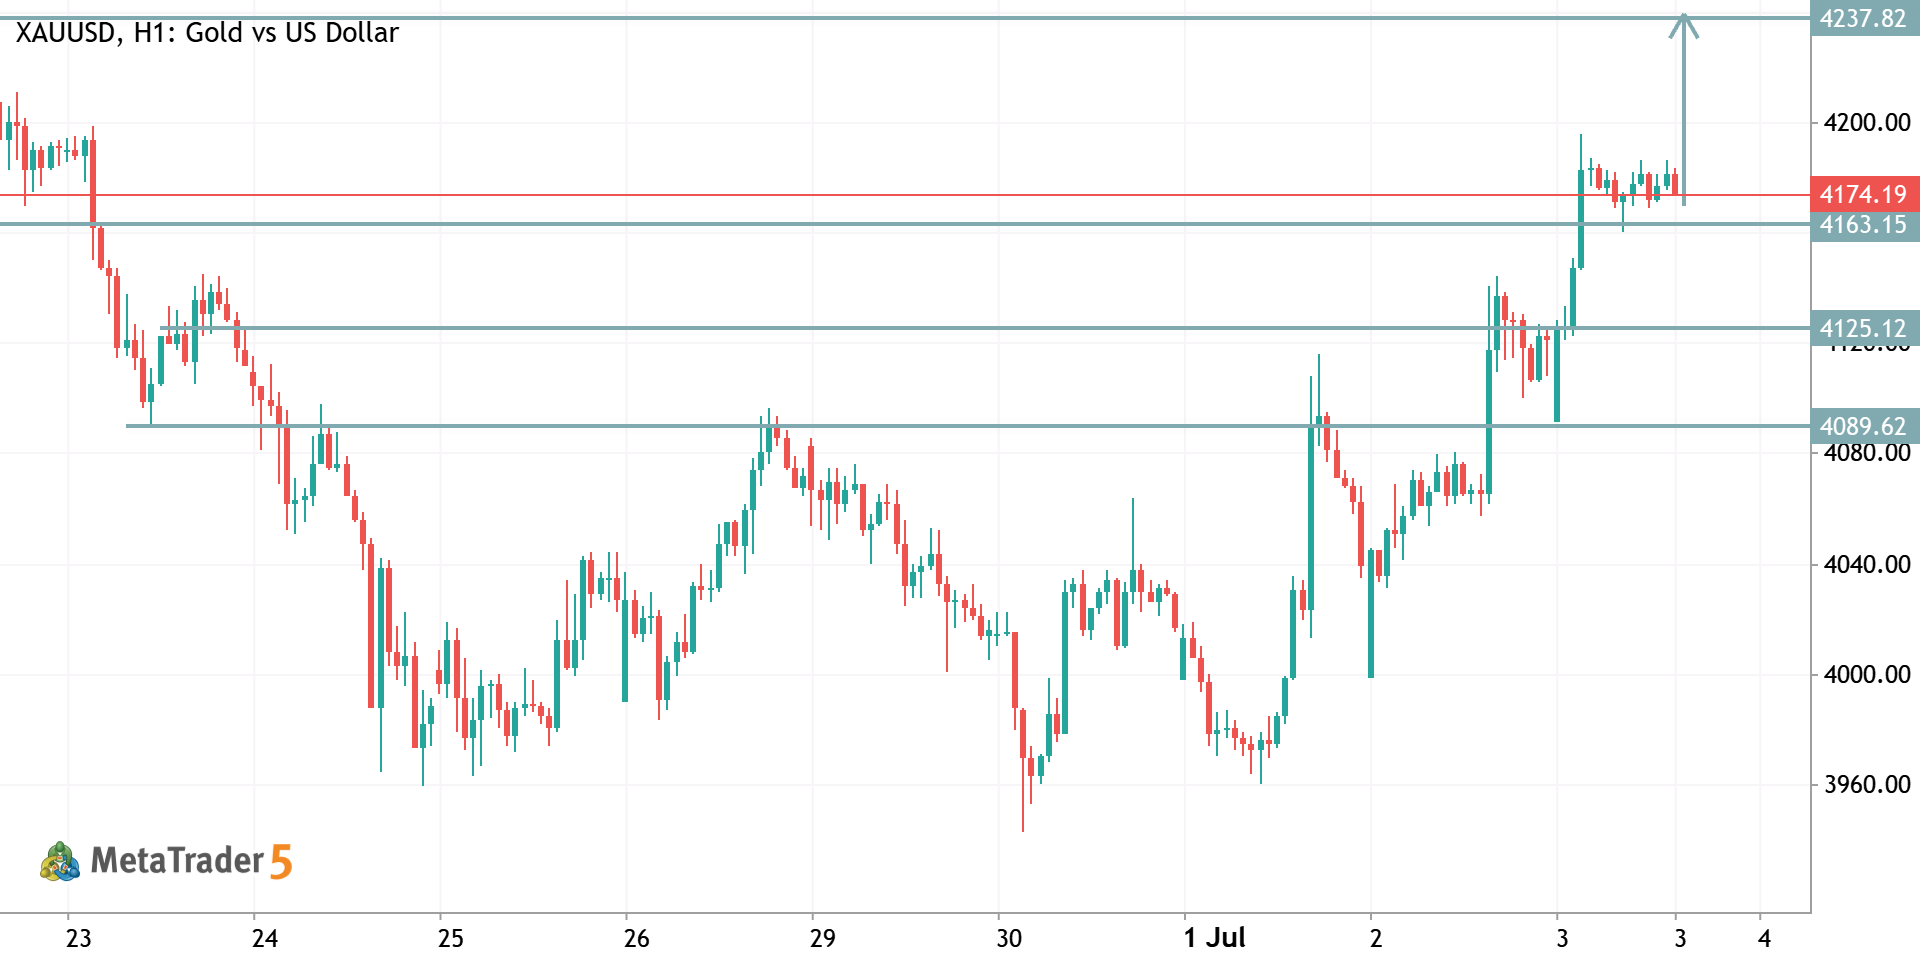
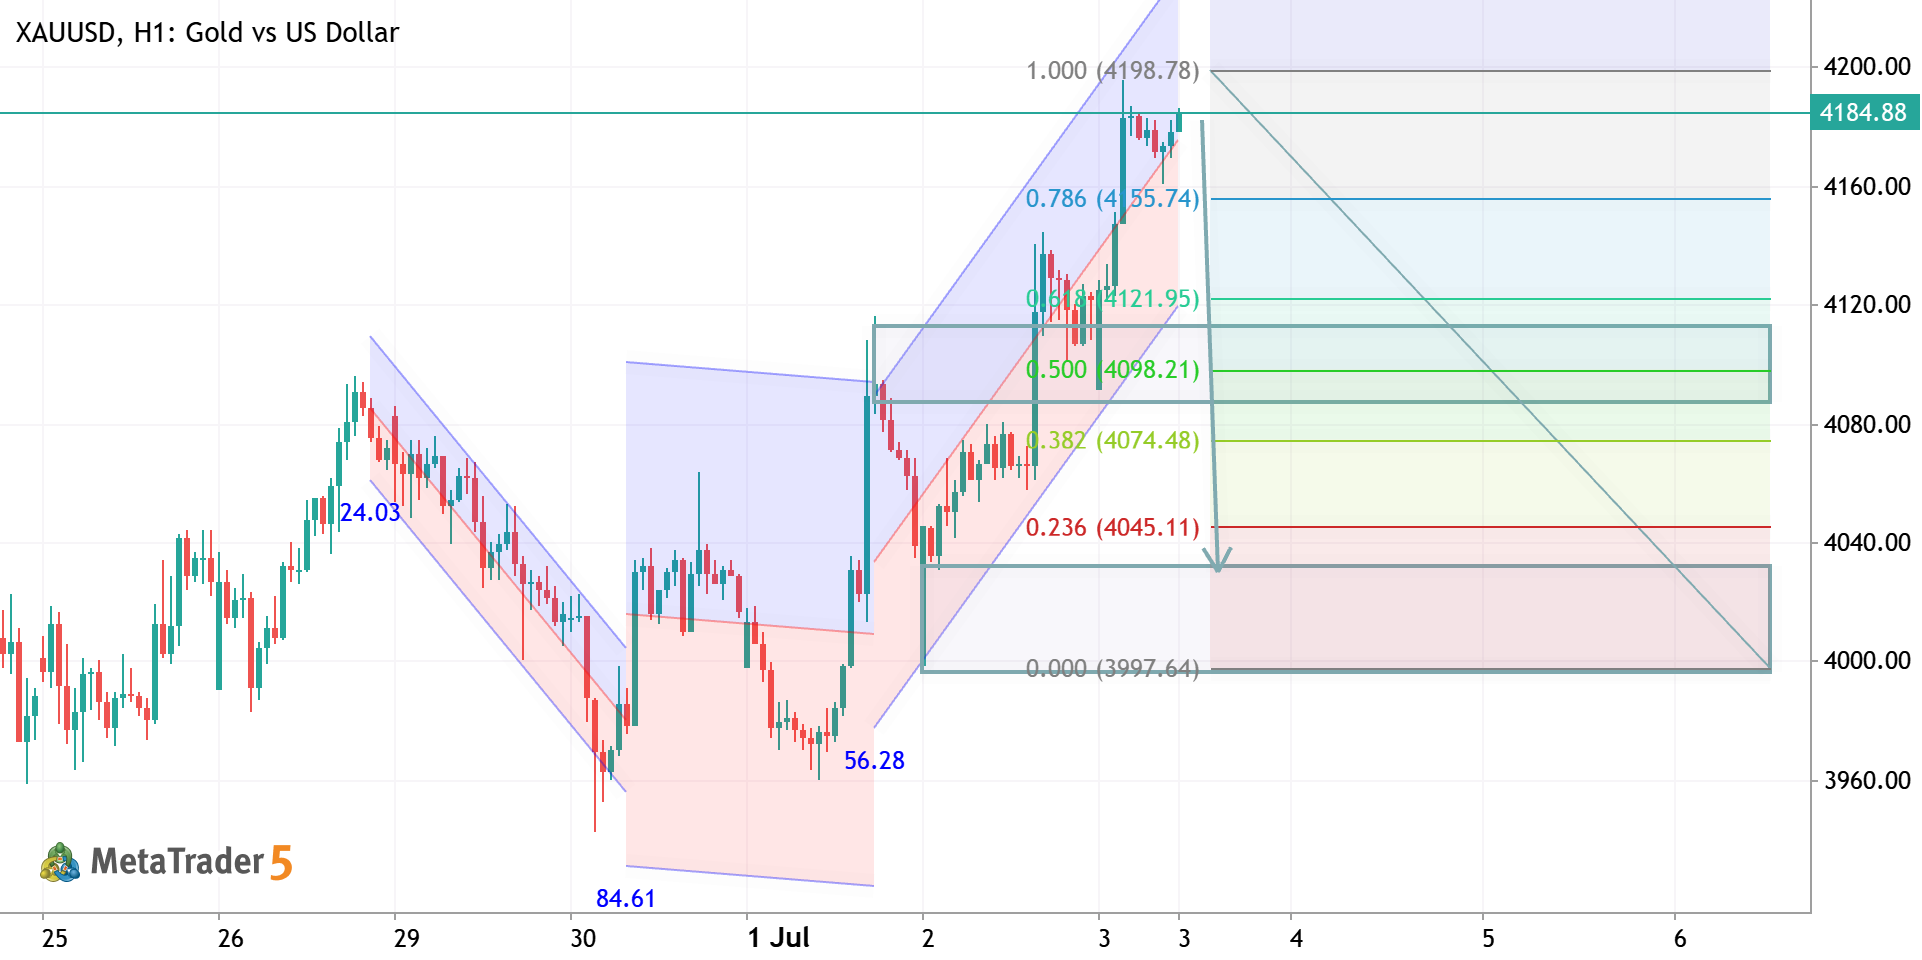
XAUUSD (Gold) – H1 Trade Analysis Trend: Bullish. Price has formed a strong impulsive move from the 3960 area and is making higher highs and higher lows. Current Resistance: 4173.68 (price is consolidating just below this level). Support Levels: 4165.15 – Immediate support. 4125.12 – Strong intraday support. 4089.62 – Major bullish support. Bullish Scenario (Higher Probability) Price is holding above 4165.15 , showing strength after the breakout. A sustained move above 4173.68 could trigger another bullish leg. Target 1: 4237.82 If momentum remains strong, price could extend beyond this resistance. Buy Idea Entry: Above 4173.68 after a confirmed candle close or on a retest. Stop Loss: Below 4165.15 (or below the most recent swing low for a wider stop). Take Profit: 4237.82 Bearish Scenario