

NVDA
#1
NVIDIA Corporation - Common Stock
229.2 8 USD
-0.01%
Market Price
Sektor: Technologie
Basis: USD
Gewinnwährung: USD
Tagesspanne
Jahresspanne
Tagesänderung
-0.52%
Monatliche Änderung
+8.62%
6 month change
+23.26%
Jahresänderung
+21.98%
Vorheriger Schlusskurs
230.4 8
Open
233.8 8
Tief
229.1 1
Hoch
233.8 9
Financials
2006
Current report, Q3 FY2006
NVIDIA CORP current report, Q3 FY2006
8-K
Current report, Q3 FY2006
NVIDIA CORP current report, Q3 FY2006
8-K
Quarterly report, Q3 FY2006
NVIDIA CORP quarterly report, Q3 FY2006
10-Q
Current report, Q2 FY2006
NVIDIA CORP current report, Q2 FY2006
8-K
Quarterly report, Q2 FY2006
NVIDIA CORP quarterly report, Q2 FY2006
10-Q
Current report, Q1 FY2006
NVIDIA CORP current report, Q1 FY2006
8-K
Current report, Q1 FY2006
NVIDIA CORP current report, Q1 FY2006
8-K
Current report, Q1 FY2006
NVIDIA CORP current report, Q1 FY2006
8-K
Current report, Q1 FY2006
NVIDIA CORP current report, Q1 FY2006
8-K
Current report, Q1 FY2006
NVIDIA CORP current report, Q1 FY2006
8-K
Nachrichten
FT: Nvidia prüft Übernahme von KI-Startup Reflection AI
Halbleiter-Startup Nuvacore strebt in Finanzierungsrunde Bewertung von 2,5 Mrd. US-Dollar an
Aktienmarkt heute: Nasdaq 100 erholt sich nach OpenAI-Schock, T-Mobile fällt um 12 %
Starke Exportdaten aus Taiwan: UBS bestätigt Nvidia-Kursziel von 300 US-Dollar
TSX-Futures vor Arbeitsmarktdaten und bei sinkenden Ölpreisen leicht im Plus
Lumentum-Aktie im Aufwind: KI-Nachfrage sorgt für ausverkaufte Kapazitäten bis 2029
„Firmus prüft nach IPO-Flop eine private Finanzierungsrunde über 3 Milliarden US-Dollar“ – Bloomberg
US-Futures stabilisieren sich nach Nasdaq-Rücksetzer wegen Sorgen um OpenAI-Umsätze
Nvidia plant laut Medienbericht Investition in KI-Chip-Konkurrenten d-Matrix
Bericht: Von Nvidia unterstütztes Rechenzentrum-Unternehmen Firmus Grid verschiebt Börsengang in Australien
10 Informationstechnologie-Aktien mit Whale-Alarms in der heutigen Sitzung
Charts & Ideen
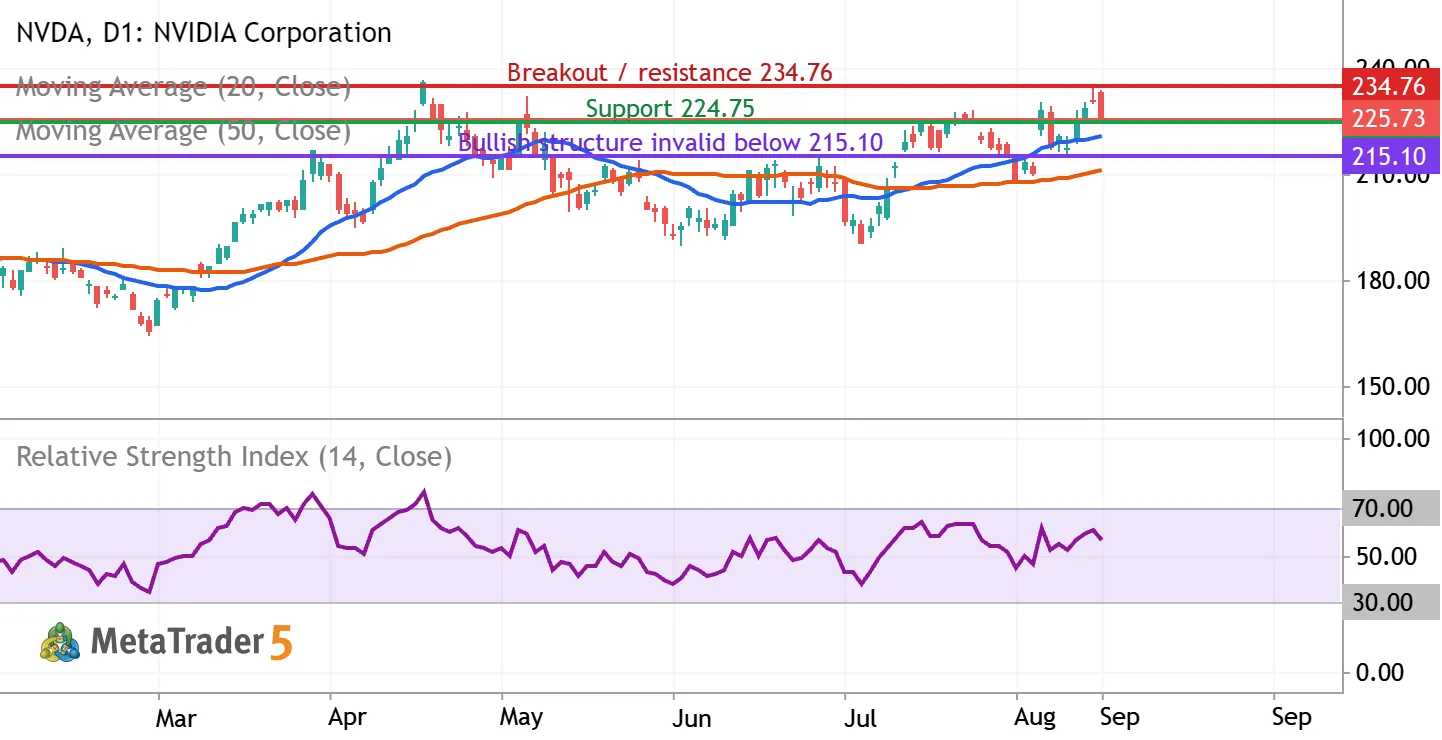
NVDA: testing $225 support as the uptrend meets $234.76 resistance
NVIDIA (NASDAQ: NVDA) | Daily chart | September 9, 2026 Bias: conditionally bullish over the next 2–6 weeks. Entry confirmation is still required. The latest completed regular session, September 8, closed at $225.73, down 2.01%, after reaching $233.71 intraday. The close near the session low signals selling pressure despite the broader recovery. What the indicators show The chart includes a blue 20-day simple moving average, an orange 50-day simple moving average, and purple RSI(14), all calculated from closing prices. At the latest completed candle, MetaTrader showed the averages near $220.48 and $211.22, with RSI near 56.19. Price remains above both rising averages, and the 20-day average is above the 50-day average. RSI above 50 supports positive momentum, but its reading below 70 is


The NVDA doesn’t have other trading ideas at this time
Browse ready-made trading ideas or select a symbol and create your own
Go to Charts and Trading Ideas