eurusd h4 analysis EURUSD Euro vs US Dollar
eurusd h4 analysis
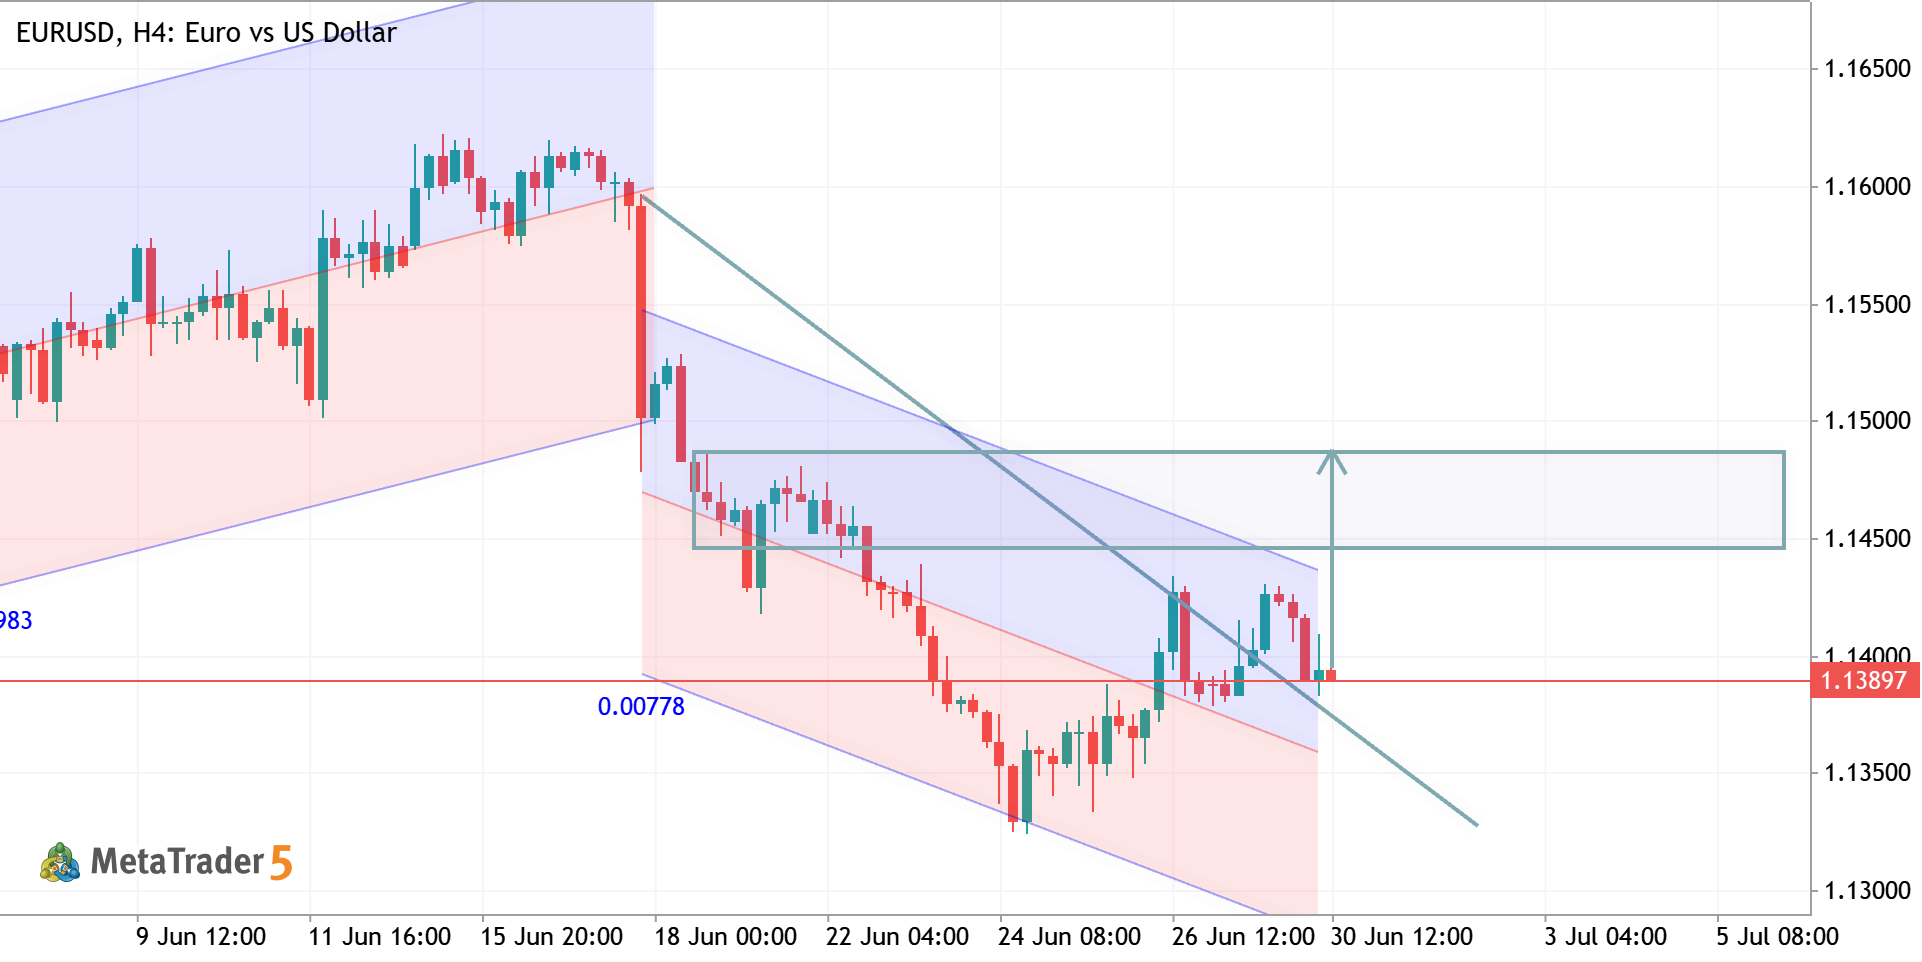
EURUSD H4 Analysis 📊 Price tapped a strong demand/support zone around 1.1590 – 1.1560 after a bearish move. Current structure suggests a possible bullish rebound if buyers maintain this area. 🔹 Key resistance: 1.1700 – 1.1760 🔹 Bullish confirmation above minor resistance could trigger continuation upward. 🔹 Bias remains cautiously bullish while price holds above support. 📈 Expected scenario: retracement → bullish momentum toward higher resistance zone. ⚠️ Risk management is essential — wait for confirmation before entry.
0
Goldanalysisteam Abdul Qayoom 2026.05.20 09:35
gbpusd h4 analysis GBPUSD Pound Sterling vs US Dollar
gbpusd h4 analysis
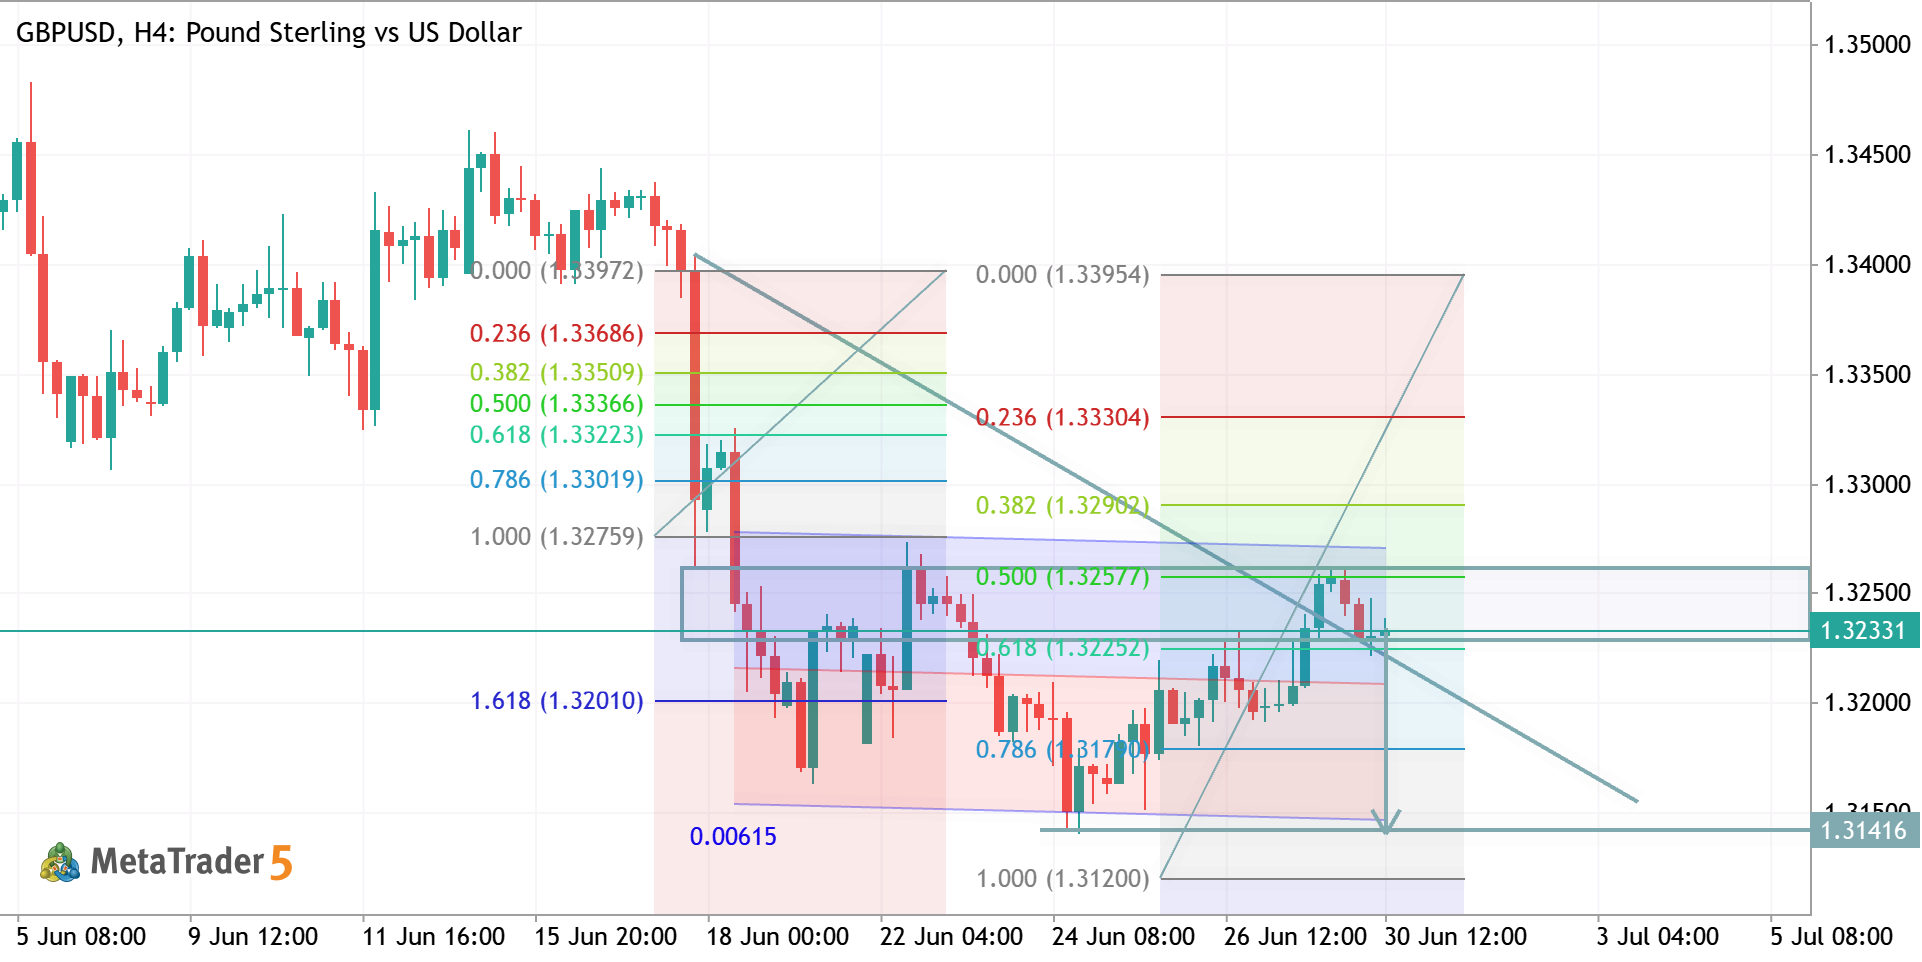
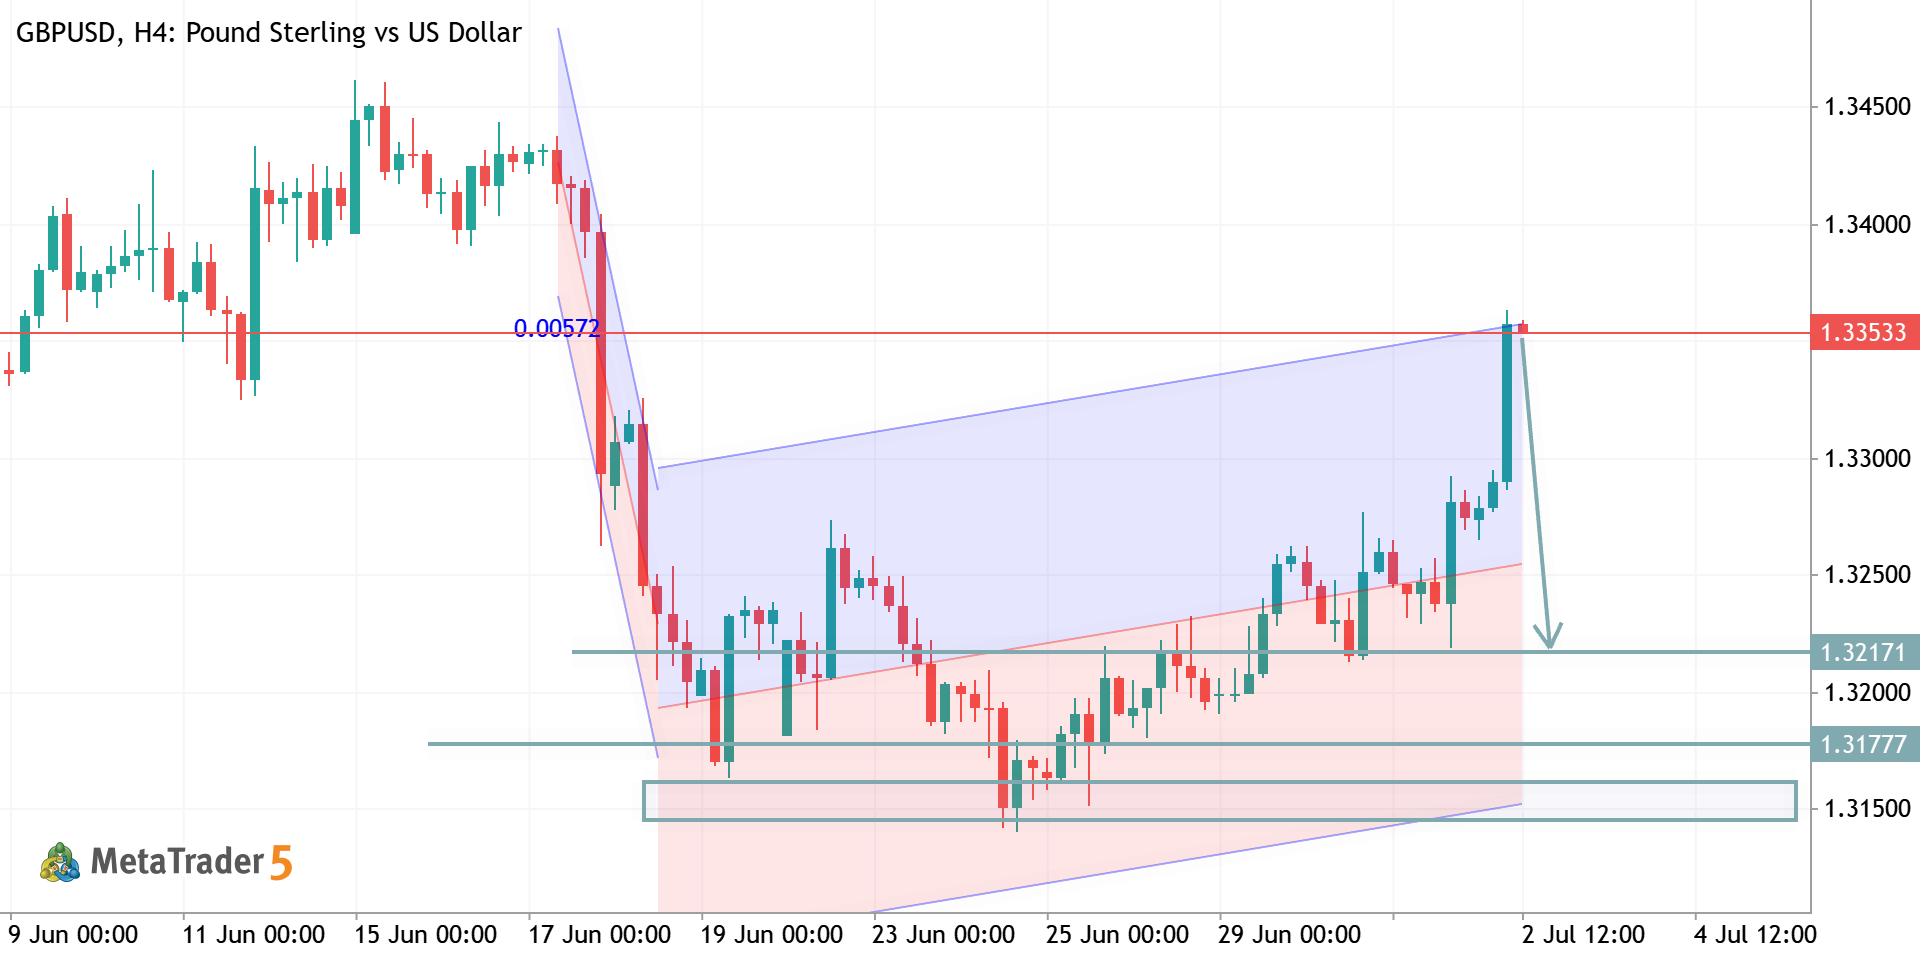
GBPUSD H4 Analysis 📊 Price broke below the ascending structure after multiple rejections from resistance zone. Bearish momentum remains strong while market trades inside a descending channel. 🔹 Resistance Zone: 1.3440 – 1.3520 🔹 Support Targets: 1.3300 – 1.3160 🔹 Bias: Bearish continuation Possible scenario: A short-term pullback toward resistance is possible before sellers continue targeting lower liquidity areas. Market structure still favors downside pressure. ⚡ #GBPUSD #Forex #PriceAction #SmartMoney #H4Analysis
3
Goldanalysisteam Abdul Qayoom 2026.05.20 09:26
btcusd h4 analysis BTCUSD Bitcoin vs US Dollar
btcusd h4 analysis
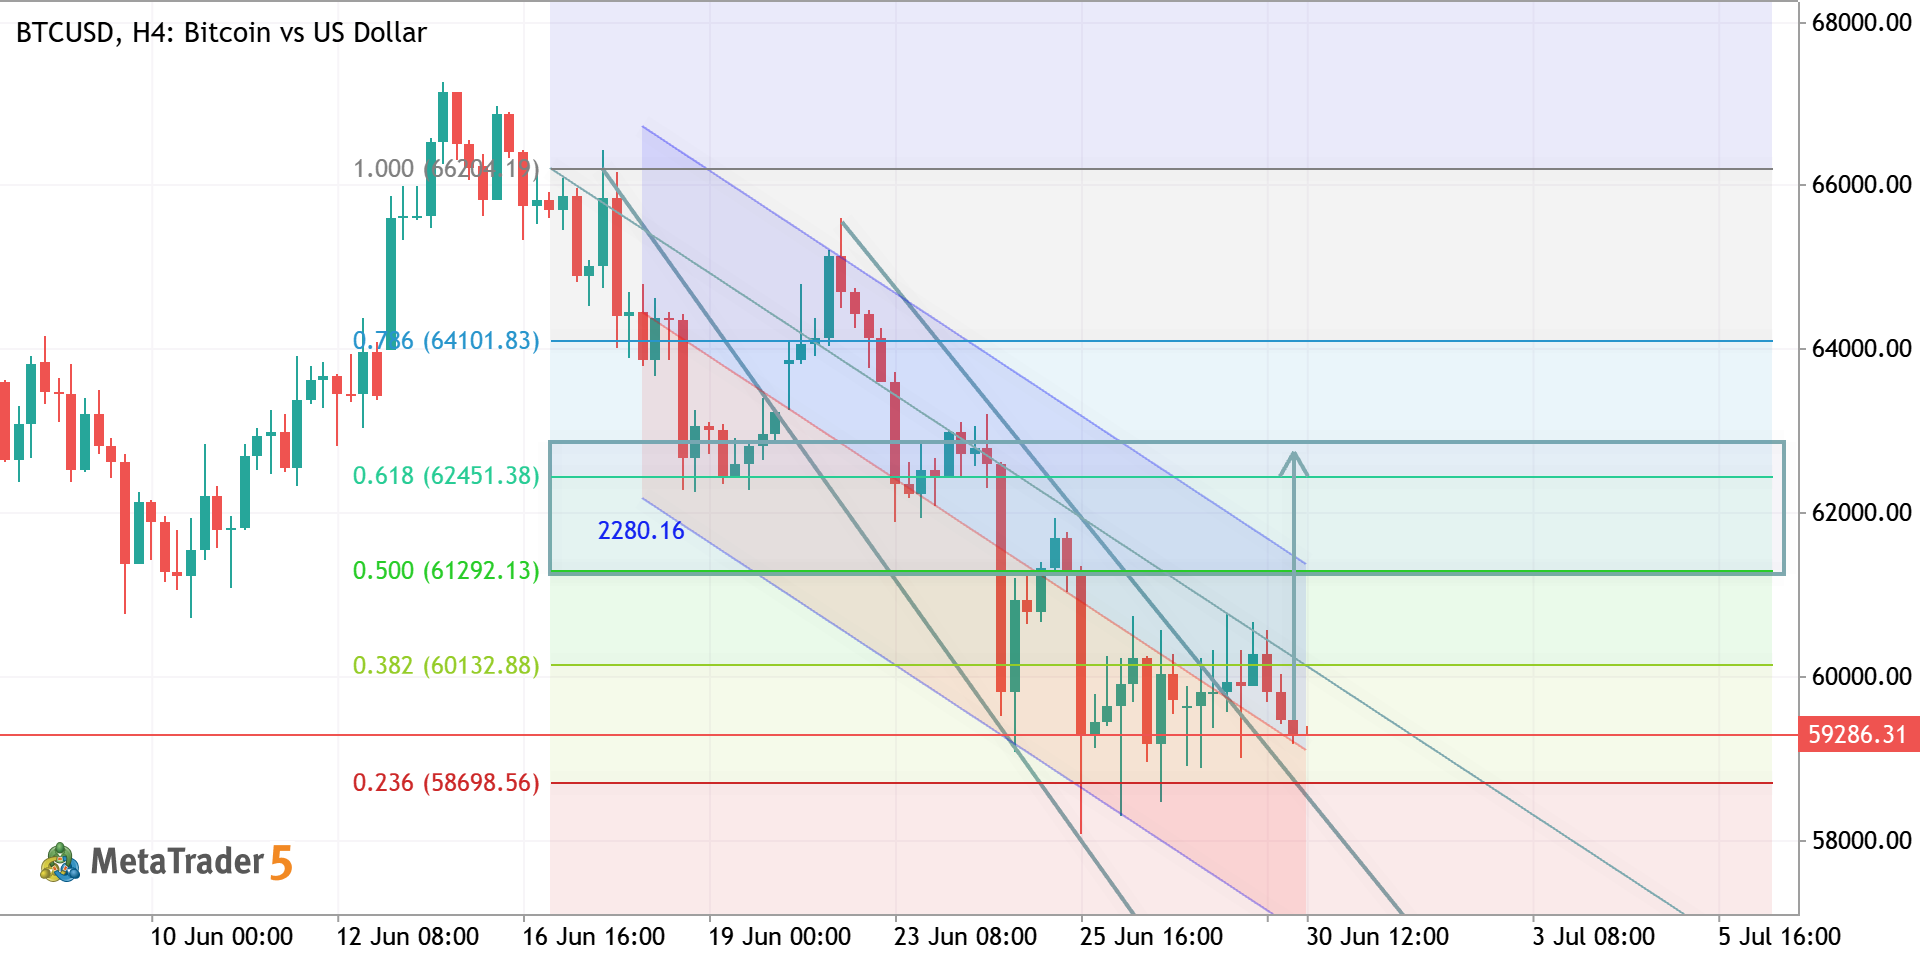
BTCUSD H4 Analysis 📉 Market rejected from the rising channel resistance and broke structure to the downside. Price is now consolidating near key support after strong bearish momentum. 🔹 Support Zone: 72400 – 73000 🔹 Resistance Zone: 76100 – 77300 🔹 Bias: Bearish below resistance Possible scenario: A weak retest can happen before continuation toward lower liquidity zones. Sellers still control the market unless price reclaims the broken structure. ⚡ #BTCUSD #Bitcoin #Forex #Crypto #PriceAction #SmartMoney
0
Goldanalysisteam Abdul Qayoom 2026.05.20 09:10
XAUUSD TRADE IDEA XAUUSD Long Gold vs US Dollar
XAUUSD TRADE IDEA
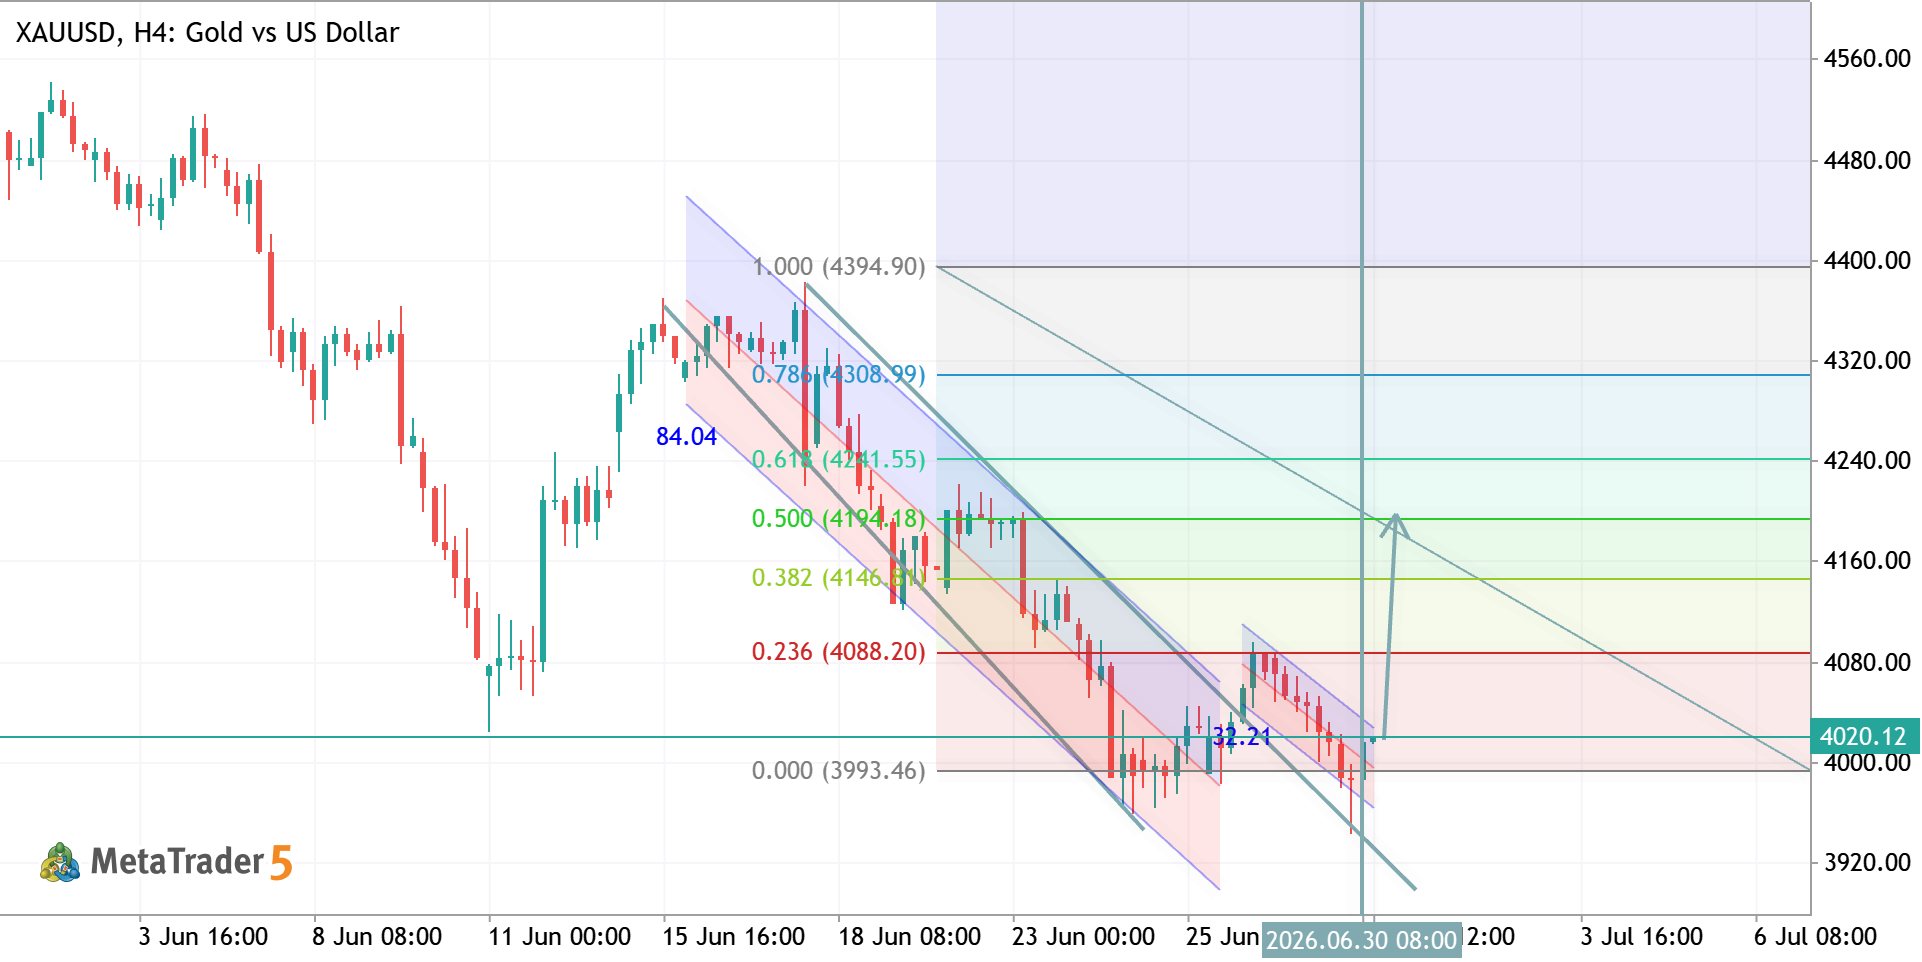
Gold remains in a short-term bearish structure after failing to sustain above the 4715 resistance zone. Price recently broke below multiple intraday support levels and is now consolidating around the 4520–4510 demand area. Key structure shows: Resistance: 4605 → 4610 and 4715 Major Support: 4520 → 4510 Current Bias: Bearish below 4605 The market reacted strongly from the lower demand zone several times, indicating buyers are still defending this area. However, lower highs and continued rejection from resistance suggest weak bullish momentum. Trading Scenario: If price holds above 4510 and forms bullish confirmation, a rebound toward 4605 is possible. A confirmed break below 4510 could trigger further downside continuation toward 4480 and potentially lower. Professional Outlook: The
2
HamadJatoi Hamad Jatoi 2026.05.19 12:04
xauusd trade idea - quickly recovered XAUUSD Gold vs US Dollar
xauusd trade idea - quickly recovered
Gold is currently reacting from a strong demand/support zone around 4500–4510 after a sharp bearish move from the 4700 resistance area. Price swept liquidity below support and quickly recovered, showing buyer presence at lower levels. Key Levels: Resistance 1: 4605 Resistance 2: 4715 Support Zone: 4500–4510 Market Structure: Overall short-term trend remains bearish below 4605. Current bounce suggests a possible corrective move toward 4605 resistance. If buyers break and close above 4605, bullish momentum may continue toward 4715. Failure to hold above 4500 could trigger another selloff toward lower support levels. Trading Outlook: Bullish Scenario: Buy continuation above 4545 targeting 4605, then 4715. Bearish Scenario: Rejection from 4605 may provide fresh selling opportunities targeting
0
HamadJatoi Hamad Jatoi 2026.05.18 07:18
BAC - Daily Trading Forecast BAC Short Bank of America Corporation Common Stock
BAC - Daily Trading Forecast
The Ichimoku cloud was almost broken by the daily price to below for the good daily bearish reversal, and the Chinkou Span line of Ichimoku indicator is showing the daily breakdown to be started. If the price breaks the support level at 49.2 to below on the daily close bar so the daily price will come to the bearish area of the chart with the bearish reversal for example. If the price crosses the resistance level at 54.2 to above for the possible target to re-enter as 55.4 resistance so the primary bullish trend will be resumed. Alternatively, the price will be on ranging within s/r levels waiting for direction. Trading Summary : possible bearish reversal
2
newdigital Sergey Golubev 2026.05.16 12:39
xauusd trade idea XAUUSD Long Gold vs US Dollar
xauusd trade idea
Gold is currently testing a major H4 demand zone around 4540 – 4565 after a strong bearish rejection from the 4715 resistance area . Price action shows that sellers remain active in the short term, but the market is approaching a key support region that has previously triggered bullish reversals. The overall structure remains range-bound between 4540 support and 4715 resistance , with price reacting multiple times from both zones. A strong bullish reaction from current support could lead to a recovery toward 4635 first, followed by a retest of 4715 resistance. However, if the market breaks and closes below 4540 , bearish momentum may accelerate toward the 4480 – 4450 zone. k Support: 4565 / 4540 / 4480 Resistance: 4635 / 4715 / 4800 Market sentiment on H4 remains cautious as gold trades
2
HamadJatoi Hamad Jatoi 2026.05.15 11:12
SHEL - Daily Trading Forecast SHEL Shell PLC American Depositary Shares (each representing two (2)
SHEL - Daily Trading Forecast
Daily price is located above 200 SMA in the bullish area of the chart. The price was bounced from 94.9 resistance level to below for the secondary correction to be started and with Stochastic oscillator to be confirmed this short term trend for example. For now, the price is trying to break the descending triangle pattern with support level at 83.7 for the correction to be continuing up to the bearish reversal support level at 77.8. Alternatively, the price will be on the secondary ranging within s/r levels of the primary bullish trend waiting for the direction of the strong bullish trend to be continuing in the case of resistance level at 94.9 to be broken to above or to the primary bearish reversal to be started with 77.8 support level to be crossed to below on the close daily bar for
0
newdigital Sergey Golubev 2026.05.15 06:54