XAUUSD XAUUSD Long Gold vs US Dollar
XAUUSD
Price action shows a strong bullish recovery after breaking out of the descending channel, confirming short-term momentum has shifted in favor of buyers. The market respected the 4647–4677 support zone multiple times, indicating solid demand at lower levels. Currently, price is consolidating near the 4698 resistance area. A successful hold above 4677 keeps the bullish structure intact and increases the probability of another push toward 4720 and potentially 4818 resistance. However, failure to maintain above 4677 could trigger a short-term pullback toward 4647 support before buyers attempt continuation. Overall sentiment remains cautiously bullish while price trades above the highlighted support region.
XAUUSD BUY SETUP XAUUSD Long Gold vs US Dollar
XAUUSD BUY SETUP
📈 Gold is consolidating above the rising trendline after a strong bullish impulse. ⚡ Price continues respecting the support zone around 4683–4660, showing buyer strength. ✅ Hidden bullish divergence is visible; ✅ Moving averages remain positively aligned, supporting continuation upside. 🟢 We are considering BUY positions ONLY if XAUUSD holds above 4683 support. 🎯 Target 1: 4819 🎯 Target 2: 4868 ❌ Invalidation: Strong breakdown below 4660 support zone. 🔥 As long as the structure remains intact, bulls may push Gold toward higher resistance levels.
XAUUSD H1 — Structural Rejection & Bearish Continuation XAUUSD Short Gold vs US Dollar
XAUUSD H1 — Structural Rejection & Bearish Continuation
The GOLD has been in a sustained downtrend, recently completing a corrective rally. Price is currently reacting to a major  Horizontal Resistance Level at 4680.80 , which aligns with a multi-touch descending trendline. We are seeing a clear rejection at the upper boundary of an ascending wedge pattern, suggesting the corrective phase is over. Technical Conditions: Resistance Pivot:  The red line at 4680.80 has acted as a significant "flip zone" (previous support now acting as resistance). Ascending Wedge:  Price is wedge-trapped. A break below the lower support of this wedge will trigger a rapid move toward the previous lows. Price Action:  Large red rejection candles at the 4710 supply zone indicate sellers are aggressively defending this level. Levels: Key Resistance
GOLD VS US DOLLAR (XAU/USD) 1H ANALYSIS XAUUSD Gold vs US Dollar
GOLD VS US DOLLAR (XAU/USD) 1H ANALYSIS
📉 Market Structure: Bearish Clear downtrend (lower highs + lower lows) Price is consistently respecting a descending structure No strong bullish reversal yet 👉 This is not a ranging market — it’s trending down 🔍 What Just Happened Price dropped strongly into a support zone (~4510–4520) Small bounce/rejection from that level Currently weak consolidation after a drop 👉 That bounce looks like a pullback, not a reversal (for now) 📊 Key Zones 🔴 Resistance (Sell Areas) 4550 – 4580 → recent lower high zone 4600+ → stronger supply if price pushes higher 🟢 Support (Buy Reaction Zones) 4500 – 4520 → current support Break below → next likely drop continues ⚠️ Important Signal 👉 The last move: Strong bearish push Weak bullish correction This usually means: Sellers are still in control 📉
XAUUSD Next Target XAUUSD Short Gold vs US Dollar
XAUUSD Next Target
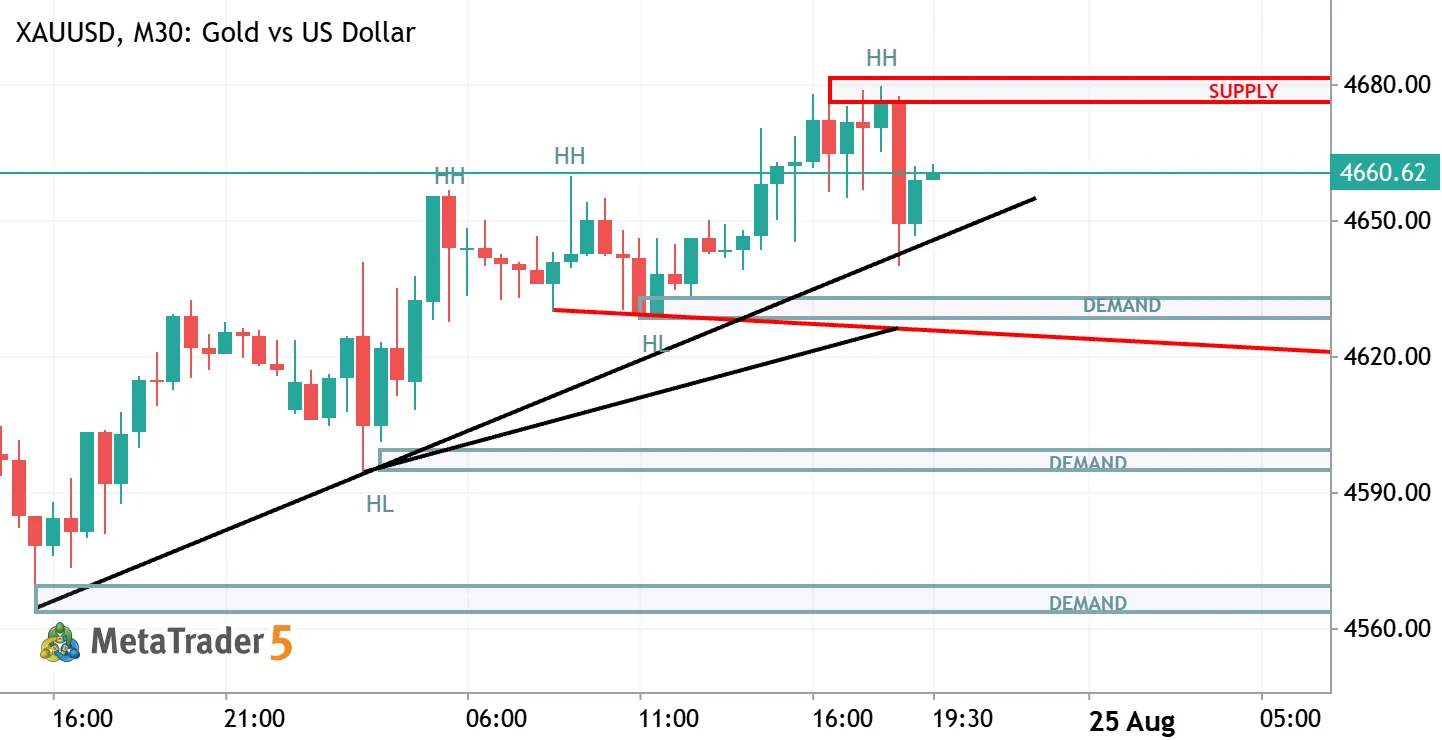
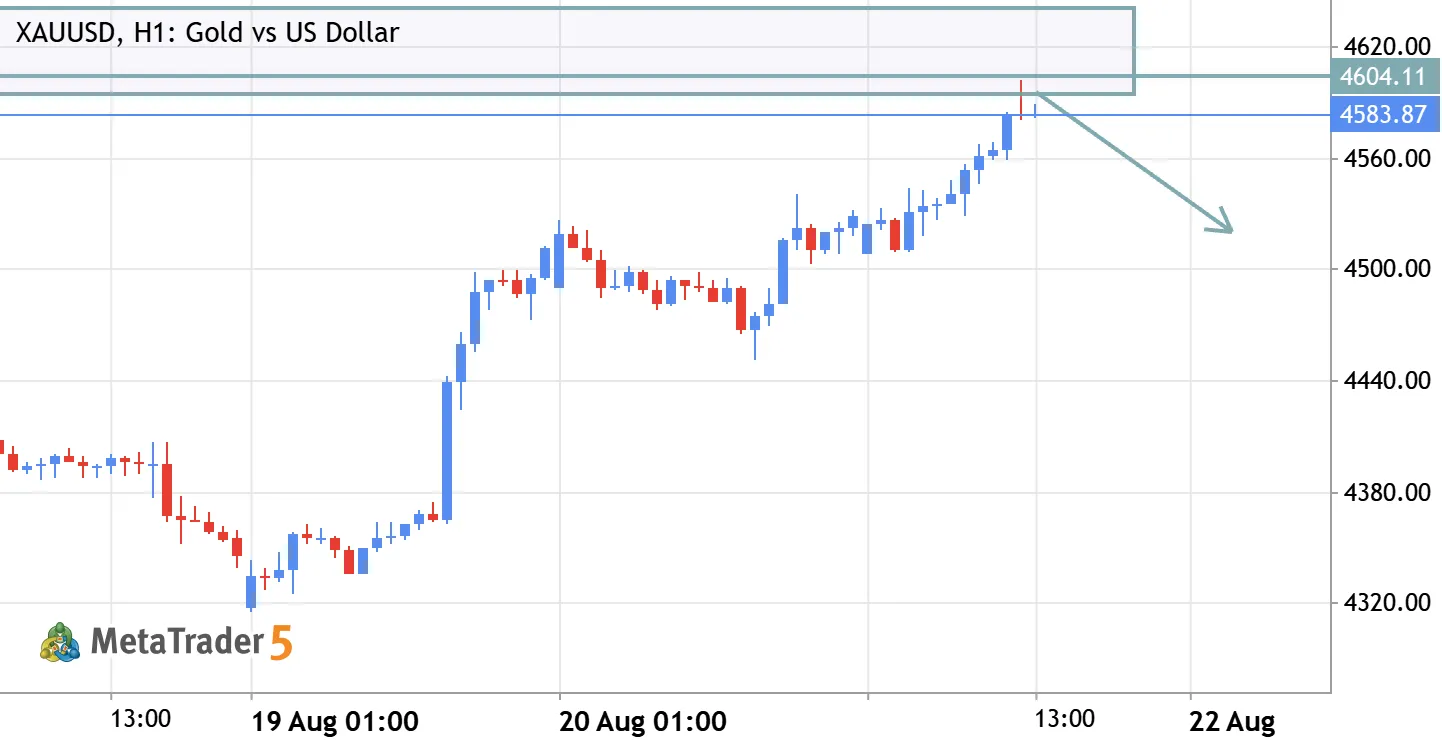
📊 Market Structure Market recently made a CHoCH (Change of Character) → signals shift from bullish → bearish. Before that, there was BOS (Break of Structure) to upside, but momentum is now weakening. Current price is forming lower highs → early bearish confirmation. 📉 Trend Bias: SELL (Short-Term) Price rejected from recent swing high (~4620 zone) Now moving inside a descending structure Your drawn trendline break also supports downside 🔑 Key Zones 🔴 Supply / Resistance Zone: 4600 – 4620 👉 Strong rejection area (sell zone) 🔵 Demand / Support Zone: 4550 – 4520 👉 Liquidity zone + previous base 🎯 Trade Setup (MetaTrader Style) 📉 SELL Entry: 4602 – 4607 (retest area) 🎯 Take Profits: TP1: 4590 TP2: 4580 TP3: 4550 🚫 Stop Loss: 4625 🧠 Logic Behind Trade CHoCH confirms bearish shift
XAU/USD(Gold vs.UD Dollar) H1 Chart XAUUSD Short Gold vs US Dollar
XAU/USD(Gold vs.UD Dollar) H1 Chart
The chart shows a significant shift in market sentiment over the last few trading sessions: ​Bearish Breakout: After a period of consolidation between April 23rd and 28th, the price experienced a sharp breakdown below the previous support level (indicated by the horizontal red line around 4613.00). ​Trendline Interaction: There is a long-term ascending trendline (the blue diagonal line). The price has recently broken below this trendline, retested it from underneath, and failed to reclaim it, which is a classic technical signal for a trend reversal or a deeper correction. ​Current Momentum: The price is currently trading near 4603.38. After hitting a recent swing low near 4595, the market is seeing a minor corrective bounce, but the overall immediate structure remains bearish as long as it