GE - Daily Ranging for Direction GE GE Aerospace Common Stock
GE - Daily Ranging for Direction
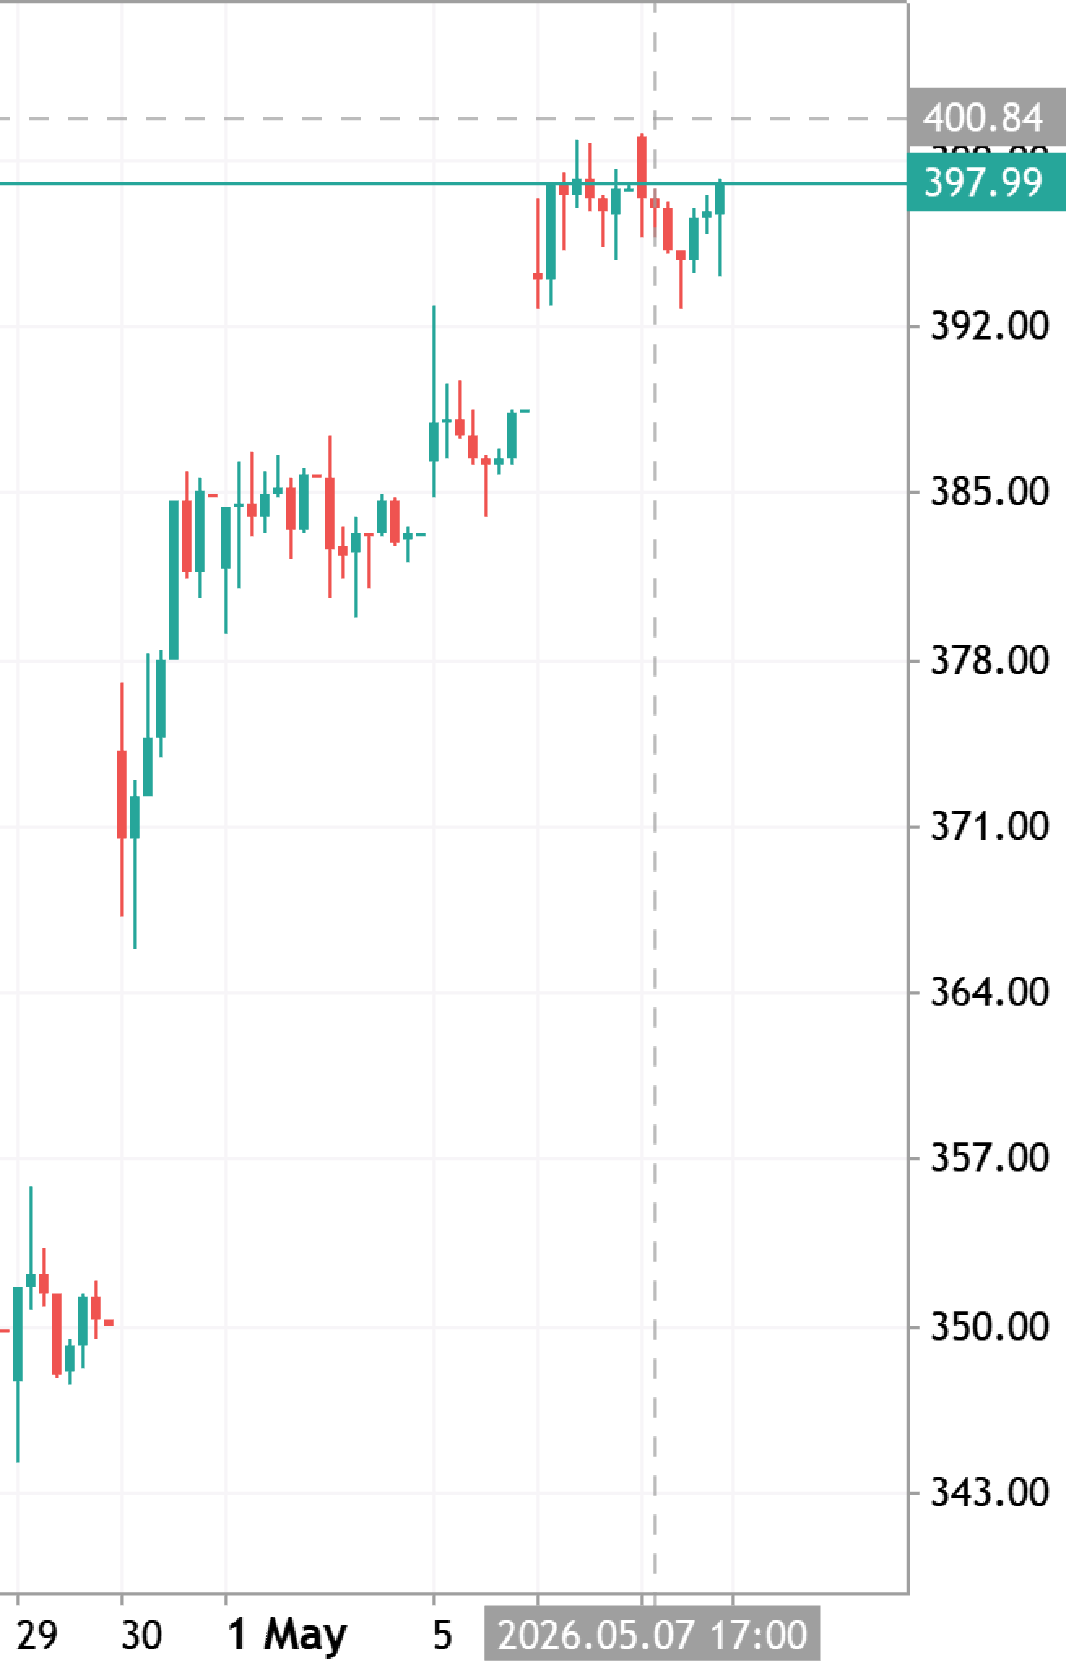
The daily price is on ranging near and above 200 SMA: if the price breaks 302.88 level to above for the daily close bar and with 319.14 target to re-enter so the primary bullish trend will be resumed and continuing; if the price crosses 200 SMA to below together with 281.31 support so the bearish reversal will be started; alternatively, the price will be on the ranging to be near and around 200 SMA waiting for the direction of the trend to be started. Trading Summary : ranging for direction
2
newdigital Sergey Golubev 2026.05.24 15:56
AMZN Builds Momentum Near Resistance Zone AMZN Short Amazon.com, Inc. - Common Stock
AMZN Builds Momentum Near Resistance Zone
AMZN is recovering after a recent pullback and approaching a key resistance area. The current structure suggests buyers are attempting to regain control as momentum gradually improves. Bullish scenario: A breakout above recent highs could support continuation toward the next resistance levels. Strong trend structure remains intact while price stays above support. Bearish scenario: Rejection near resistance may trigger short-term profit taking. Broader market weakness could increase volatility in tech stocks. Key levels to watch: Support: recent consolidation zone Resistance: previous swing highs Momentum remains cautiously bullish while buyers continue defending higher lows.
0
m Maxim Kruglov 2026.05.22 09:13
GOOGL Holds Support After Recent Pullback GOOGL Short Alphabet Inc. - Class A Common Stock
GOOGL Holds Support After Recent Pullback
GOOGL is stabilizing near an important support area after a short-term correction. Buyers are still defending the broader uptrend, while price remains above key medium-term levels. Bullish scenario: A move above recent highs could confirm renewed upward momentum. Continued strength may push the price toward the next resistance zone. Bearish scenario: Losing current support may increase selling pressure and lead to a deeper retracement. Weak market sentiment in the tech sector could slow recovery attempts. Key levels to watch: Support: recent swing lows Resistance: previous local highs The current structure remains neutral-to-bullish while support levels continue holding. #GOOGL #Stocks #Alphabet #MetaTrader
0
m Maxim Kruglov 2026.05.21 14:21
BAC - Daily Trading Forecast BAC Short Bank of America Corporation Common Stock
BAC - Daily Trading Forecast
The Ichimoku cloud was almost broken by the daily price to below for the good daily bearish reversal, and the Chinkou Span line of Ichimoku indicator is showing the daily breakdown to be started. If the price breaks the support level at 49.2 to below on the daily close bar so the daily price will come to the bearish area of the chart with the bearish reversal for example. If the price crosses the resistance level at 54.2 to above for the possible target to re-enter as 55.4 resistance so the primary bullish trend will be resumed. Alternatively, the price will be on ranging within s/r levels waiting for direction. Trading Summary : possible bearish reversal
2
newdigital Sergey Golubev 2026.05.16 12:39
SHEL - Daily Trading Forecast SHEL Shell PLC American Depositary Shares (each representing two (2)
SHEL - Daily Trading Forecast
Daily price is located above 200 SMA in the bullish area of the chart. The price was bounced from 94.9 resistance level to below for the secondary correction to be started and with Stochastic oscillator to be confirmed this short term trend for example. For now, the price is trying to break the descending triangle pattern with support level at 83.7 for the correction to be continuing up to the bearish reversal support level at 77.8. Alternatively, the price will be on the secondary ranging within s/r levels of the primary bullish trend waiting for the direction of the strong bullish trend to be continuing in the case of resistance level at 94.9 to be broken to above or to the primary bearish reversal to be started with 77.8 support level to be crossed to below on the close daily bar for
0
newdigital Sergey Golubev 2026.05.15 06:54
AAPL Short Trading Idea AAPL Apple Inc. - Common Stock
AAPL Short Trading Idea
A short trading idea for Apple Inc. is based on the stock approaching a strong resistance zone around $190–195, where price has repeatedly faced rejection. Technical indicators point to weakening momentum, with RSI in overbought territory and early signs of a potential double top or lower high structure forming. This suggests the upside may be limited in the short term and a pullback is increasingly likely 📊. The trade setup is to enter a short position in the $188–192 range, with a stop-loss placed above $197 to manage risk. Downside targets are set at $180 and $172, offering a favorable risk/reward ratio of around 1:2 or better. This structure provides a clear invalidation level and defined profit zones for disciplined execution 🎯. Trade Plan: 🔻 Entry: $188–192 🛑 Stop-loss: $197 🎯 Take-profit 1: $180 🎯 Take-profit 2: $172 On the fundamental side, bearish pressure may come from slowing iPhone demand, margin compression, and broader tech sector exhaustion. However, risks remain, including strong buyback
0
m Maxim Kruglov 2026.04.03 14:11