
Ethereum is struggling below $1,800 as selling pressure and uncertainty keep the price well below the levels that defined the earlier phases of this cycle’s recovery. The decline has been persistent rather than sudden — and CryptoQuant data has surfaced a combination of on-chain signals that reveals the behavioral dynamic beneath the price action in a way that challenges both the straightforward bullish and bearish readings currently circulating.
The analysis examines three indicators simultaneously — Accumulating Retail Addresses, SOPR, and NUPL — to build a picture of market psychology rather than price mechanics. What that picture reveals is a market caught between two forces pulling in opposite directions.
Retail accumulation of Ethereum has surged to near-record levels in late 2025 and early 2026. The instinctive interpretation of that surge is bullish — more buyers at lower prices should support recovery. But the historical context the CryptoQuant data provides complicates that reading immediately. The strongest retail buying activity has historically appeared during the later stages of market cycles, at precisely the moments when larger participants are beginning to distribute their holdings into that demand.
Record retail accumulation is not automatically a bullish signal. It depends entirely on who is on the other side of those purchases.
SOPR hovering near 1.0 for an extended period adds the second layer of fragility. Investors are neither realizing meaningful profits nor experiencing significant losses — a neutral state that reflects limited fresh capital entering the market and a price structure that has not yet resolved in either direction. When SOPR stays at this level for too long, the market becomes vulnerable to the specific kind of breakdown that loss-driven selling pressure produces.
A Market That Cannot Find Its Floor
The CryptoQuant analysis adds the NUPL dimension that completes the bearish case without making it absolute. Unrealized profits across the Ethereum holder base have declined meaningfully from cycle highs — but they remain above the extreme levels recorded during the 2018 and 2022 bear markets. That distance from the historical floor means additional selling pressure remains possible if sentiment continues deteriorating. The worst has not yet been priced in from a profitability exhaustion perspective.
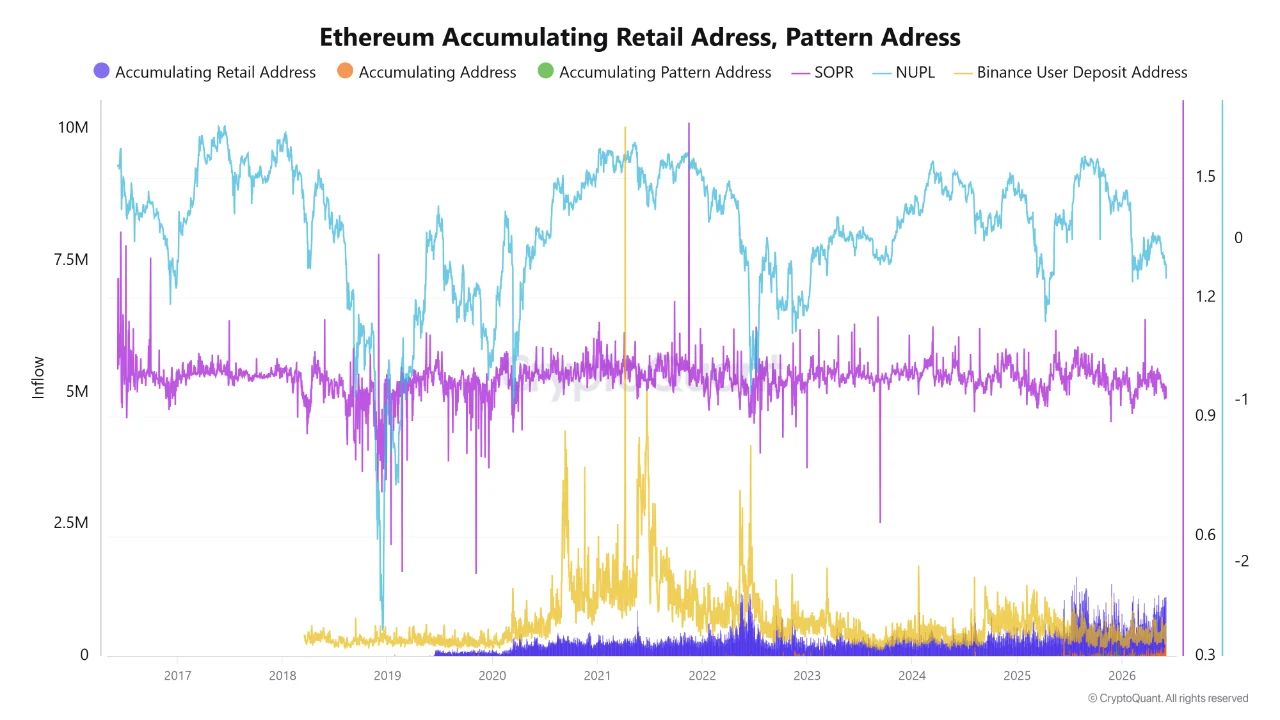
The most alarming signal in the analysis is the accumulation-price divergence. Retail investors are buying Ethereum aggressively while market strength remains weak. When exceptional demand growth fails to produce price appreciation, the explanation is almost always the same: significant selling pressure on the other side systematically absorbing every retail purchase. Whales appear to be distributing into the strongest retail buying the market has seen in years.
Binance User Deposit Addresses remaining below previous bull market peaks provide the partial offset that prevents the picture from being entirely bearish. Many ETH holders are still holding rather than sending coins to exchanges — a behavior that is slowing the pace of the decline rather than stopping it.
The forward risk the report identifies is specific and conditional. SOPR breaking below 1.0 would confirm that investors are predominantly selling at a loss — the trigger for loss-driven selling pressure that has historically accelerated Ethereum’s most damaging declines. Combined with a weakening NUPL, that combination would remove the remaining buffer between the current price structure and the kind of capitulation the 2018 and 2022 bear markets ultimately required before genuine bottoms formed.
Ethereum Breaks Below Critical Support
Ethereum remains under heavy selling pressure after decisively losing the $1,800–$1,850 support region that had acted as the final line of defense since February. The daily chart shows a clear breakdown from a multi-month distribution range, with ETH trading near $1,760 after a sharp rejection from the $2,300 resistance zone that capped every recovery attempt throughout April and May.
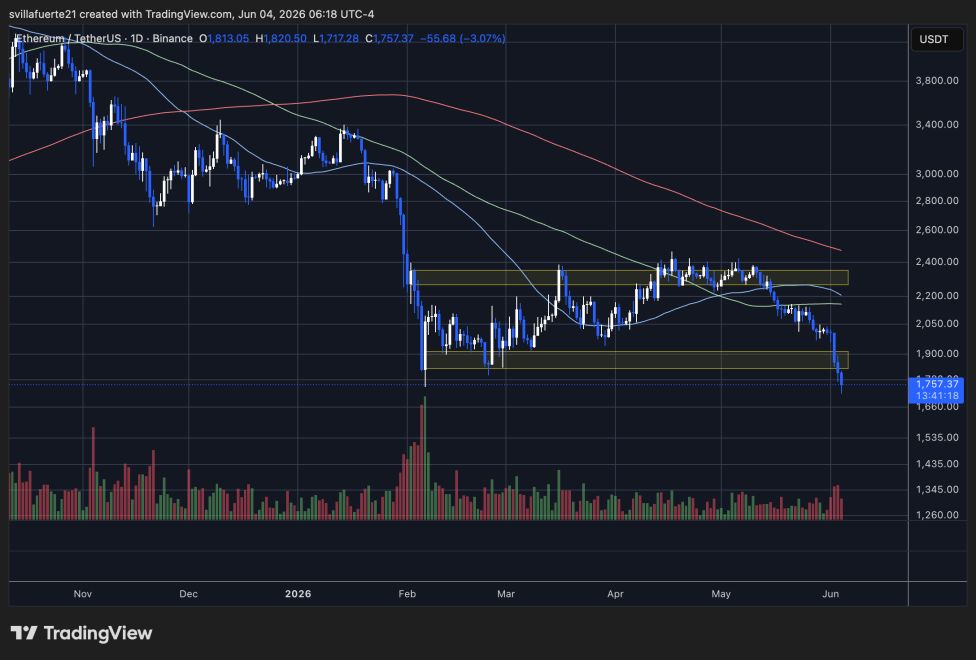
The technical damage is significant. Price has now fallen below all major moving averages, with the 50-day, 100-day, and 200-day trends aligned bearishly. More importantly, ETH has broken beneath the lower boundary of the consolidation structure that contained price action for nearly four months. Volume has expanded during the decline, suggesting conviction from sellers rather than a temporary liquidity event.
The next major area of interest sits between approximately $1,700 and $1,750. This zone marks the lower edge of the chart’s current demand region and represents the final significant support before Ethereum risks revisiting the February capitulation lows. Bulls will need to defend this area aggressively to prevent a deeper correction.
On the upside, the former support zone around $1,850–$1,900 now becomes immediate resistance. Any recovery attempt must first reclaim that level before a move toward $2,050 becomes realistic. Until then, the trend remains firmly bearish, with lower highs, lower lows, and deteriorating momentum continuing to favor sellers despite increasingly oversold conditions.
Featured image from ChatGPT, chart from TradingView.com