For somebody who lives in Ohio and works at Barchart, I am almost inexcusably checked out of the agricultural markets on a day-to-day basis.
Or, as I panicked and blurted out about 14 minutes into this interview with Senior Market Analyst Darin Newsom, “I don’t know how farms work!”
Don’t Miss a Day: From crude oil to coffee, sign up free for Barchart’s best-in-class commodity analysis.
I would love to fall back on the excuse that I live in Cincinnati, which isn’t particularly rural in 2026. But then again, I’m still only about a 10-minute drive from this Cargill grain elevator along the Ohio River.
Given my preternatural ability to insulate myself from the soybean influences of my various communities, it did take a moment for the buzzsaw of recent panicky farm headlines to pierce through my “average suburban scumbag” exterior.
Then suddenly – not unlike the swelling summertime chorus of cicadas – it reached an inescapable fever pitch:
“Farmers growing desperate amid rising energy and fertilizer prices” – Axios, May 16, 2026
“Beth Ford Wants You to Know That American Farmers Are in Crisis” – The Wall Street Journal, May 27, 2026
“Analysis: Could Hormuz be the crisis that finally makes the world rethink farming?” – Reuters, June 1, 2026
“The Farm Crisis Demands Certainty From Congress Now” – Bloomberg, June 17, 2026
I may be slow-witted in the ways of the farm, but I know a thing or three about modern journalism conventions. And four headlines is technically one more than you need for an official trend.
This kind of industry savvy, no doubt, is how I landed the role of Senior Editorial Director here at Barchart. To give you some idea of how that fits into the context of our broader business model here, it’s a bit like being the manager of a frozen banana stand right inside the gates of Walt Disney World.
The bananas are high-quality, and most visitors generally quite enjoy them, and if you ask him, the CEO of Disney could not be more excited about what the frozen banana stand is doing and what it brings to the business.
But Walt Disney is not in the banana business.
(Barchart might be; I honestly don’t feel comfortable saying one way or the other.)
In the same way, our scrappy little multimedia research & analysis shop – refreshing and well-reviewed though it may be – is the kind of thing you might find in Google’s “Other” portfolio.
I’m mixing my blue-chip metaphors here, but bear with me.
Barchart, at its core, is data – and more to the point, agricultural data. That’s the machinery that drives every other part of the business, and it’s the engine that powers non-core initiatives like Barchart editorial.
So if there really is a farm crisis, it is quite literally my business.
How to Quantify a Farm Crisis
As you might already know, we cannot always take the word of the mainstream media when it comes to topics outside their area of expertise – which is often limited to things like general news, general business, general sports, and general Taylor Swift.
That’s a cautionary note I discussed with Darin back in late March, when we dug into the real cause of soaring beef prices.
Given our collective institutional expertise, I was already confident that at least one of my colleagues here at Barchart would be able to tell me whether the “farm crisis” narrative was based in fact, or just a minor bit of midterm theater for us folks in flyover country.
Senior Market Analyst Darin Newsom was an obvious source for this article, and I wasted no time loading up his inbox with all of the agricultural clickbait I had found. (“My funny coworker,” I like to imagine Darin saying, shaking his head fondly as I drop 8 pre-interview reading assignments into his lap.)
Not only is Darin a former grain merchandiser with a very specific perspective on this issue, I also trusted that he would tell me very candidly whether there was a crisis happening, without trying to spin the situation.
But I also wanted to bring in some extra quantitative muscle for this piece. After all, if we were talking about a potential US farm crisis, I wanted to make sure I was covering my bases with all of the analytical firepower Barchart had to offer.
For this, my go-to guy would be one of the most universally feared contenders in our Barchart fantasy football league: William Osnato, Director of Commodity Data Research & Analysis.
Along with directing our data, as the title implies, Will is also heavily involved in the development of CARL, aka cmdtyView's AI Resource Lookup. Given the absolutely ludicrous amounts of data packed into our signature cmdtyView platform, CARL is our team’s way of giving users an easy entry point into any kind of query they might have – from the very simple to the complex.
However, given that I am up to my ankles in these frozen bananas, the full extent of my interaction with Will over the past 3 years of employment here has been limited to intense 1v1 matchups in our fantasy league.
So, I kicked off our conversation by letting him explain his job to me like I was 5.
Elizabeth Volk: What I was talking to Darin about yesterday is that I think I'm very much an average consumer of agricultural news, right? And I’m seeing a lot lately about how there’s a farm crisis; US farmers are on the brink of a disaster; farmers have been betrayed in an election year; and so on.
And we’ve had fertilizer supply issues this year, and fuel prices spiking, and now the New World screwworm fly is invading.
So the question is, to what extent is there really a crisis based on this broad and deep set of data that we have available to us at Barchart, and what are people like Darin Newsom and William Osnato actually watching?
William Osnato: One thing we talk about in commodities is that you can do your supply and demand fundamental analysis for years and years, but what we always say is: It's always different. Each year, something new is going on.
A perfect example this year is the Iran War, of course, but before that we had tariffs hit the market about a year ago last spring. It's always something different every time causing distortions. So then the question becomes, “How is it impacting the market?”
You can't always rely on history. We might know when the weather is bad that the corn crop is going to be impacted. But when we have a Middle East conflict that chokes off the flow of fertilizers, plus high energy prices, plus aluminum can't get out of the region – what are all of the intermarket implications?
What cmdtyView and Barchart provides is the ability to look across the markets, see where things are moving, and find out where asset relationships are being distorted.
EV: What I imagine you doing is just looking at numbers all day – spreadsheets
WO: I'm involved in all aspects of the non-exchange data. So, the futures data, obviously, but I'm involved with every aspect of the other data.
That includes the USDA data. I read a lot of Darin's articles, and I know he hates USDA data, but people look at it. We have that data. And if people need more of that, if they need cattle prices, whatever it might be – I'm listening to the customers. I'm telling Xin [Shi, Barchart’s Head of Data Science], “This is what we need.”
Xin and the data team are the ones building the pipelines and managing databases, and then I'm the subject matter expert on the data itself. So if they produce something that doesn't look right, we can go uncover the error.
I'm also the one that takes all of this data and sits down with the sales team to say, “Here's why you should take our cash grain bids, and here’s why it will be important for your futures trading, because this is what it means.” And then specifically selling some of our proprietary data to hedge funds and things like that.
Then, the big thing is this: the cash grain data, which is Barchart's proprietary data, because we work with all of the grain elevators and ethanol facilities. That's the whole commodity arm of the business, where we support those businesses by setting up websites for them and building their physical order management and all of these additional tools.
They use cmdtyView for their hedging, and then we've collected all of the cash grain bids that they're posting every day. So that is our main, or pretty much our only, proprietary data set. And it's really important.
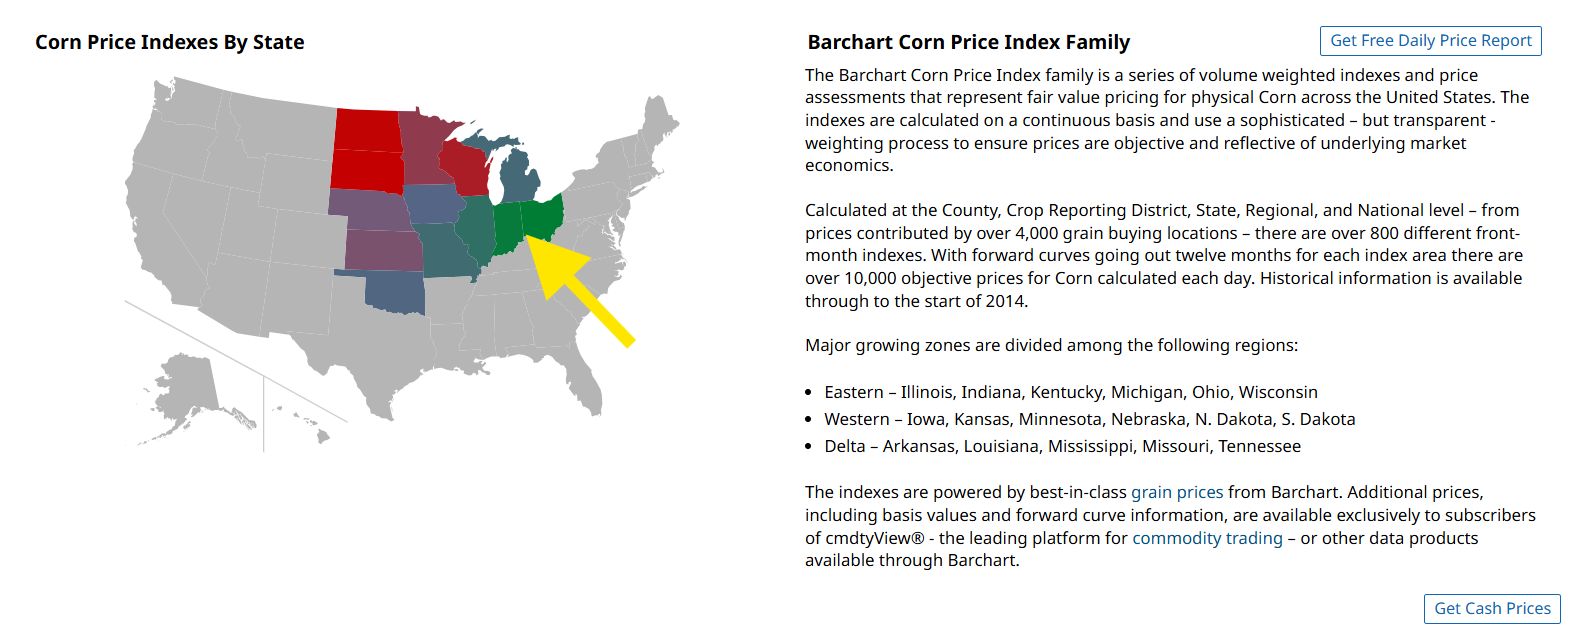 Barchart’s corn price index map, with my approximate location notated.
 WO: That's something that Darin always cites: what is the cash? What is the physical price of grain in the market? Because that tells you what the people who are really using it on the ground are thinking about the price.
How does that relate to futures markets? Futures markets can be influenced by energy prices and politics and obviously, wars.
So I need to manage everything to do with that basis, that cash data. Then we packaged it up, and we built indexes on top of it, and I’ll go sell that to a hedge fund that’s trying to come up with a trading strategy for corn (ZCZ26) and soybeans (ZSN26) and wheat (ZWN26).
One of the interesting trends we've been seeing with the institutional sales side is that some of the bigger physical trade shops – they’re very sophisticated; they have their own data teams, they pull a lot of data in – they're coming back to us and saying, “Actually, we've built up so many pipelines, it's hard to maintain it.”
It’s gotten to the point where they don't even want to pull in the publicly available USDA data, and USDA has a nice API connection that’s pretty simple. But they’re saying, “We just don't want to deal with any more data pipelines. We'd rather get as much as we can from Barchart.”
We've been seeing that more and more, which I think is interesting, because I never really thought USDA data could be a selling point. Because it's publicly available. It's right there. You can just go copy it down.
But the IT and data management teams at big companies have now built up so many other information pipelines to maintain that they're strained, and they're looking to Barchart as a single source to provide them with exchange data and fundamental data as well as our proprietary data, and sort of consolidate the pipeline in that way.
It's that same idea we’re trying to get across by deploying CARL as an AI agent: you have so much more data; you can apply more data to your decision making. You need to get it efficiently.
I nodded thoughtfully as Will spoke, took notes, and tried to pretend as though I had not just learned more about the fundamentals of our core business in these two minutes than I had in the entirety of the past two years combined.
With my expert sources firmly in place, Team Barchart was ready to address the farm crisis.
Corn as Crisis Indicator
Why start this analysis with corn?
Because it would be ludicrous to start with frozen bananas, first of all.
I’ll let Darin Newsom explain the rest.
Elizabeth Volk: I sent you a lot of headlines about farmland being in crisis. Do you think corn is a good indicator overall of that being true or not?
Darin Newsom: I've always thought so.
The US is the largest producer, exporter, and user of corn in the world. You know, land values are tied to how much corn can be produced. Everything in US agriculture seems to be tied to corn.
It's also not psychotic like what we see sometimes in soybeans and certainly see almost every day in wheat. So it's a little bit easier to read and a little bit easier to see its mood changes from bullish to bearish and neutral and so on.
So yeah, I do think it's a good indicator for US agriculture as a whole.
OK, that settles that.
But what do we look at when we “look at corn”?
There are a few different options for first-level analysis. We have those aforementioned cash prices (what people are paying now); and then there are futures (what people are willing to pay in the next month, or many months out), and then there are futures spreads (the price difference between a pair of futures contracts).
EV: So if I'm someone – I'm not saying this is me, but my good friend; I know what a spread is, right? – what are you looking at in terms of actual numbers when you’re referencing spreads as an indicator?
Will Osnato: The basic theory is that it should be an indication of how well-supplied the market is. If it's a normal amount of supply in a commodities market, then each forward month should be priced a little bit higher, because that's how much it costs to store the commodity and deliver it a month from now.
So it should theoretically be the case that one month's worth of storage cost is the difference in price. When you have plenty of supply, and no one needs more supply right now – there's no shortage; there's no crazy abundance – then it should be in a nice sort of straight line. And then it's just basically storage costs.
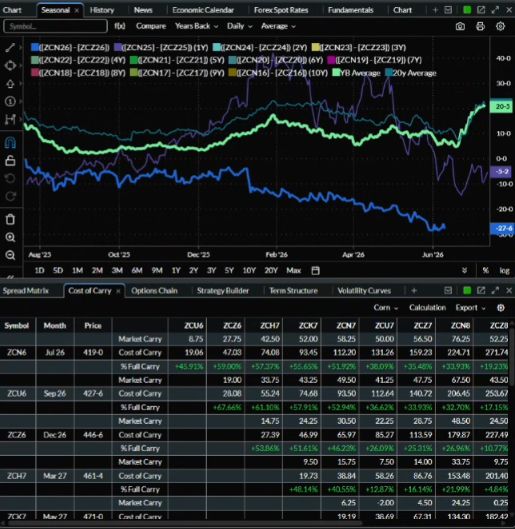
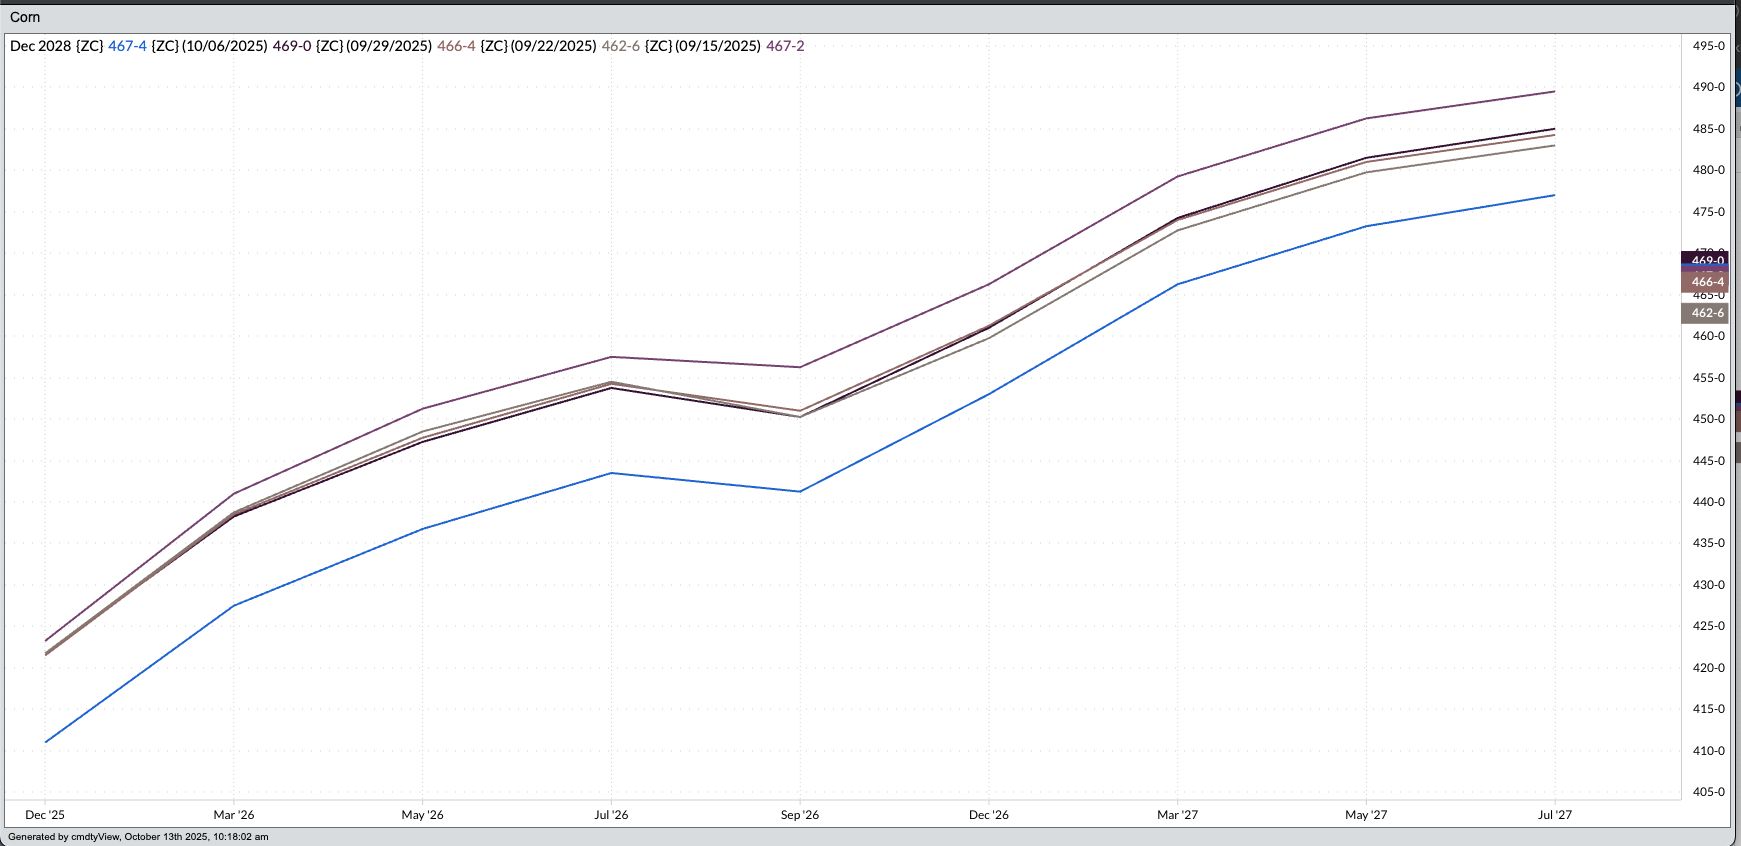 An example of futures spreads in contango, or carry.
 WO: If you have so much supply, then you bring it even further down because you want people who were going to buy three months from now to buy now instead because there's so much supply, you need to move it.
And the inverse, which is what you see in the oil market, it's inverted. The price right now is so much higher than the price six months from now because there is a shortage. And what the spreads are telling you is: if you can wait to buy, you should wait. Don't buy now. It's much too expensive now. If you can wait six months, it'll be a lot cheaper.
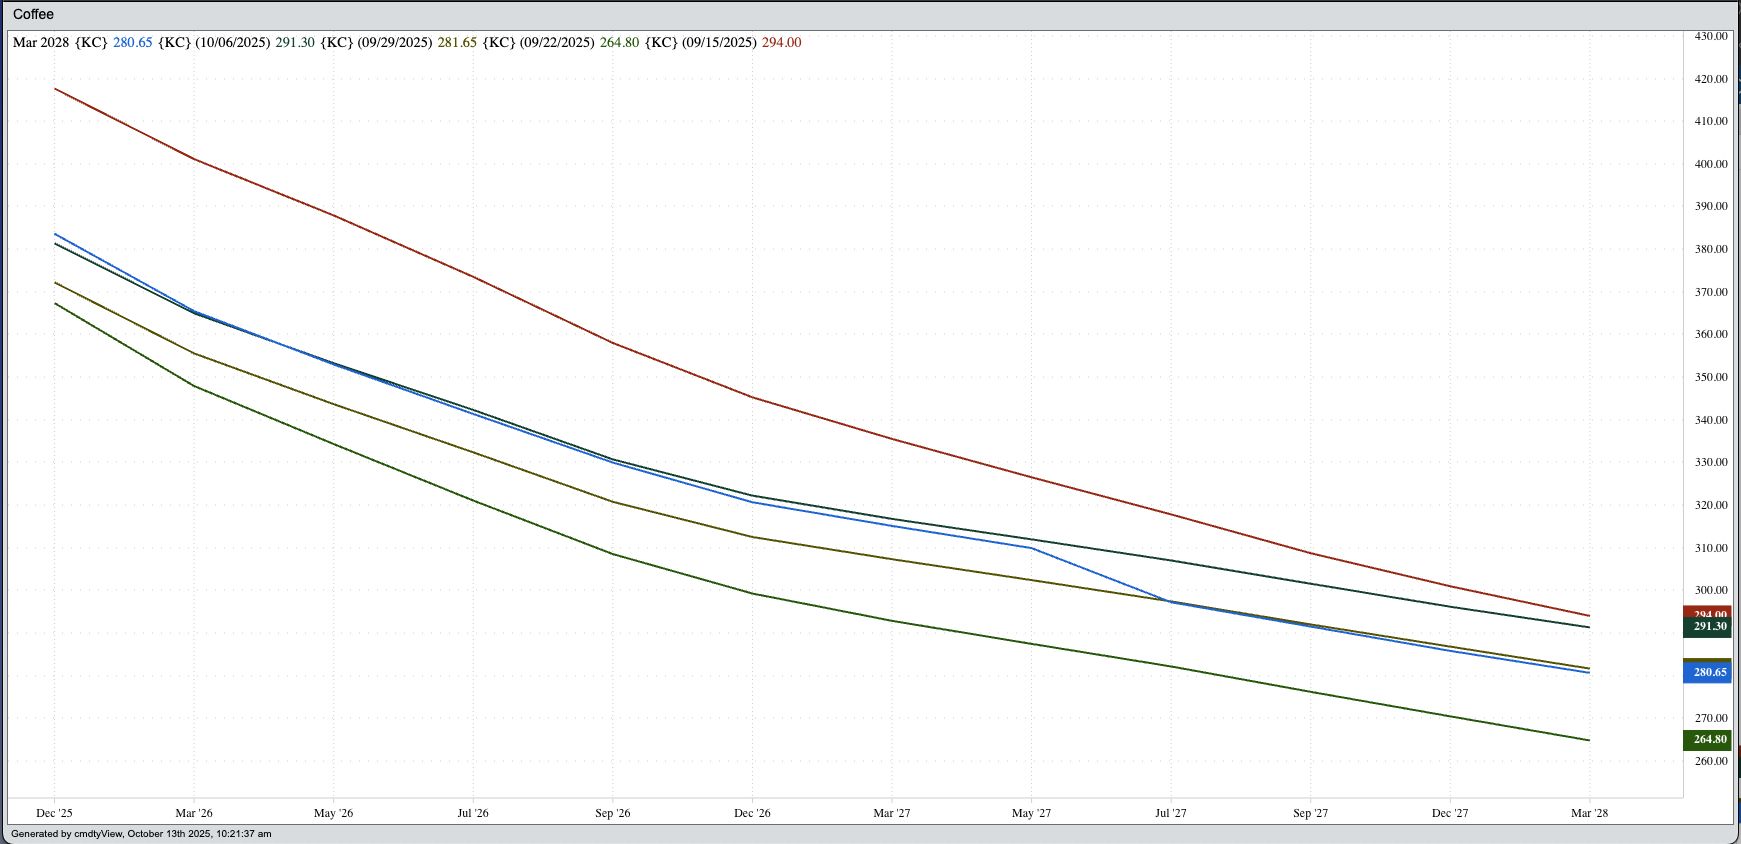 An example of inverted futures spreads (backwardation).
 WO: So it’s the movements of those curves. And I know Darin talks about this just like the spread, he always says that’s telling you whether or not the market is well-supplied or tight, because that's what it is. It's like, what is the shape? And then, of course, the second order of that, which is how is that shape changing?
[At this point, I interrupt because I am very nearly bursting with a question about the correct futures jargon.]
So, what I was going to say is that Darin posts this a lot. He uses this cost of carry because he likes to understand this percent of full carry. I'm going to let him go with that, because Darin's got institutional knowledge of what these percentages of full carry mean, and he's got long-term charts of those.
But if you wanted to do just something simpler, you can look at the spreads on a seasonal chart, or time spreads within a commodity, and you can also look at spreads between commodities.
For example, the spread in the blue line. Where is that relative to the neon green line, which is the 10-year average? And then I have the 20-year average. Oh, well, I can see right here, spreads are very weak compared to the average. Well, that just told me something about current performance compared to historical norms. And the seasonal chart, then, is really good at identifying the significance of, how much out of normal is that? Which is one of the things I was looking up also.
 Never trust the media not to screenshot your workstation, Will.
 With a relatively firm grasp on our corn data and accompanying indicators, let’s see what Darin Newsom makes of the situation on the ground right now.
EV: What are you seeing in the corn market right now? I know that's a big one for you.
Darin Newsom: Yeah, I'm seeing a very similar pattern to what we saw between 2014 and 2020, which was sideways with some spikes. And we're following along that same similar pattern. It looks like we posted a high around April or May, and now we're heading down.
Number one, we rallied this thing on the Super El Niño talk and the lack of fertilizer and all of these sorts of things. But now the reality is setting in that the crop's doing just fine; it's going to produce. And we've got the December contract coming back down right now.
Again, this is just corn's long-term pattern. We could see it back off for a little while, particularly as these storm systems continue to move across the plains in the Midwest.
So it looks like it's going to continue to sink at least for now. And it's going to be tough. It's going to continue to be tough for a couple years. So we'll see.
In this sort of situation, something tends to happen that changes the supply-demand situation. And maybe next year, it's the lack of fertilizer. We're still a long way from this, but maybe the US plants fewer acres of corn next spring. So a lot of things could still happen.
If I look at the future spreads, there's nothing overly bearish about the long-term outlook for corn right now, but it's not bullish either. So it just, again, all plays into the idea that we're in a range here. We're probably going to stay that way for a while until something changes fundamentally.
EV: So it's pretty much telling you that there's really no more of a crisis than usual.
DN: Right. It's telling me, there's no real issue right now.
Before I let him continue, I’d like to mention that there is a significant catalyst coming up for corn at the end of this month. It’s one that both Will and Darin are watching, and it could move cash and futures prices.
Will Osnato: At the end of June is a really important report, which is the acreage report from the USDA. That will give us a big update about what the farmers actually planted. You never really know.
We get a survey of farmers at the end of March with what they intend to plant. It's called the Prospective Plantings Report. At that time, nobody has put a seed in the ground yet. It's very early season. The one at the end of this month is the big update three months later after they've planted.
It's not the final numbers, and they could still move around a little bit, but it's much more concrete than March.
So are we going to come into this report and suddenly find out that farmers planted 2 million fewer acres of corn than we thought? Now, actually, I think that will be what the market will sort of anticipate. But that report comes in and can throw a curveball at the market.
Which brings us to an important point about how cash and futures prices move in the corn market, and why.
EV: Would you be looking for that report to have an impact on corn futures spreads at all? Do you think it's going to be that much of an impact or not?
WO: Yes, because if it's important enough to move the futures, like the flat price at all, it will move the spreads.
This new acreage report will impact the December and contracts further forward. The December contract is your new crop contract, so it's moving for different reasons than the July contract right now. And so the spreads at the front of the curve, if you're using the July contract, you’re really talking about the old crop versus the new crop.
If things are important enough for corn, all of the contracts will go up, and all the contracts will go down. But when you start to get into more specific things like, “Export sales of corn are really strong right now” – well, that's old crop. That will impact July more than it will impact December, because December really cares about the weather.
But if it's really dry, all the contracts are going to go up. It's not like the nearby contracts are just going to ignore it because it’s the nearby – and that's more a matter of markets flow, because it’s where you'll see the volume. Most people are trading July [right now], regardless of the reason, because it's the most liquid contract. So they'll all move together.
If you get an acreage report that loses 4 million acres and everybody goes crazy on corn, all the contracts are going to go up.
All of which, if I do say so myself, is excellent context, and worth the minor interruption to Darin’s corn future spread analysis.
I’ll let him continue here, though, now that we’re all armed with a firm grasp on the corn calendar.
Darin Newsom: Even if I use the Sept-Dec [spread], since September is a hybrid futures contract – it's part old, part new, because there are parts of the Southeast that are already going to be harvesting, and pricing against the September contract, so it does have that element.
But the general market view is that the December contract is the initial new crop contract because of how the marketing year runs. And I don't believe in marketing years either, but that's a different story.
Either way, the marketing year runs from September through the next August. So if I look at the Dec-March, it's close to 50%. If I look at the March-May, it's about 42% today. And then we drop off to the May-July at 30%, where that starts to bring in South America.
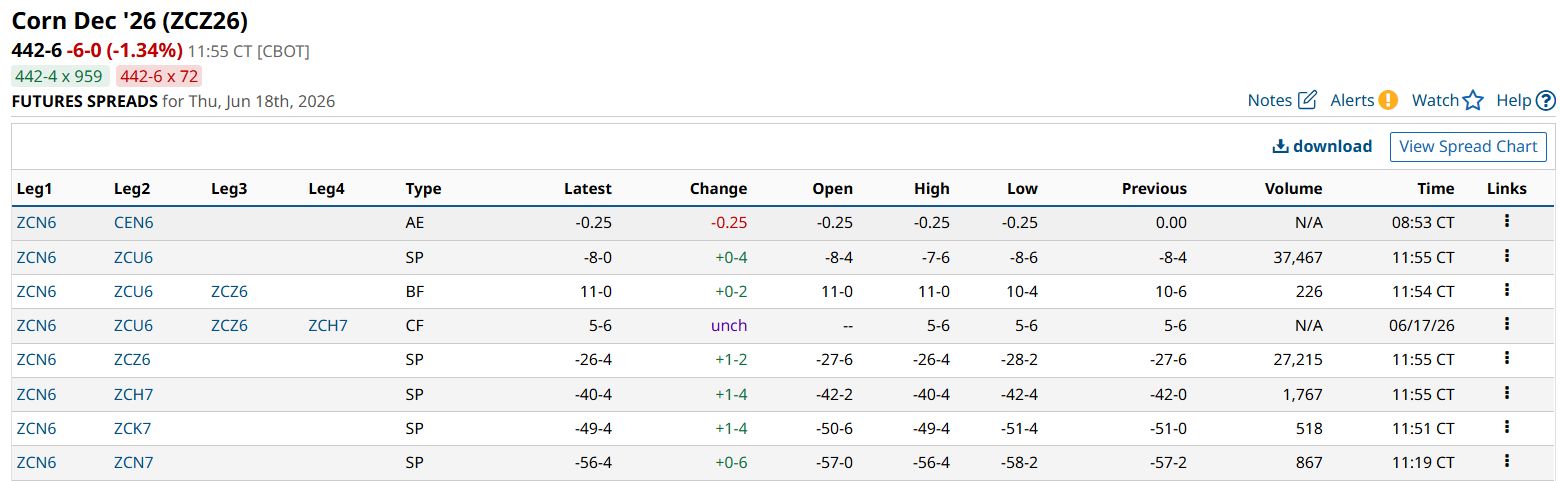 Corn future spreads at a glance (use symbol ZC*0 to pull the default).
 DN: The fact that the December is sitting right at straight-up neutral, 50%, tells me a couple of things. One, the commercial side, the merchandisers – number one, they're not overly concerned about supply in relation to demand. They're relatively noncommittal at this point.
And so, given the fact that funds built this huge net long and now they're in the process of getting out, basis is still neutral. I'm going to say it's still weak compared to history.
We know the market has plenty of supplies to meet demand, and the only ones really doing anything right now are funds. This could change as we get deeper into the growing season or the summer quarter. And then as we head towards the end of the marketing year and into harvest, this will certainly change. As we look at that December, March-May spread, right now there's just no indication [of a crisis].
It's not like we're seeing an inverted spread; it's not like we're seeing a very tight carry; a very small carry indicating that there's concern over supplies in relation to demand. Just isn't there right now. It could get there. But if the weather continues, I would almost expect the carry to continue to strengthen, particularly in that December spread.
Now, we’re not quite done with corn yet – Will still has a custom cmdtyView grain indicator in his back pocket that’s going to segue nicely into a conversation about the weather, of all things – but before we graze too far afield, there’s another crisis-level conversation happening around US agriculture.
With meatpacking monopoly breakups still generating headline buzz ahead of midterms, here’s what the meat market is telling us now.
Why the New World Screwworm Fly Won’t Spark a Cattle Collapse
On the off chance that your algorithm is quite different from mine, you might be asking yourself at this point: the New World what now?
Since I don’t have a Webster’s Dictionary handy, I’ll defer to our very own USDA for the definition here, along with a touch of context:
New World screwworm (NWS) is a serious pest of livestock and wildlife. USDA is leading a coordinated One Health response to combat NWS. This is not a food safety issue—the U.S. food supply remains safe. The current risk to animals and people in the United States is very low.
And now here’s a sampling of recent mainstream media headlines on the topic:
New World screwworm: What pet owners should know – Reuters, June 18, 2026
US screwworm cases rise as outbreak spreads beyond initial contamination zones – The Guardian, June 16, 2026
Trump reviews slowed screwworm response, former officials say – Politico, June 17, 2026
This Flesh-Eating Fly Is Making an Unwanted Comeback – The New York Times, June 5, 2026
Just from these four headlines – again, one more than we need for an official trend – you could be forgiven for assuming that the screwworm situation is a COVID-scale national health disaster.
I’ve included links so that you can refer to the source material as you like, but these are all solid examples as to why we cannot trust mainstream media with our agricultural news.
Your pet is likely protected already and if not, should be fine with antibiotics; The Guardian’s “outbreak” references all of a dozen cases; and the NYT includes a solemn parenthetical mentioning that “the Latin word ‘hominivorax’” translates to “‘man eater.’”
Somewhat predictably, the outlet called Politico is most nefarious of all, claiming that “Months of initial delays, combined with the exits of dozens of experienced USDA staff amid efforts to shrink the federal workforce, risks seeing the pest spread beyond Texas and New Mexico — potentially resulting in billions of dollars in damages to the cattle industry, according to a USDA estimate.”
The emphasis is my own, because it took me some digging to drill down on that particular number.
As it turns out, it’s not a current prediction related to what’s happening right now. The source, conspicuously not linked in the article, but provided for you here, is this USDA report, and it carries a significant caveat:
The results of adjusting for inflation indicate that an NWS outbreak roughly the scale of the 1976 outbreak could cost Texas producers $732 million per year and the Texas economy a loss of $1.8 billion. Numerous factors make this comparison, over 40 years after NWS eradication, difficult. Texas’ cattle population in 2024 is significantly larger (12 million), while the sheep and goat populations are lower (655 thousand). There are a multitude of other factors that could affect the economic impact of NWS in 2024 and require further quantification, including husbandry and veterinary practices, economic output multipliers, costs of response activities, and potential NWS infection rates.
So if we had another outbreak as extreme as 1976, $1.8 billion is how much it could potentially cost, but no one can really say for sure, because it’s been half a century since then.
At the risk of introducing yet another agricultural product to the conversation, that’s what we like to call a “cherry-pick” in the data business.
As for beef, it might be one of our favorite national commodities, but here again is where I fail my reader, my neighbors, and my employer: I do not, in fact, eat cow.
Luckily, we still have Darin Newsom.
If you haven’t read our prior discussion about the various factors driving beef prices, catch up on the back story at Barchart’s official Substack.
Here’s what Darin is watching in the age of cattle contagion.
EV: Has it been really exciting with all the screwworm news?
Darin Newsom: When this all started to pop up, I asked my good friend in the cattle industry Kyle about it, and I loved his quote: “So what?”
You know, it doesn't matter. It doesn't change the fundamentals of the situation at all.
But the media has to talk about it, and they have to make a big deal of it. They have to do the Weather Channel effect on it, and it doesn't mean anything, but it sure is a big story.
EV: Is it like the Super El Niño?
DN: This is one of the wettest El Niño droughts I've ever seen in my life.
EV: Yeah, it's been a real Super El Niño here today.
So I was looking into it before our call and the headlines are definitely very panicky. But it's not that serious, right? If this is your business, day to day, you're more concerned, like you said, about the fundamentals that have been going on for –
DN: Yeah, it doesn't affect the meat. So the US consumer isn't going to be affected by this at all.
And it isn't widespread enough to say, “Oh, this is just going to destroy the smaller herd that we have anyway.”
A few cattle are going to have to get put down. A few cattle die every day anyway from heat or whatever.
I mean, let's talk about that. It's hot here in the Central Plains. I mean, it's hot. There's a lot of cattle here sweating.
EV: So I guess, then, where do we go from here with cattle? Because I know they're still trying to push this meat-packing breakup that we've spoken about before.
DN: That's another non-issue, right? We do not have Teddy Roosevelt in the White House at this point. They're not going to break up the small group of packers, so we're going to go about business as usual.
All this hullabaloo does, as we've learned over the last 10 years, is to create a distraction from the real issues. And the real issue is, how long will US consumers continue to buy high-priced beef when they're being forced to pay more for fuel? They're going to have to make a decision on fuel or high-priced beef. I've been saying this for a while now.
Consumers are not backing away from beef ($CBBI), the US being what it is. They're still buying beef. I still think at some point we're going to hit that tipping point and US consumers are going to have to make a decision.
So we hear all the nonsense about how, “We’re going to lower beef prices, we're going to do this, we're going do that,” and none of it is ever real, and none of it ever works. And you know, the reality is, we are not going to increase supplies anytime soon, and it's going to come down to the demand side of the equation.
And at this point, the US cattle industry has done it just right, because it understands. It understands economics.
It understands if you're making money at a time when supplies are running relatively tight and demand has stayed strong, why would you screw that up by increasing supplies?
It goes back to the lessons of OPEC. And I tell you what, if you tell any cattlemen that they're acting like OPEC, they'll probably string you up, but that's exactly what they're doing.
For decades the line was, “Price is going up, but supplies are adequate.” I even wrote pieces that use the word adequate. You know, it was brilliant. It's brilliant. They're not going to make a move. People are still using their product.
But I'm starting to hear some rumblings and some whispers on the wind that heifers are being retained. And so, down the road, it does start to hint that we could start to grow this herd size just as demand starts to go away.
Which would be an interesting situation, indeed.
As for Will, he doesn’t typically follow cattle futures too closely, but he knows an easy way to get a quick read on the market.
Will Osnato: If we’re talking about the headlines for screwworm and cattle – well, let me go to my cattle page and see what the futures prices (LEQ26) are doing. I don't normally look at cattle, but I do have a page for it. Let me see what the spreads are doing and educate myself quickly to see if there's something interesting going on.
And that's where the toolset of cmdtyView and having access to that data in a user-friendly interface is so helpful. You can go to Barchart.com and look up what the current price is, but I don't want to just see a chart of the price. I want to pull up a seasonal chart to see that, oh, actually, cattle prices are supposed to be up at this time of year. So that's actually not new, because they're going up today, and they're supposed to be doing that.
Then, what are the spreads doing? Are those spreads OK? Those spreads look wide. But is that normal, or not normal? Using some of these tools that you have at your fingertips to take advantage of scanning the market quickly, then you can say you actually know that the headlines around screwworms didn't actually change anything in the market.
There have been some fundamental reasons why cattle prices are super high. Those are still in place. So nothing new is happening.
In fact, says Will, the most common use case he sees for CARL seems to be getting a high-level read on what’s happening in any given commodity market.
WO: I'm helping our engineers really stress-test the responses and which model we should use. So I actually look through almost every day what our users are asking CARL, and one of the most common questions is just, “What's going on in the market today?” – whether it’s the corn market, the oil market, cattle – and this is from all types of different clients, that's by far the most common type of question.
And it does a good job because it's reading Barchart News, where we have plenty of commentators talking about the markets. It also performs a general web search and it gives really quite good summaries of what's going on in the market. That can really help you get oriented if it's a market you haven't been paying attention to for a while.
For example, a lot of ags people don't necessarily pay attention to oil, but they've had to start following that since February.
Aluminum prices are another perfect example. We have a client I spoke to who is exposed to aluminum. That’s not something I would normally look at, but it's near record highs.
To get myself quickly up to speed, I asked CARL, “Why are aluminum prices near record highs?” And it gave me a five-paragraph summary highlighting each catalyst.
Some of them have been years-long stories, you know – the data center build-out and energy grid demand; OK. But there was also a recent policy action in China shutting down smelters, and then the most recent Strait of Hormuz closure impacting supply. So, aluminum and aluminum precursors are not getting out of the Middle East, and that's leading to LME stocks declining.
So you can have these workspaces set up, CARL can summarize some news quickly for you, and then you can start digging into the data across the workspaces in cmdtyView. Or do your extra research if Barchart doesn't happen to have the data you need, but we have a lot of it to get you started.
EV: That's such a great use of it, you know – like a little research assistant.
WO: And all of that, again, is to expand the user's ability to cover more ground, because there's so much data out there and you just have limited capacity.
EV: To your point, there's so much going on. Where should you focus your attention and why? You know, just give me the elevator pitch.
WO: One of the reasons CARL works is that we're feeding it really good data – because we have excellent market data, we have news, we have a platform that works. So it's being fed good data and we're constantly testing it and working with it.
AI is so popular right now, but any AI tool is only as good as the data you’re feeding into it. And that’s where Barchart can fit in, because we’ve been in the business so long that we’re able to build this agent on top of a really solid bedrock of data.
EV: Right, everybody’s vibe coding the next great financial app, but with what data? And that quality data is so key to really cut through a lot of the hype we’re seeing in some of these mainstream headlines around the ag industry.
Before we get too far off cattle – there's a lot of talk about breaking up the “meat-packing monopoly.” In terms of how beef prices work, does this make policy sense? Or I guess, is it addressing the correct data inputs?
WO: I saw some of that. Where it actually first really started coming up was during COVID, when you saw logistical issues being so concentrated. I didn't think the concentration of the industry was the reason beef prices were so high.
There were some droughts. The inputs from back in that 2020-2023 period of very high corn prices, droughts in the hay, and ranching regions created a multi-year drawdown of the cattle herd. And now we're at the nadir of the cattle herd.
But demand for beef is still good. So cattle prices are super-high. And that's very explainable to the natural multi-year cycles of the inputs and then the demand.
So if you're talking about breaking up the concentration of the industry, it’s more of a supply chain vulnerability concern than, say, monopolistic behaviors in my mind.
EV: We've seen how much supply chain vulnerabilities can really move commodity prices, haven't we?
WO: For sure, for sure.
EV: Ah, what a decade it's been.
Of course, it’s not just the cattle market that feels the impact of droughts.
Before we wrap up this Farm Crisis Report, we need to check the weather… sensitive commodities.
Soy, Wheat, and the Weather
Back at the top of our interview, Darin Newsom referred to the soy market in a manner that would get me flagged for non-inclusive language by the AI software our marketing team has added to their video calls. (They operate the air-conditioned souvenir shop located across the monorail tracks from our frozen banana operation.)
But why would he say such a thing?, I wondered.
EV: So, to get into soy – when you say that soy is “more psychotic,” is it a thinner market or just more sensitive to weather or other outside factors?
Darin Newsom: I think the key is what you first said. It's a smaller market.
Corn has more open interest. It has more trade volume. So I always like to compare it to the bond market and the way bonds trade.
You know, bonds are an enormous market. It takes a lot to get a big swing going in bonds. And corn's the same way.
In soybeans, it's a little bit thinner. It's a little bit smaller.
So you get a piece of news, or a fake social media post about a deal with China, and then all of a sudden, you might get a thousand algorithm orders buying – and that's enough to cause a spike. It would probably pass by, or maybe cause a penny or two difference in corn, but it could cause a 10 to 15 cent spike in soybeans, just because of the difference in trade.
And it is more susceptible to weather. Particularly South American weather, because the US took itself out of the game. The US is no longer a major player in the global market. It's a secondary player.
So what we really have to watch is weather in South America, particularly Brazil. That's just more volatile than what we tend to see here in the United States. So that certainly comes into play almost every year.
Right now, confirms Will, weather is the headline story.
EV: [actively spying on Will’s setup] So, what is the soybean/corn ratio telling you? Because those are huge markets for U.S. agriculture, right?
Will Osnato: That's important during planting and ahead of planting. So, February is actually the most important month, and then right as they're planting, which is mid-April to now, but they're pretty much done planting at this point.
So we're already focused on weather. It's because the crop is in the ground, so we're starting the weather season. So, for the next three months, US weather will be the focus for corn and soybeans.
But if it’s too late in the season to use your favorite indicator, you can always scan your cmdtyView tabs for interesting outliers.
WO: I have all of my tabs here of all the different markets in cmdtyView, and it’s like, I just want to scan. Let me scan. What's interesting? Let me go look around.
One of the things that had caught my eye the other day was that Minneapolis wheat was less expensive than Kansas City. Minneapolis wheat is the highest protein wheat, and Kansas City is the middle tier. So Minneapolis should always be more expensive than Kansas City.
If I pull up this 20-year chart – so, this is your zero line right there. Like it's rarely ever below zero. That's below zero right now.
When you look at a quick seasonal chart, again, it sort of jumps out that normally it should be 70 cents over, but it's 13 cents under. And this is such a departure from both last year and from what’s normal.
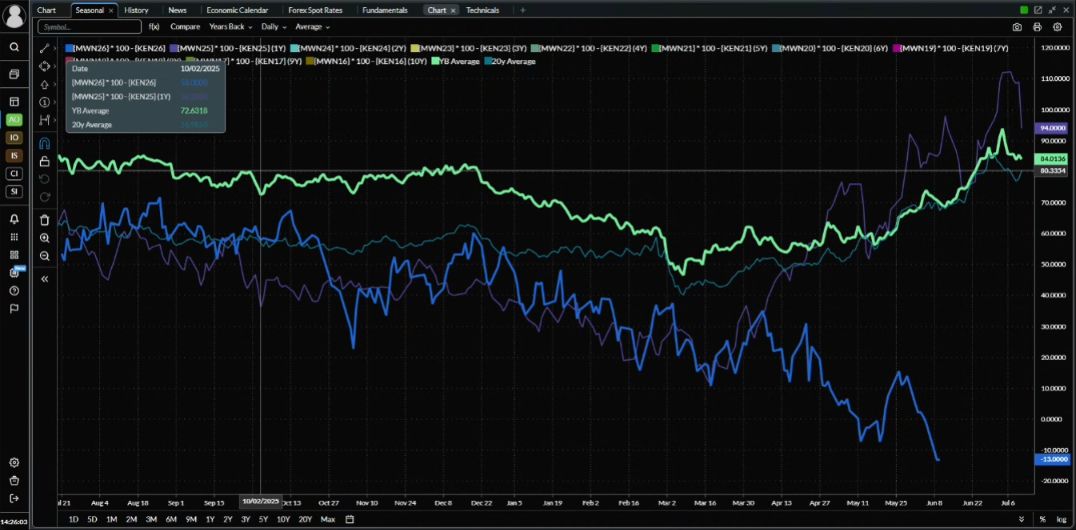 Confidential Barchart work product? Maybe!
 And then you can start exploring the fundamental reason why. It's because Kansas, Oklahoma, and Texas are having a major drought. So there's a shortage of that type of wheat versus the spring wheat, which is grown in North Dakota, and North Dakota is planting now, and looks good. So now this spread has flipped, which is really rare.
EV: I mean, you really can just eyeball it, right? That's massive.
WO: Just being able to have this seasonal chart – it’s something I think people don’t even necessarily take advantage of as cmdtyView users. They just default to the normal chart. Everybody looks at your 3-month chart, your 6-month chart, or whatever.
And it's like, “OK, yeah, it's been going down. That's interesting. But by how much? And how much compared to last year? How much historically? And how much compared to the average?”
That's where this seasonal chart – let alone all of these other little tools and tricks and bells and whistles that we have in here – is just like the second level down where this is already a lot more powerful than just the straight market data you were already getting.
In markets that quite literally change with the weather, that depth of analysis really does seem like a difference-maker.
For the record, at no point during our nearly hour-long conversation did Will seem like a man in the throes of an industry-wide professional crisis.
From the Farm to the Bunker: A Final Thought
As a matter of fact, I walked away from my deep dive with Darin and Will more convinced than ever before that (a) there is no more of a farm crisis than usual this year; and (b) no one should read mainstream agricultural coverage for any reason other than to debunk it.
To be sure, there are challenges facing the agricultural industry this year, but they’re not likely to be the same ones the average consumer has read about it via clickbait. And they’re very unlikely to be solved by any of the current policy proposals being floated ahead of the midterms.
In fact, I was reminded by my discussion with Will about a McKinsey report showing that farmers are increasingly looking to agtech solutions to help drive more value as input costs soar. Until we find a way to control viruses, plants, large animals, and the weather, investment in agtech might be a policy worth considering – at least, according to this frozen banana expert.
But [Disney movie trailer voice] in a world constantly on the verge of crisis, Darin points out that there’s still one safe haven in the commodity space… you just can’t cultivate it on a farm.
EV: Are there any other markets you're watching?
Darin Newsom: If I'm a long-term investor, I'm going to stay long gold (GCQ26). If I'm a central bank, I'm long gold. I don't care what the market does week in and week out.
And this goes back to: I could apply technical analysis, I could apply fundamental analysis, trend analysis, I could do all these things, and none of it mattered. But the bottom line is: Gold isn't suddenly going to collapse back to where it was 30 or 40 years ago.
Central banks are still heavily invested, but there's going to be a lot of movement that I can't predict week in and week out. I think we see that in the metal sector as a whole. Silver (SIN26) has certainly gotten wild; copper, platinum, palladium, all of these things.
So I've kind of backed away from that sector for a little bit, but from a personal investment point of view, I wouldn't have any fear being long gold.
EV: That seems to me like a story where you've got a lot of speculative money going in that was piling on top of the institutional money. And so when there's something else exciting that comes up, they're gone, right?
DN: Yeah, exactly.
But the institutional traders aren't going to change their mind. They still know there’s real risk in the world with geopolitics and sovereign debt and everything else out there. They're going to continue to buy gold.
– This interview has been condensed and edited for clarity. For more insights from Senior Market Strategist Darin Newsom and Director of Commodity Data Research & Analysis William Osnato, follow Barchart on LinkedIn and subscribe to @BarchartSolutions on YouTube.
On the date of publication, Elizabeth H. Volk did not have (either directly or indirectly) positions in any of the securities mentioned in this article. All information and data in this article is solely for informational purposes. For more information please view the Barchart Disclosure Policy here.
More news from Barchart
The Cows of Wrath: Here’s What Corn, Cattle, and Quantified Data Are Telling Us About a US Farm Crisis Is the 2026 Soybean Rally Over? Why is Thursday Friday, Technically? Why Soybean Meal Is a Value Buy Here as Prices Rebound