

NVDA
#1
NVIDIA Corporation - Common Stock
226.3 2 USD
-0.01%
Market Price
Sector: Technology
Base: USD
Profit Currency: USD
Daily Range
Year Range
Daily Change
-1.29%
Monthly Change
+7.22%
6 month change
+18.60%
Year Change
+22.48%
Previous Close
229.2 8
Open
228.7 3
Low
224.9 2
High
228.8 6
Financials
Value 202020212022202320242025 TTM
News
Mastercard Surges Near 2026 High, Leads 10 Hot Prospects To Best Stock Lists
Frenzied Stock-Options Trading Shows Individual Investors Are Still Hungry for Risk
Nvidia and AMD shares fall as new AI announcements fail to re-energize investors
The Line That Could Pop the AI Bubble
Dow Jones Futures: Micron, Nvidia Lead AI Trade Lower; Apple, Meta Rally Near Buy Points
Nvidia (NVDA) Sees a More Significant Dip Than Broader Market: Some Facts to Know
Navitas Semiconductor Stock Rises After Hours: Here's Why
3 Best ETFs to Bank on for an 11% Gain, According to AI Analyst - TipRanks.com
Navitas Semiconductor Announces 24 Kilowatts, 800 Volts To 12 12 V DC-DC GaNFast-Powered Power Delivery Board Developed In Partnership With Nvidia
Stock Market Today: S&P 500 Bull Market Turns Four Years Old ahead of Big Bank Earnings - TipRanks.com
S&P 500 Dominated by AI Stocks, Adding SpaceX Would Create History Last Seen in 1880s
Charts & Ideas
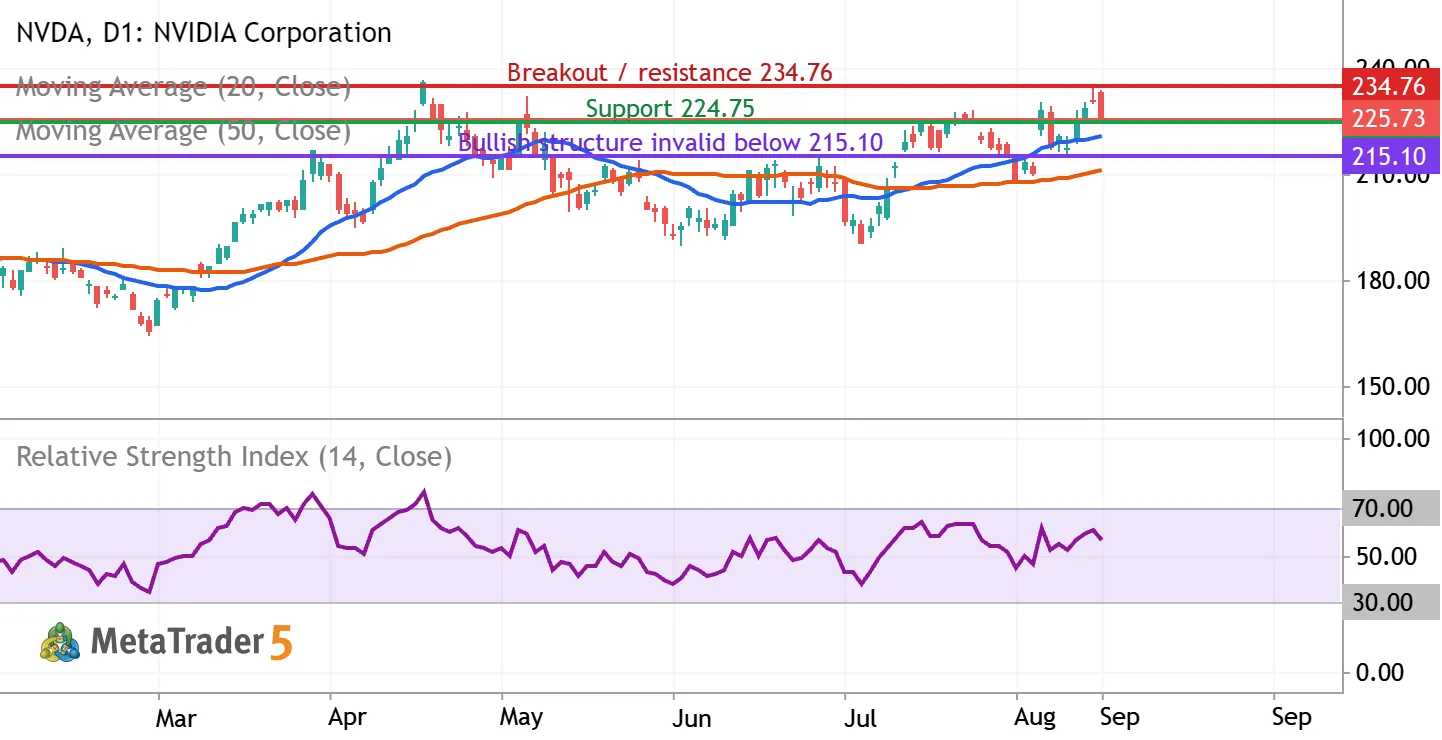
NVDA: testing $225 support as the uptrend meets $234.76 resistance
NVIDIA (NASDAQ: NVDA) | Daily chart | September 9, 2026 Bias: conditionally bullish over the next 2–6 weeks. Entry confirmation is still required. The latest completed regular session, September 8, closed at $225.73, down 2.01%, after reaching $233.71 intraday. The close near the session low signals selling pressure despite the broader recovery. What the indicators show The chart includes a blue 20-day simple moving average, an orange 50-day simple moving average, and purple RSI(14), all calculated from closing prices. At the latest completed candle, MetaTrader showed the averages near $220.48 and $211.22, with RSI near 56.19. Price remains above both rising averages, and the 20-day average is above the 50-day average. RSI above 50 supports positive momentum, but its reading below 70 is


The NVDA doesn’t have other trading ideas at this time
Browse ready-made trading ideas or select a symbol and create your own
Go to Charts and Trading Ideas