EURUSD H1 ANALYSIS EURUSD Euro vs US Dollar

EURUSD H1 ANALYSIS

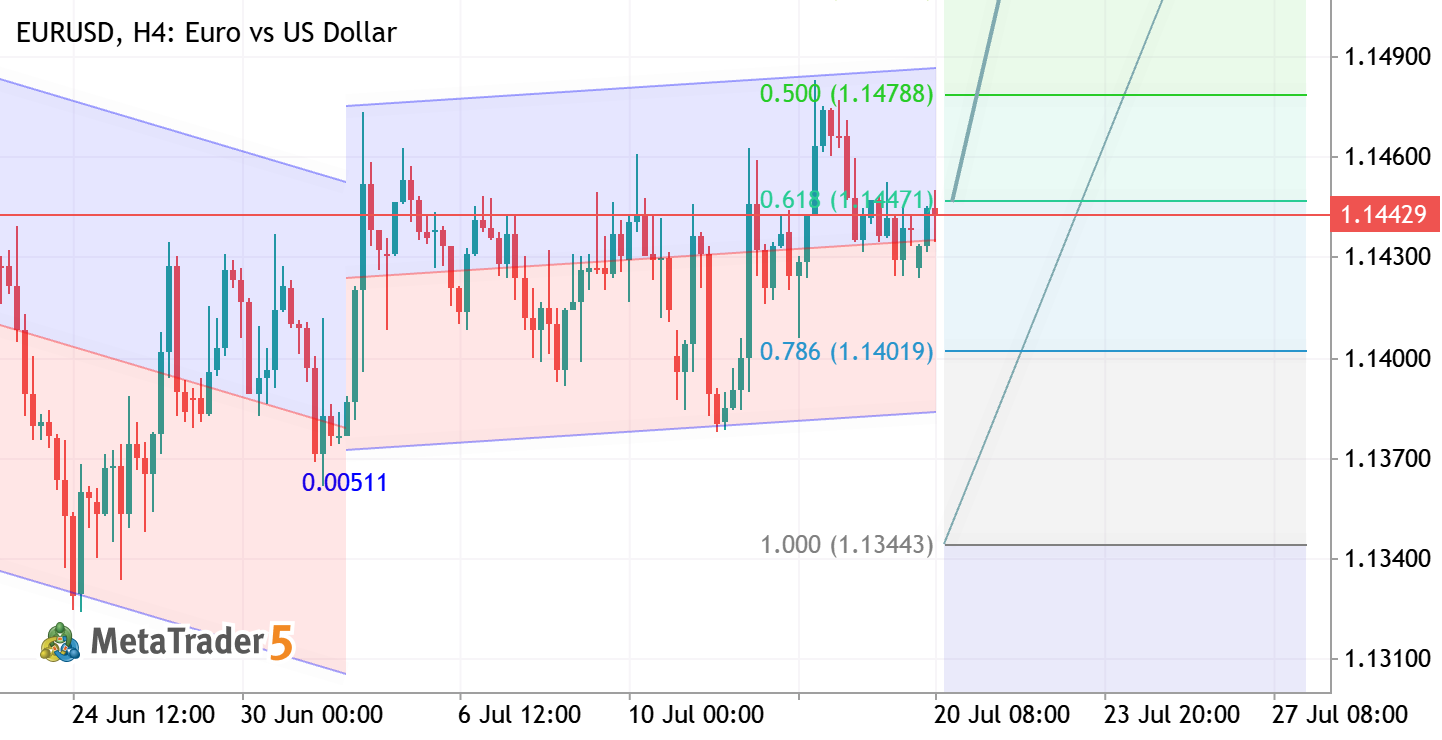
EURUSD – H4 Outlook Price is holding above the key Fibonacci support zone, signaling bullish strength. As long as buyers defend 1.1400–1.1420, the pair remains positioned for a move toward 1.1615. Bias: Bullish Support: 1.1400–1.1420 Target: 1.1550 → 1.1615 A sustained hold above support keeps the upside scenario valid, while a break below 1.1400 would weaken the bullish outlook. Always wait for confirmation and apply proper risk management.

GBPUSD H1 ANALYSIS GBPUSD Pound Sterling vs US Dollar

GBPUSD H1 ANALYSIS

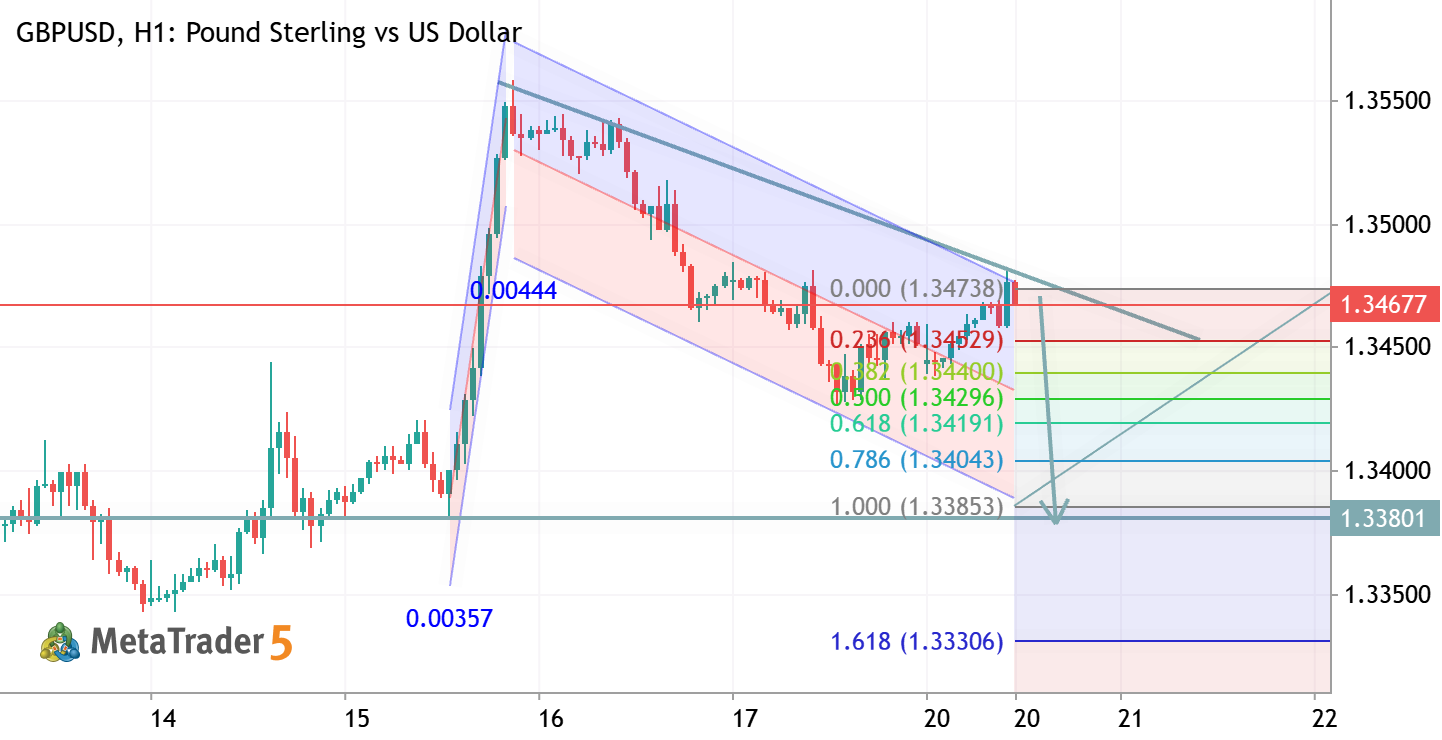
GBPUSD – H1 Quick Analysis Price is recovering from the Fibonacci support zone after respecting the lower boundary of the descending channel. Buyers are attempting to regain momentum, with the next focus on the channel resistance. Bias: Bullish above support. Key Resistance: 1.3465–1.3480. Key Support: 1.3400–1.3385. A confirmed breakout above the channel could trigger further upside, while rejection at resistance may lead to another pullback toward the support zone. Trade with proper risk management and wait for candle confirmation before entry.
BTCUSD H4 ANALYSIS BTCUSD Bitcoin vs US Dollar

BTCUSD H4 ANALYSIS

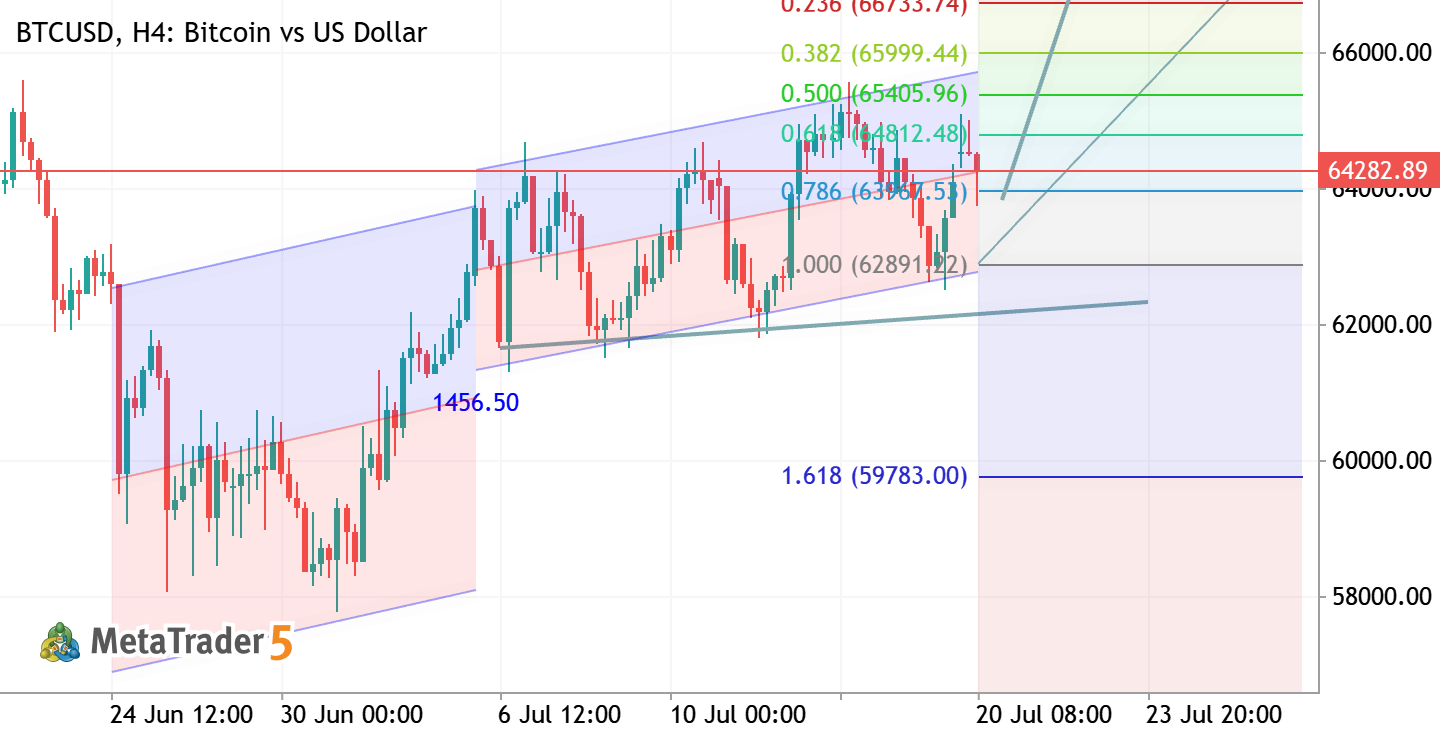
BTCUSD H4 Analysis Bitcoin remains in a strong bullish trend, trading inside an ascending channel while respecting Fibonacci support levels. As long as price holds above the key demand zone, buyers are likely to target the next resistance area. 📈 Bias: Bullish 🎯 Targets: 68,300 → 69,700 ⚠️ Key Support: 63,700–64,000 Trend remains bullish. Watch for a breakout above resistance or a pullback to support for higher-probability entries. Always manage risk.
XAUUSD H1 ANALYSIS XAUUSD Gold vs US Dollar

XAUUSD H1 ANALYSIS

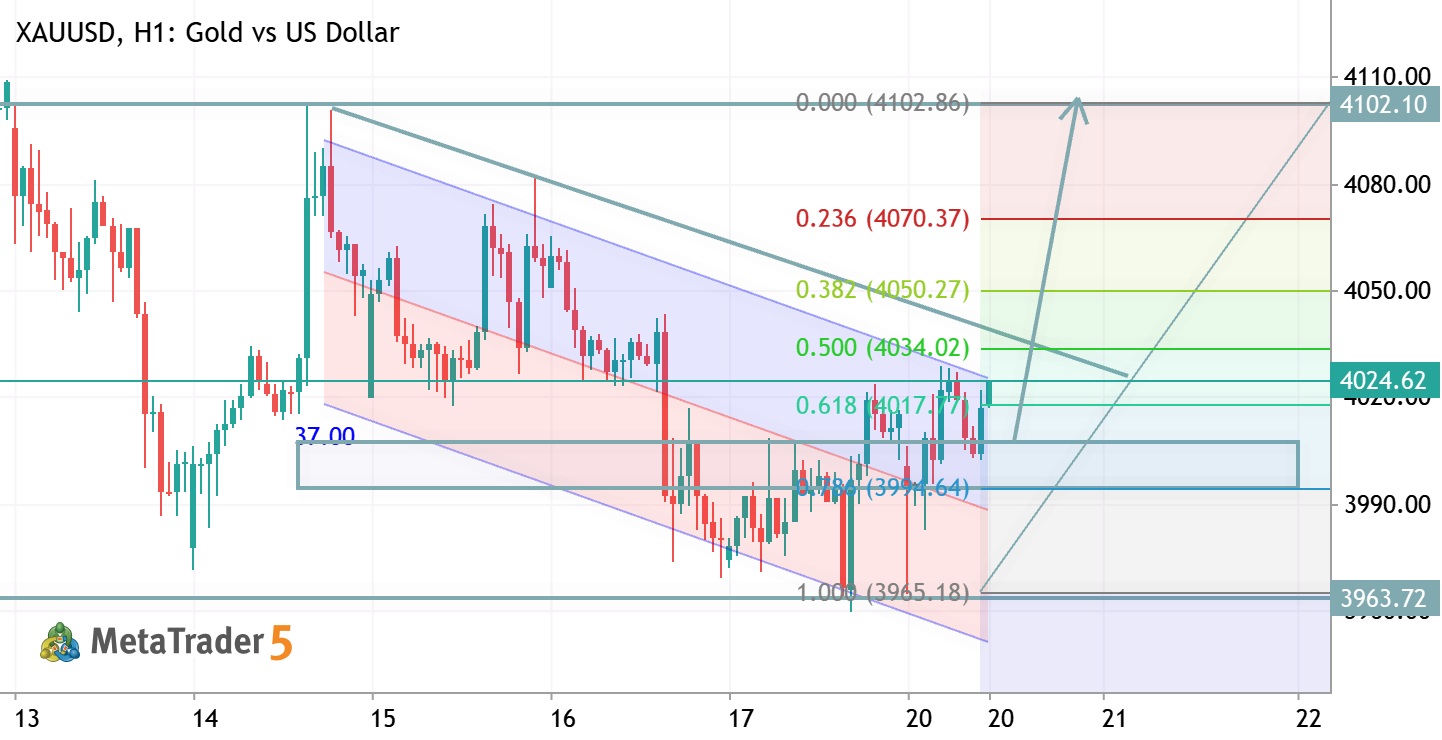
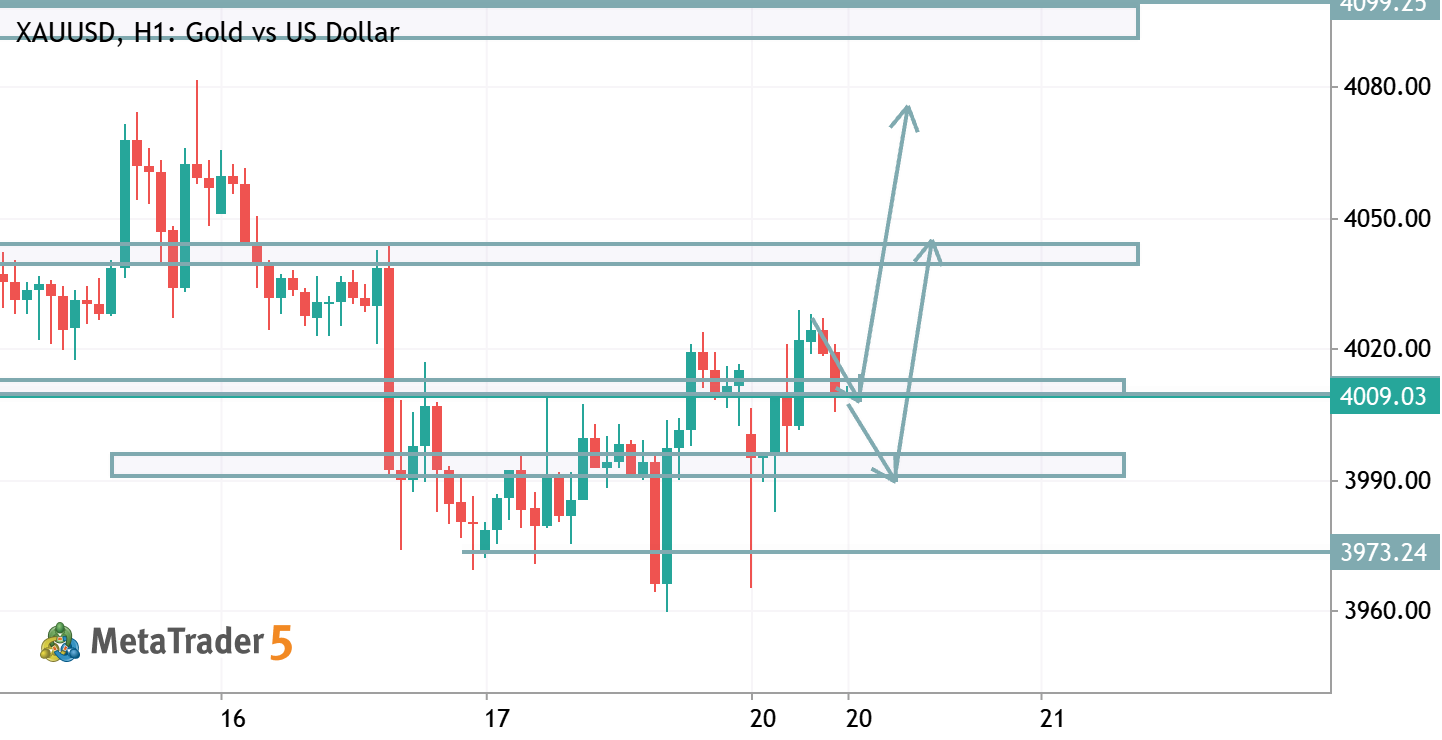
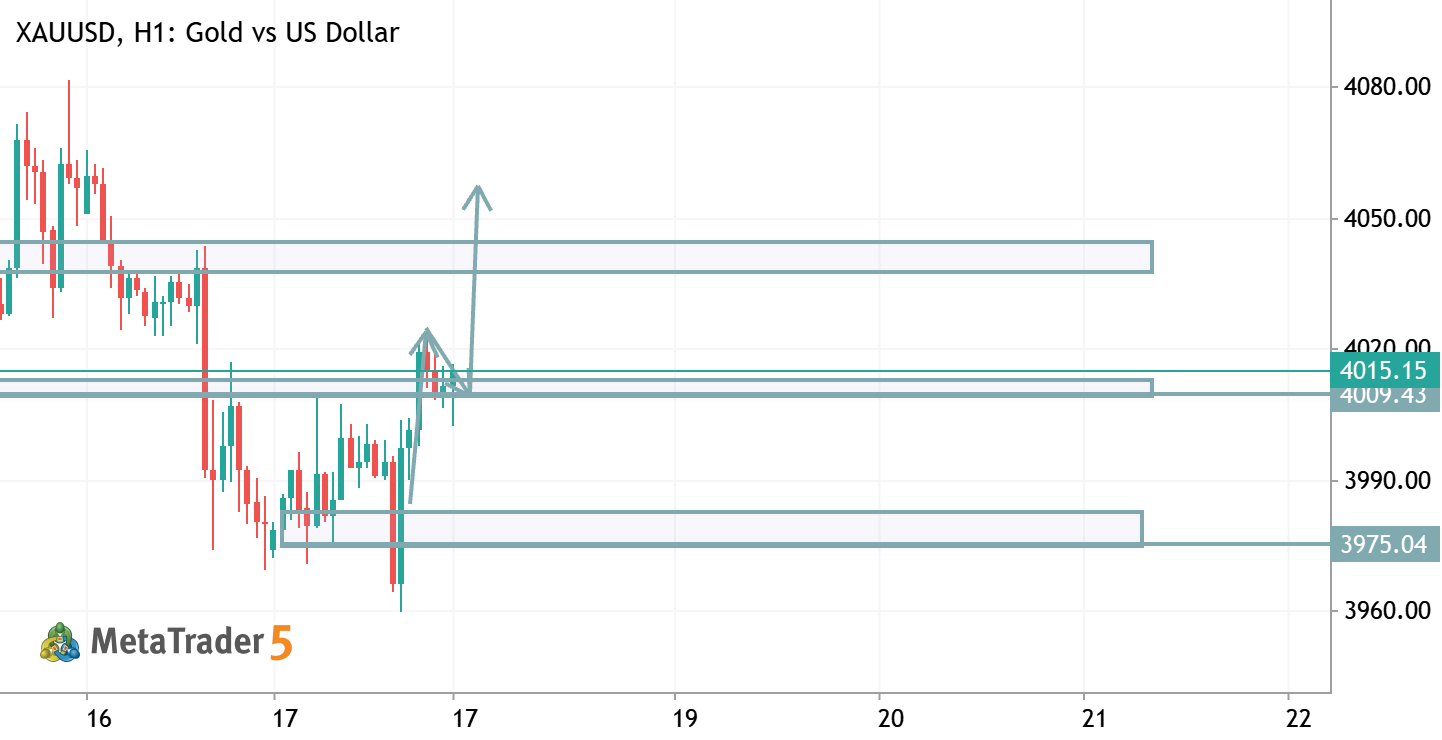
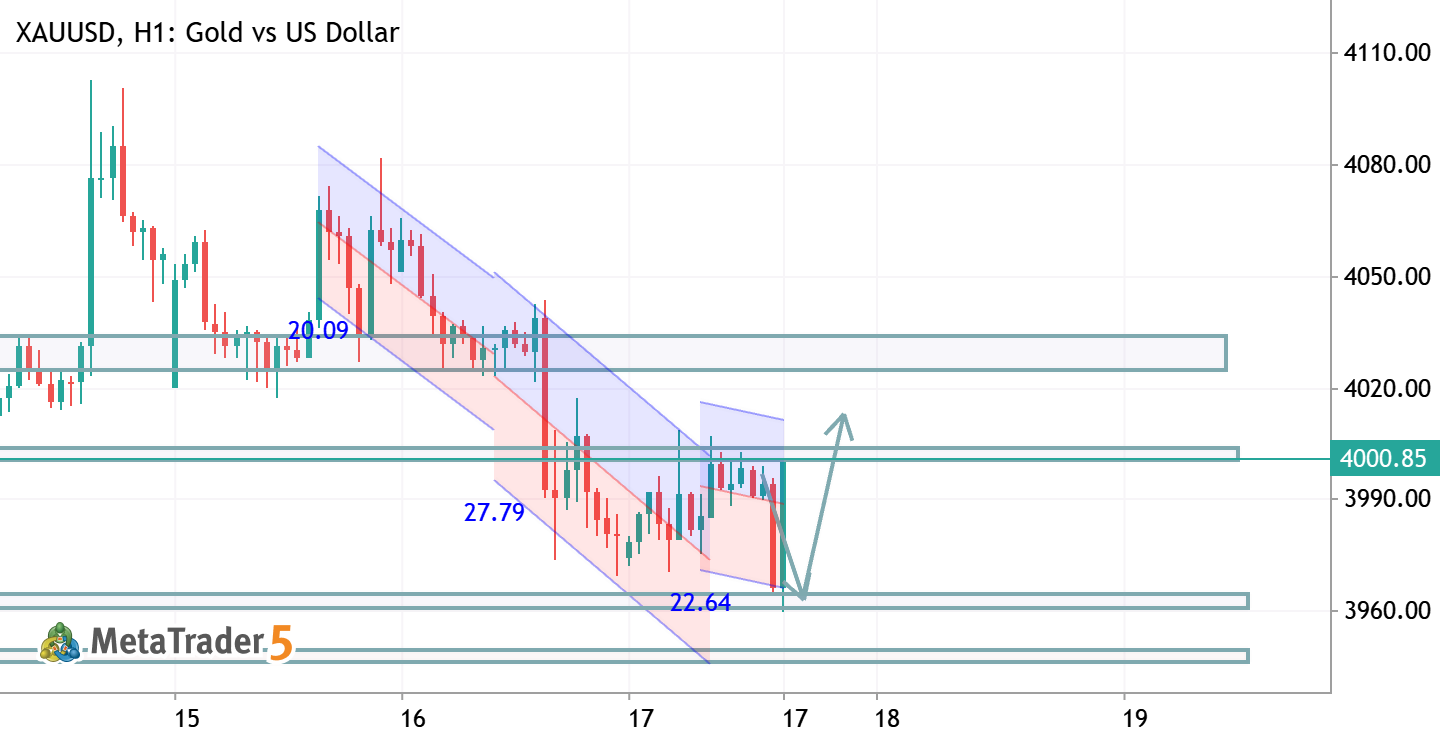
XAUUSD H1 Analysis Gold is trading within a bullish recovery structure after holding above key support. Price is approaching a major resistance zone near 4100, where a breakout could trigger the next impulsive move. A successful close above resistance would strengthen the bullish outlook. 📈 Bias: Bullish 🎯 Targets: 4100 → 4120 ⚠️ Key Support: 4000–3965 Wait for breakout confirmation or a healthy pullback before entering. Always use proper risk management.
BTCUSD TRADE IDEA BTCUSD Short Bitcoin vs US Dollar

BTCUSD TRADE IDEA

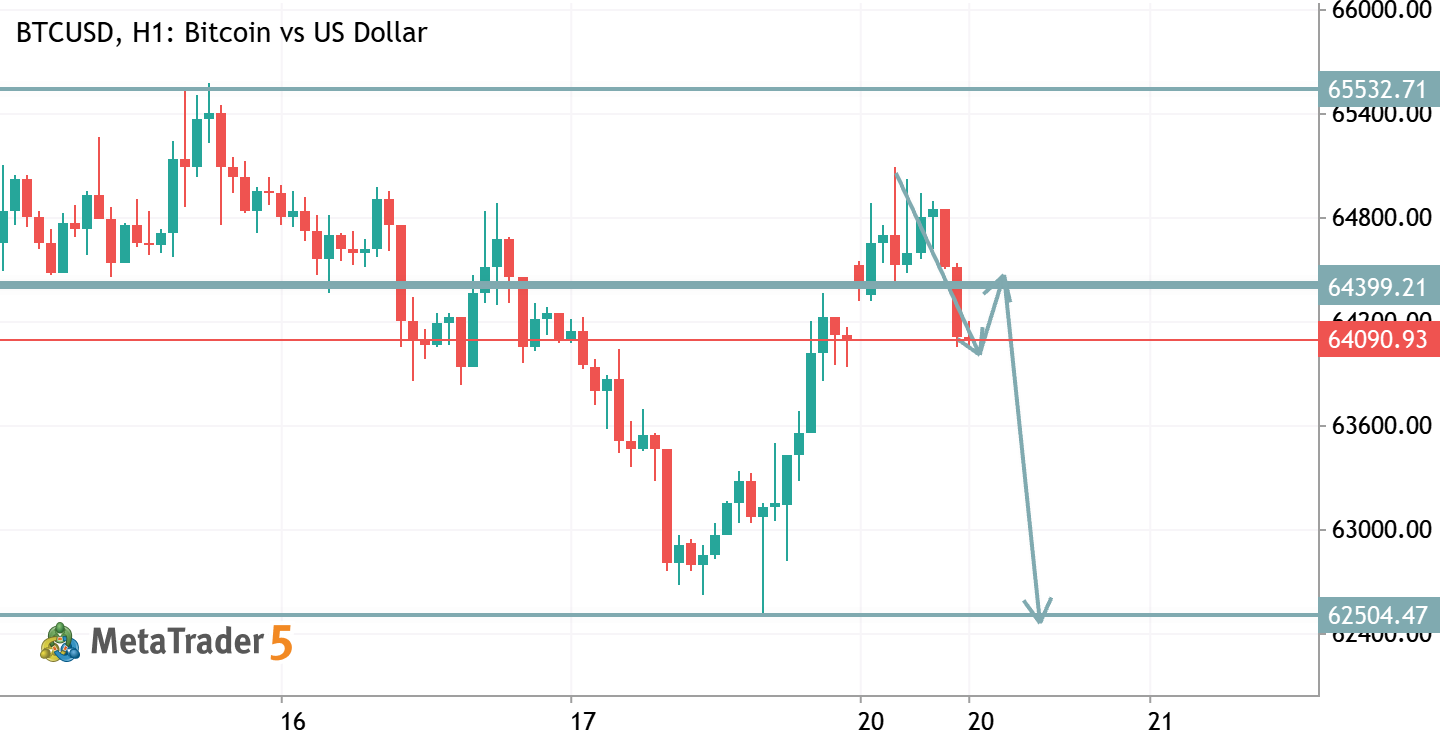
BTCUSD (H1) Bias: Bearish below 64,400 resistance. Key Resistance: 64,400 – 64,550 . Key Support: 64,160 , then 62,500 . Price is rejecting the resistance zone after a strong rally, suggesting sellers are defending this level. A confirmed H1 close below 64,160 increases the probability of a move toward 62,500 . If price breaks and closes above 64,550 , the bearish setup is invalidated and buyers may regain control. Trade Idea: Sell below 64,160 after confirmation. Targets: 63,500 → 62,500 . Stop Loss: Above 64,550 .
BTCUSD TRADE IDEA BTCUSD Long Bitcoin vs US Dollar

BTCUSD TRADE IDEA

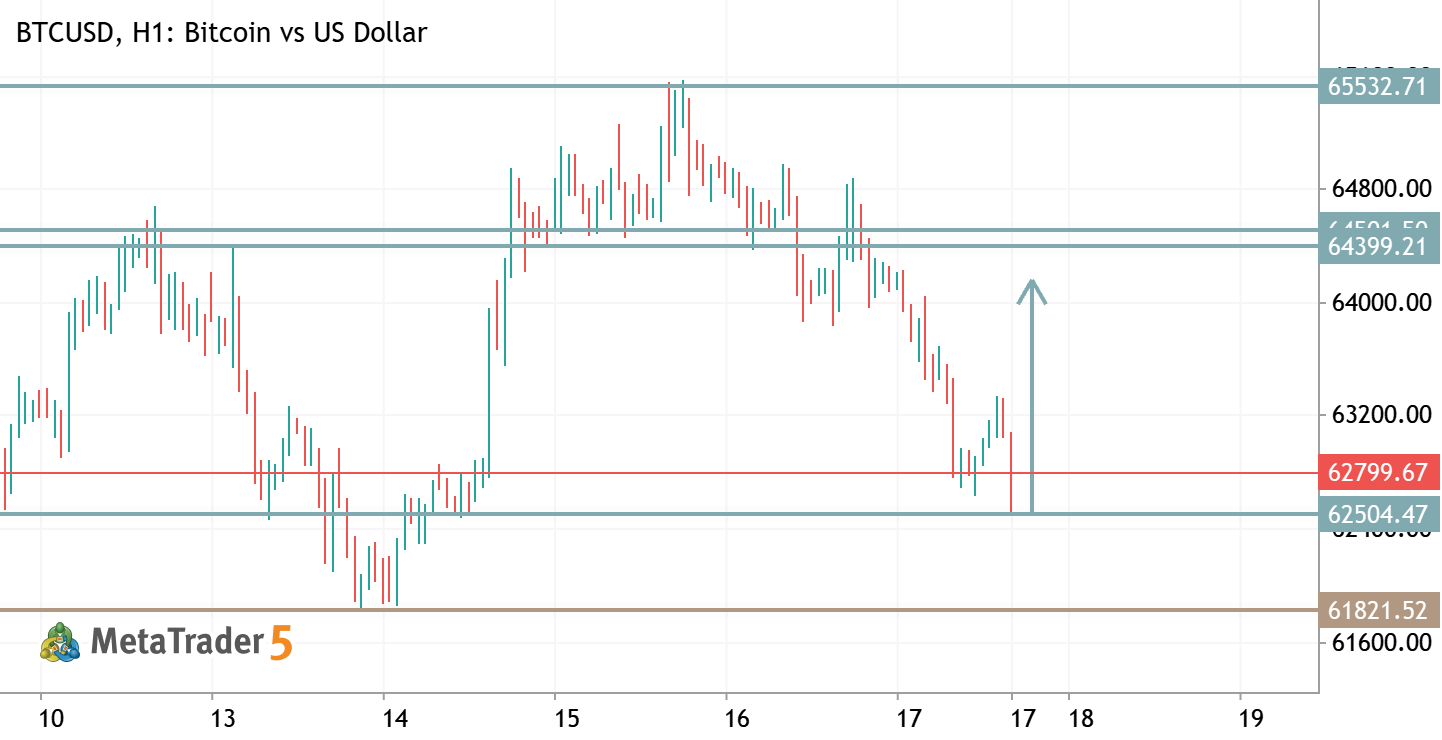
BTCUSD (H1) – Buy Bias: Bullish if price holds above 62,500–62,600 support. Entry Zone: 62,500–62,650 Stop Loss: Below 61,820 Take Profit 1: 63,400 Take Profit 2: 64,400 Take Profit 3: 65,530 Outlook: Price is testing a key support zone. If buyers defend 62,500 and a bullish H1 candle closes above 62,820 , the probability of a move toward 63,400 and 64,400 increases. A break below 61,820 invalidates the bullish setup.
AMZN - Daily Trading Forecast AMZN Amazon.com, Inc. - Common Stock

AMZN - Daily Trading Forecast

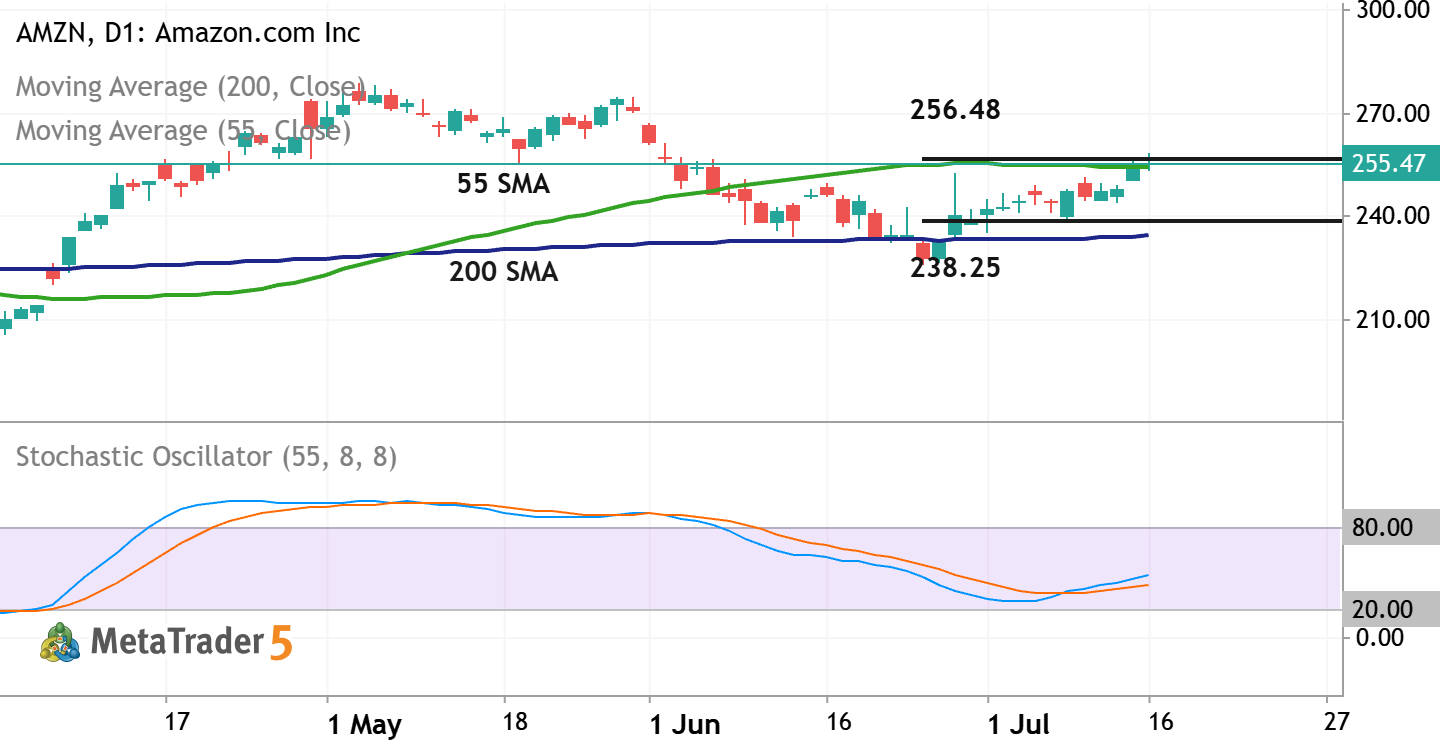
Daily price is located above 200 SMA in the bullish area of the chart. The Stochastic oscillator is showing the uptrend to be started by crossing the 50 level to above, and the price is trying to break the resistance level at 256.48 together with 55 SMA to above for the strong bullish trend to be continuing. If the price breaks resistance at 256.48 together with 55 SMA to above so the primary bullish market condition will be continuing for daily price. If the price crosses support level at 238.25 together with 200 SMA to below so the primary bearish reversal will be started. Alternatively, the price will be on secondary ranging above 200 SMA to be inside s/r levels waiting for direction of the strong trend tioo be started. Trading Summary : bullish ranging for direction.
BTCUSD H4 ANALYSIS BTCUSD Bitcoin vs US Dollar

BTCUSD H4 ANALYSIS

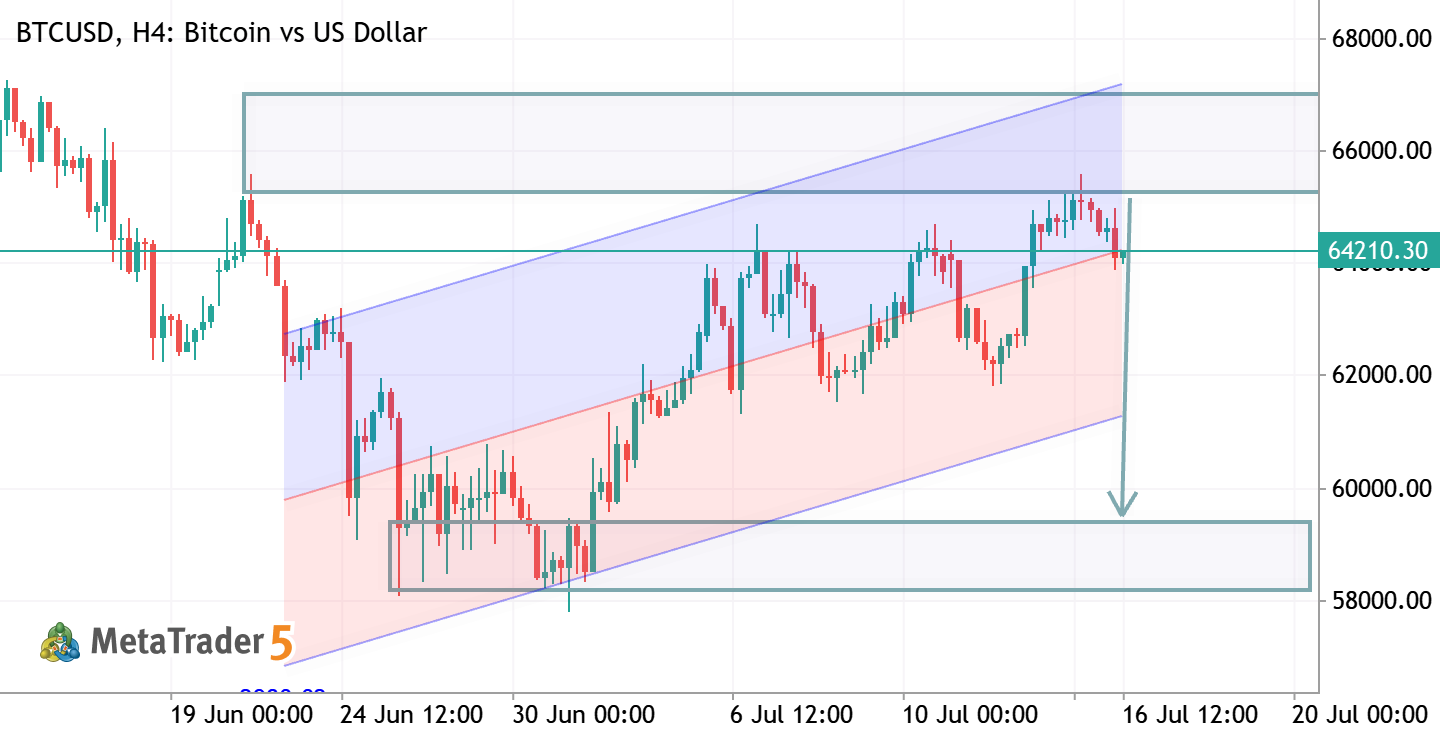
BTCUSD – H4 Analysis BTCUSD is trading inside an ascending channel and testing a key resistance zone around 64K. The overall trend remains bullish as long as price holds above channel support. A confirmed breakout above resistance could open the door for a continuation toward 66K–68K, while rejection from this level may trigger a healthy pullback toward the lower channel before the next bullish move. Bias: Bullish above support. Wait for a confirmed breakout or a pullback for better entries.
XAUUSD H4 ANALYSIS XAUUSD Gold vs US Dollar

XAUUSD H4 ANALYSIS

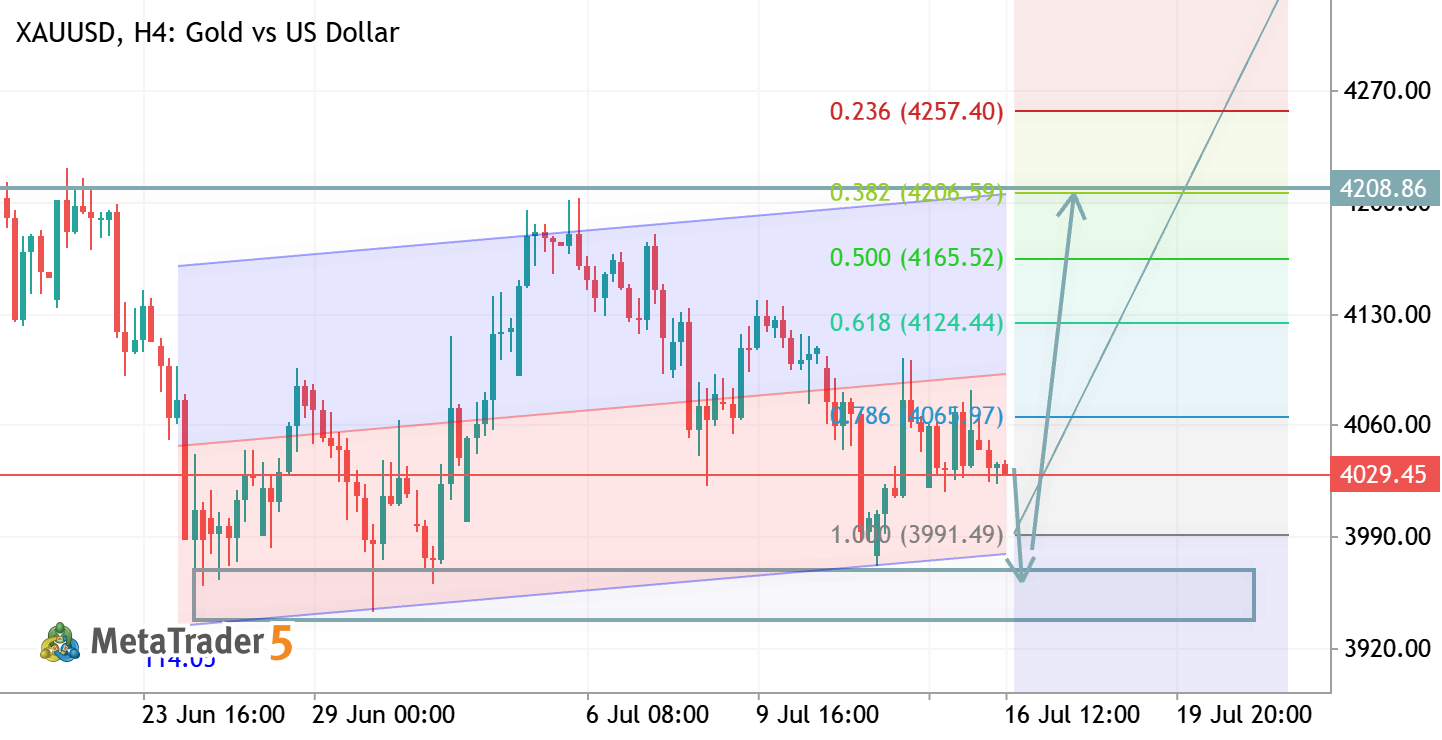
XAUUSD – H4 Analysis XAUUSD is holding above a key support zone after completing a Fibonacci retracement near the 0.786–1.000 area, suggesting buyers are defending the trend. A sustained move above the 0.382–0.236 retracement zone could trigger bullish continuation toward the major resistance around 4350–4400. However, losing the recent swing low would invalidate the bullish outlook and increase downside risk. Bias: Bullish above support. Key Levels: Support: 3990–4060 | Resistance: 4257 → 4358.