US30 — Inverse Head & Shoulders Building Inside the Triangle 30 US30 Long US Wall Street 30 Index

US30 — Inverse Head & Shoulders Building Inside the Triangle

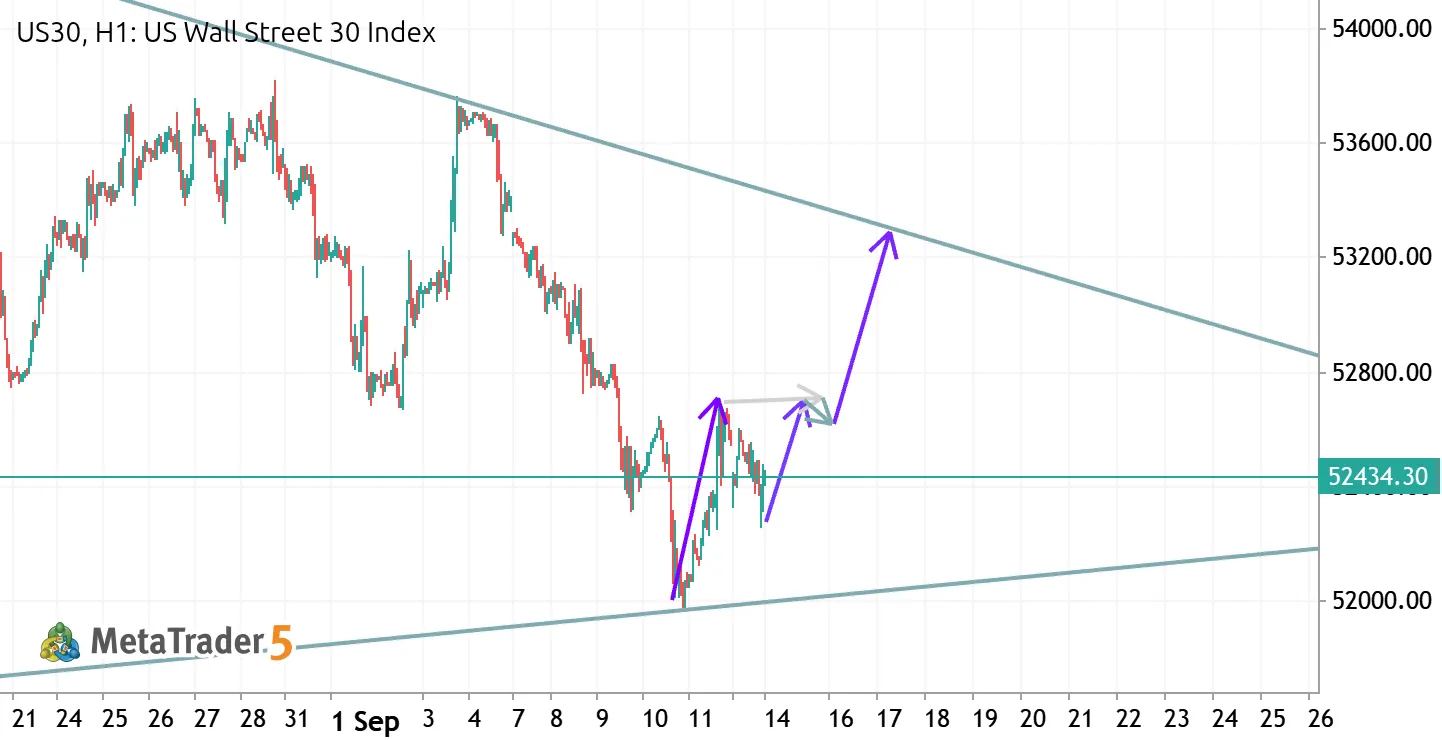
US30 has spent six weeks compressing between the descending resistance off the 5 August high and the rising support that's been in place since late July. Price is now deep into that contraction, and the way the last leg down resolved is what makes this interesting. Instead of breaking the rising trendline, the market carved out a small inverse head and shoulders right on top of it: left shoulder around 52,150, the head at 51,950 where support was tested and rejected on 10 September, and a higher right shoulder near 52,300. That's a textbook sequence of a seller exhaustion — each attempt lower found buyers earlier than the last. The neckline sits around 52,750. A clean H1 close above it opens the measured move toward 53,500, which lines up neatly with the descending trendline in the
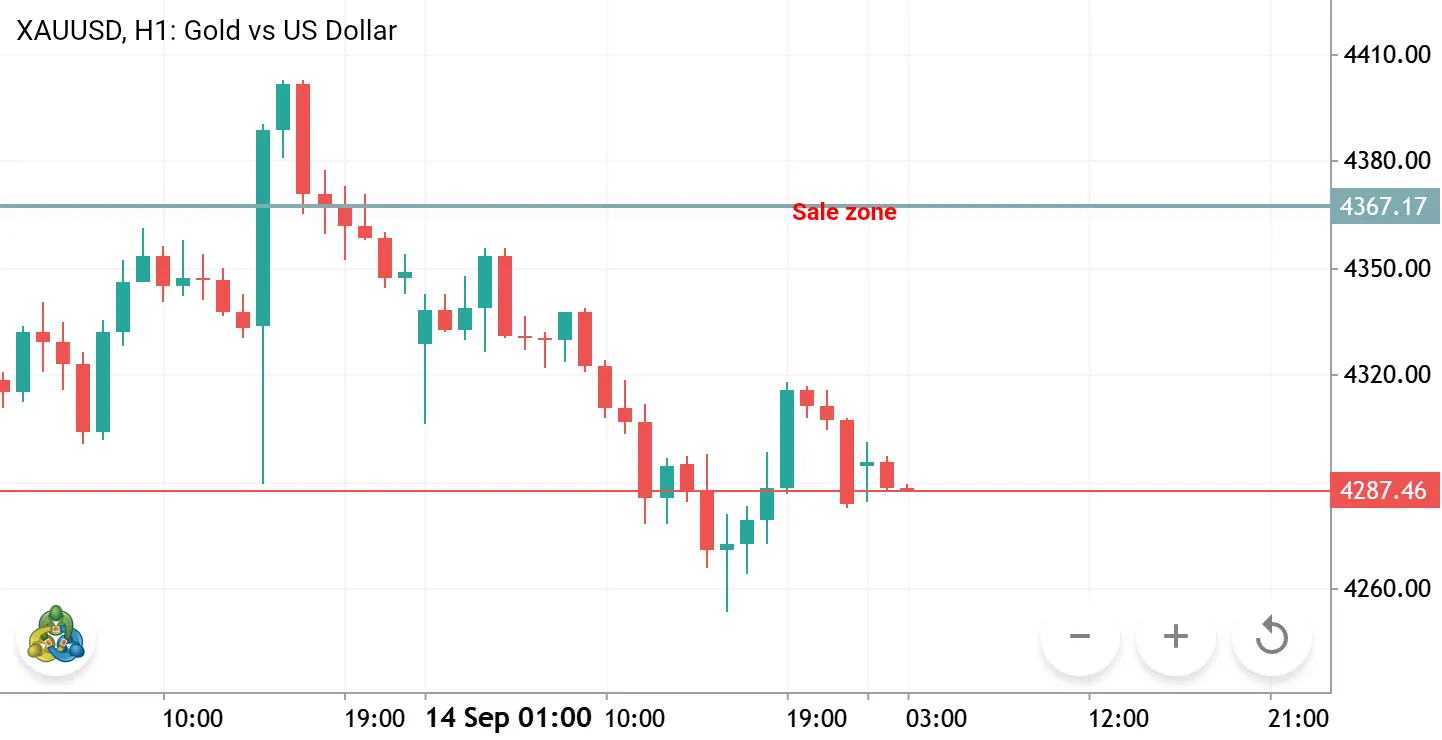
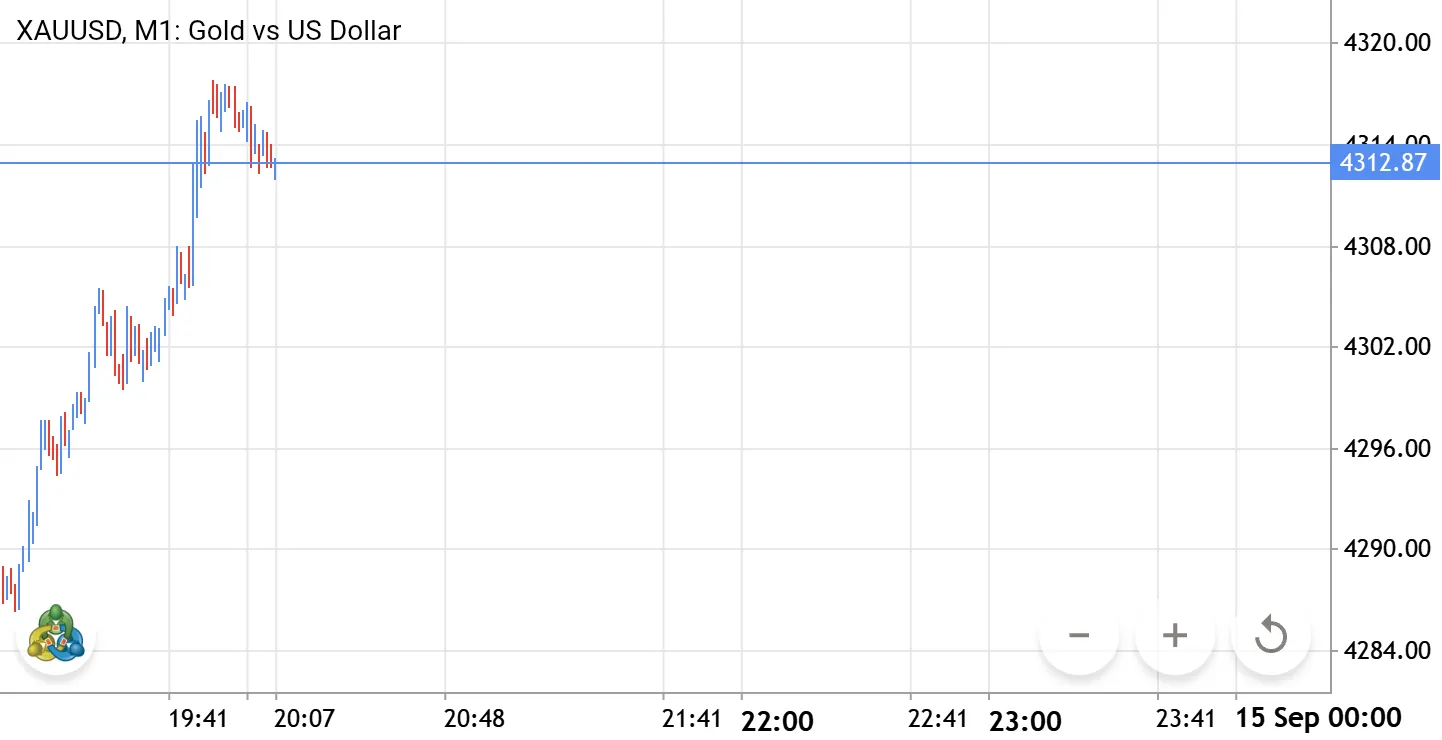
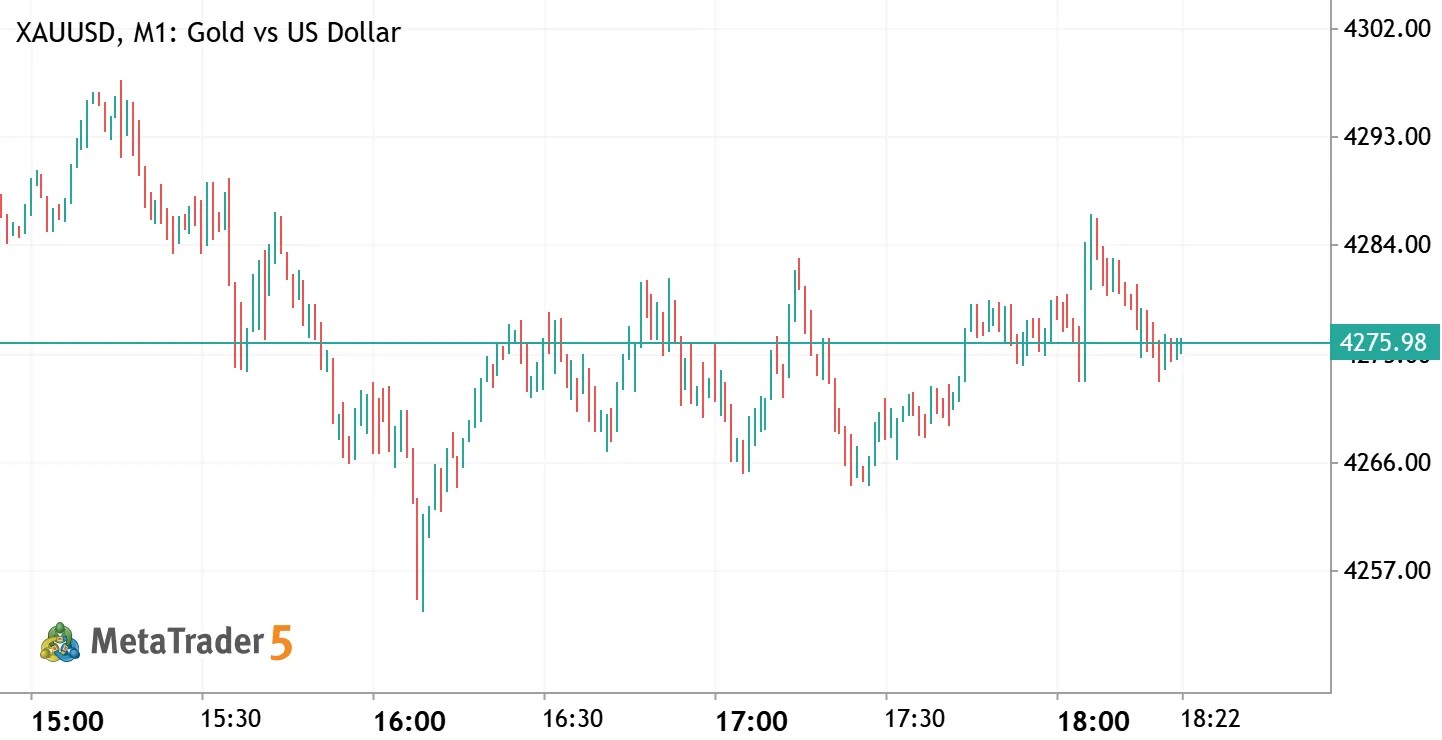
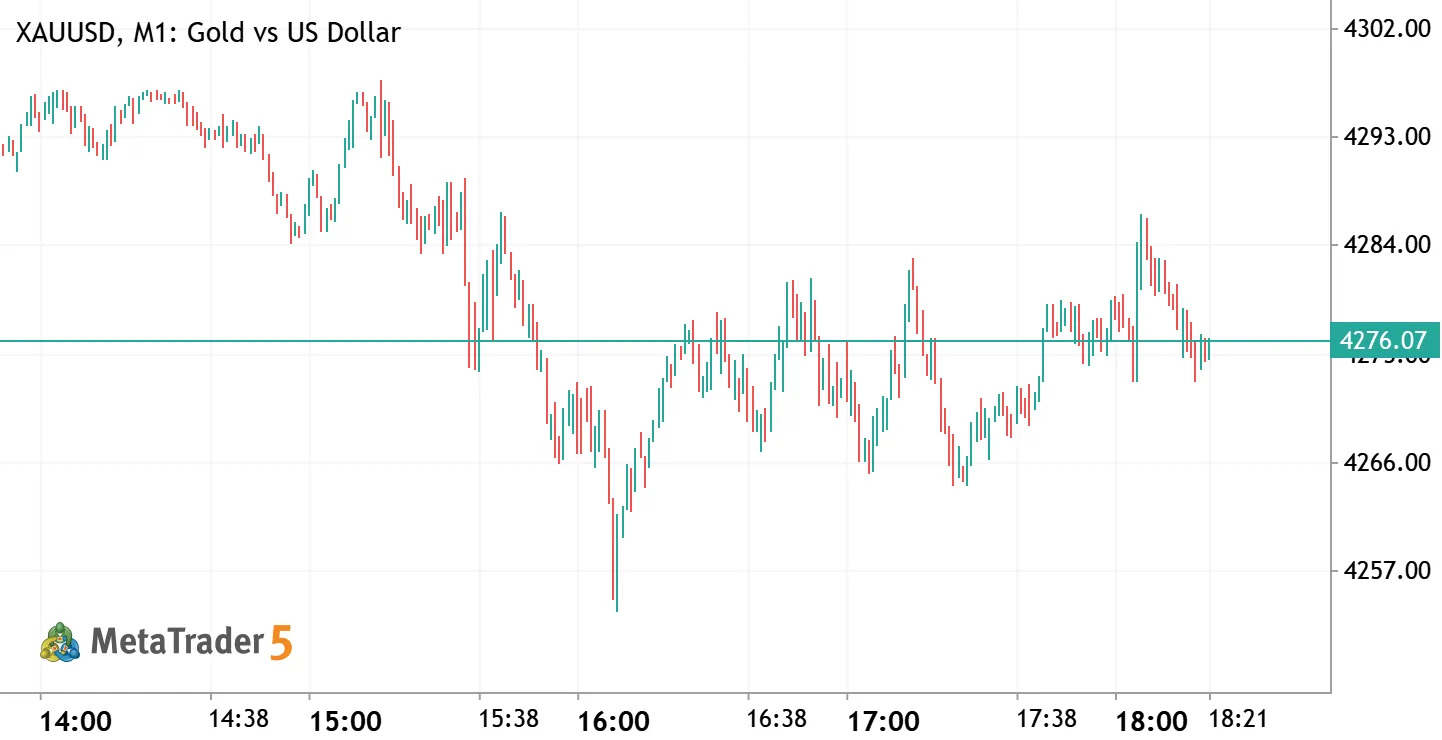
XAUUSD (Gold) – Bullish Support Bounce XAUUSD Long Gold vs US Dollar

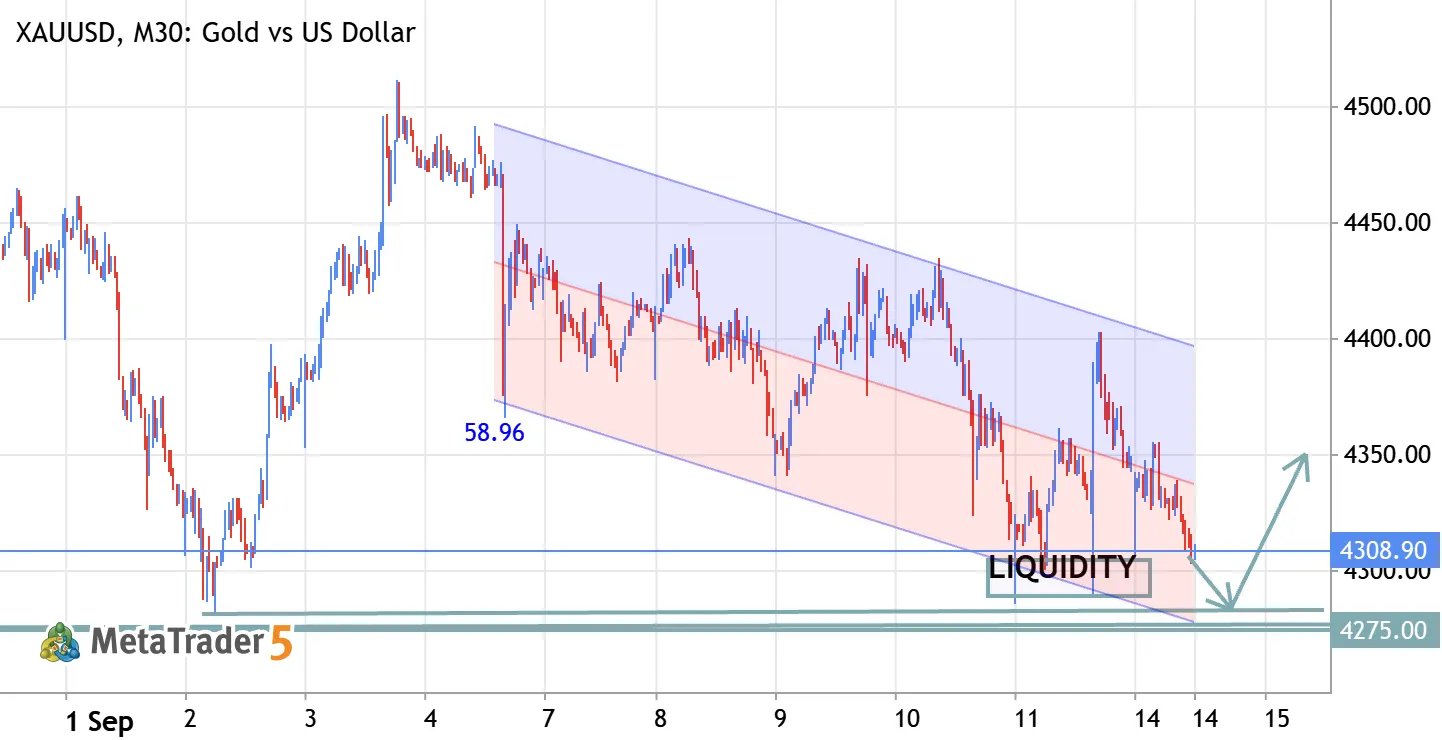
XAUUSD (Gold) – Bullish Support Bounce

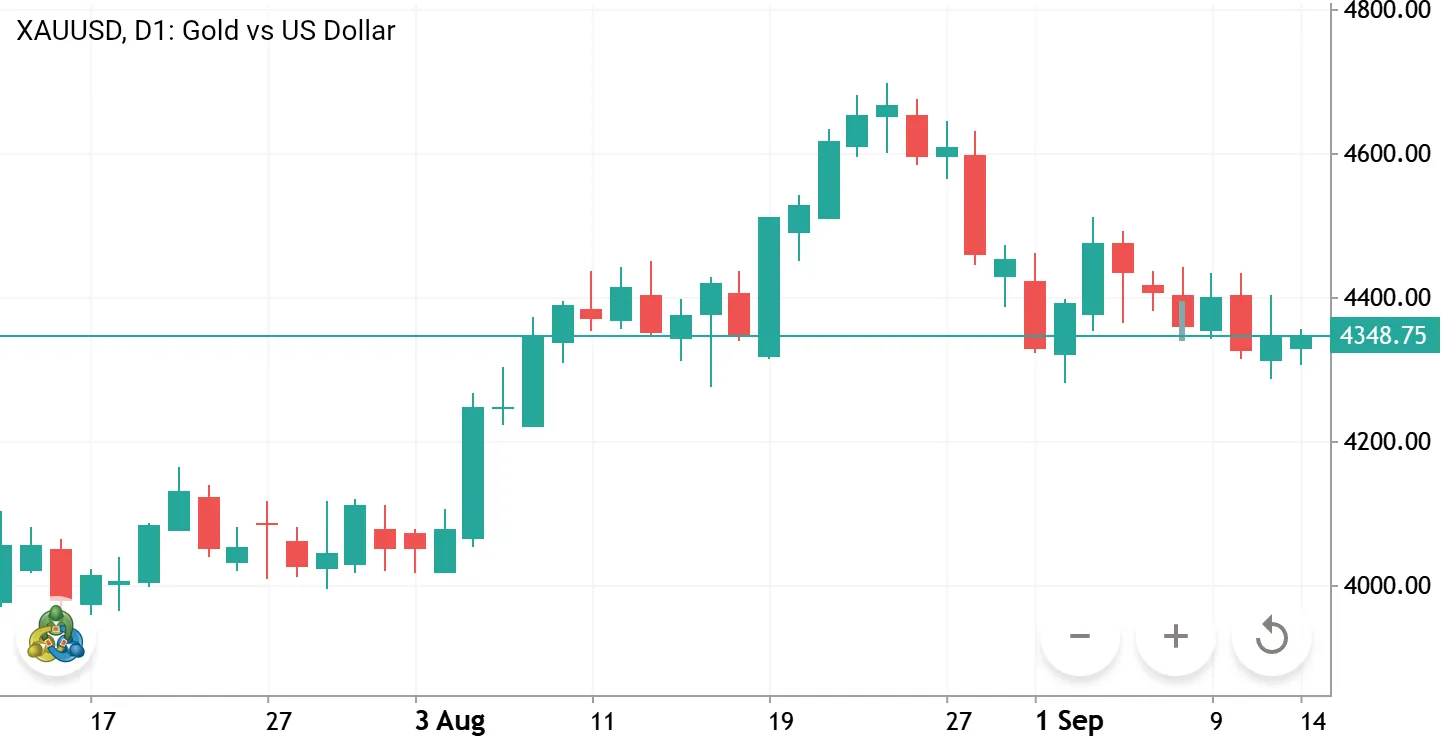
🟢 XAU/USD Buy Signal Buy Zone: 4283 – 4273 Stop Loss: 4265 Take Profit 1: 4290 Take Profit 2: 4310 Take Profit 3: 4350 📚 Educational Market Idea: Gold is approaching the 4283–4273 buy zone, which may act as a potential support area. Traders should wait for bullish confirmation, such as a strong rejection candle, bullish engulfing pattern, or a break above a nearby short-term resistance before entering. If buyers defend the zone and price maintains bullish momentum, the move could target 4290 first, followed by the next resistance levels. For a swing or day trade, always monitor market structure, news events, and risk-to-reward before taking the position. 📌 Trade Management: Consider securing partial profits at TP1 and TP2 while allowing the remaining position to target TP3. Move Stop
XAUUSD Daily Bounce Play: Testing the 50-Day MA Support After August Rally XAUUSD Gold vs US Dollar

XAUUSD Daily Bounce Play: Testing the 50-Day MA Support After August Rally

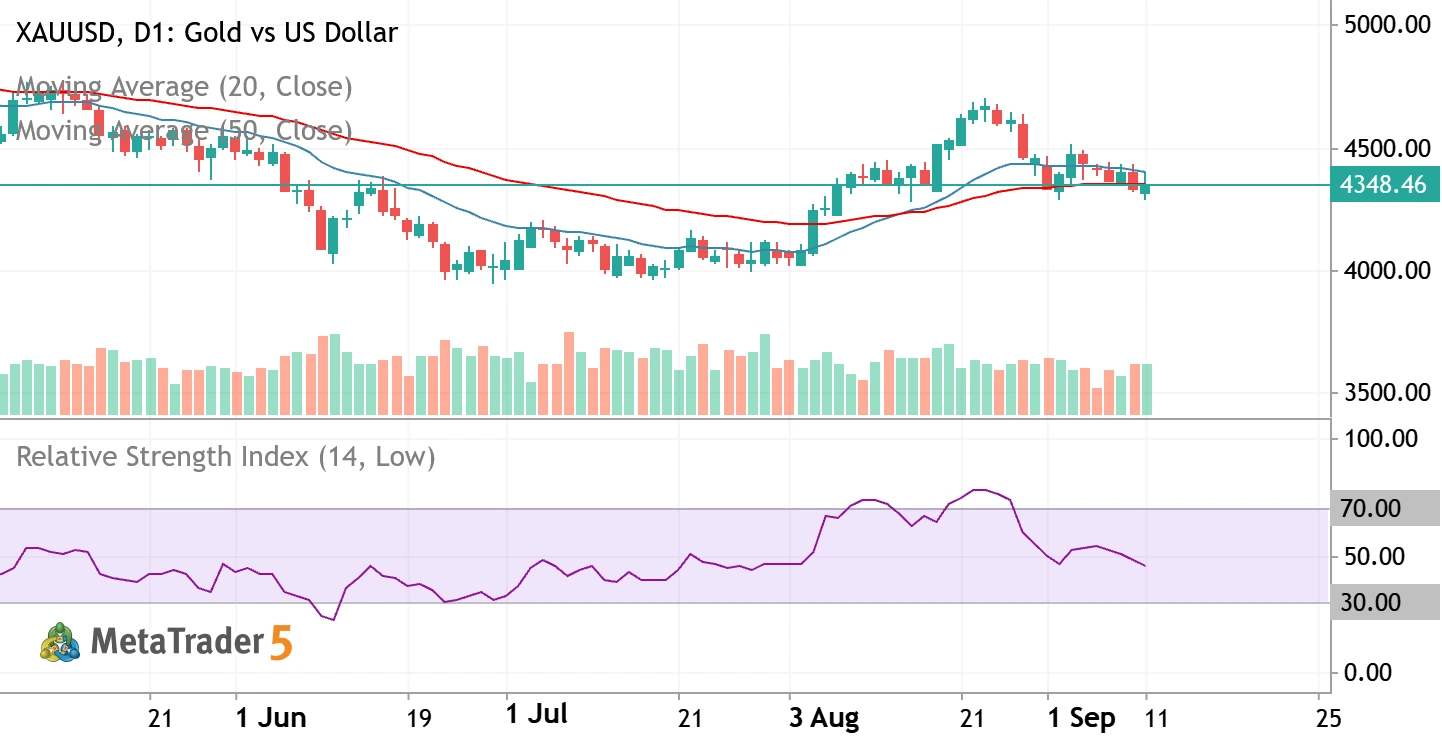
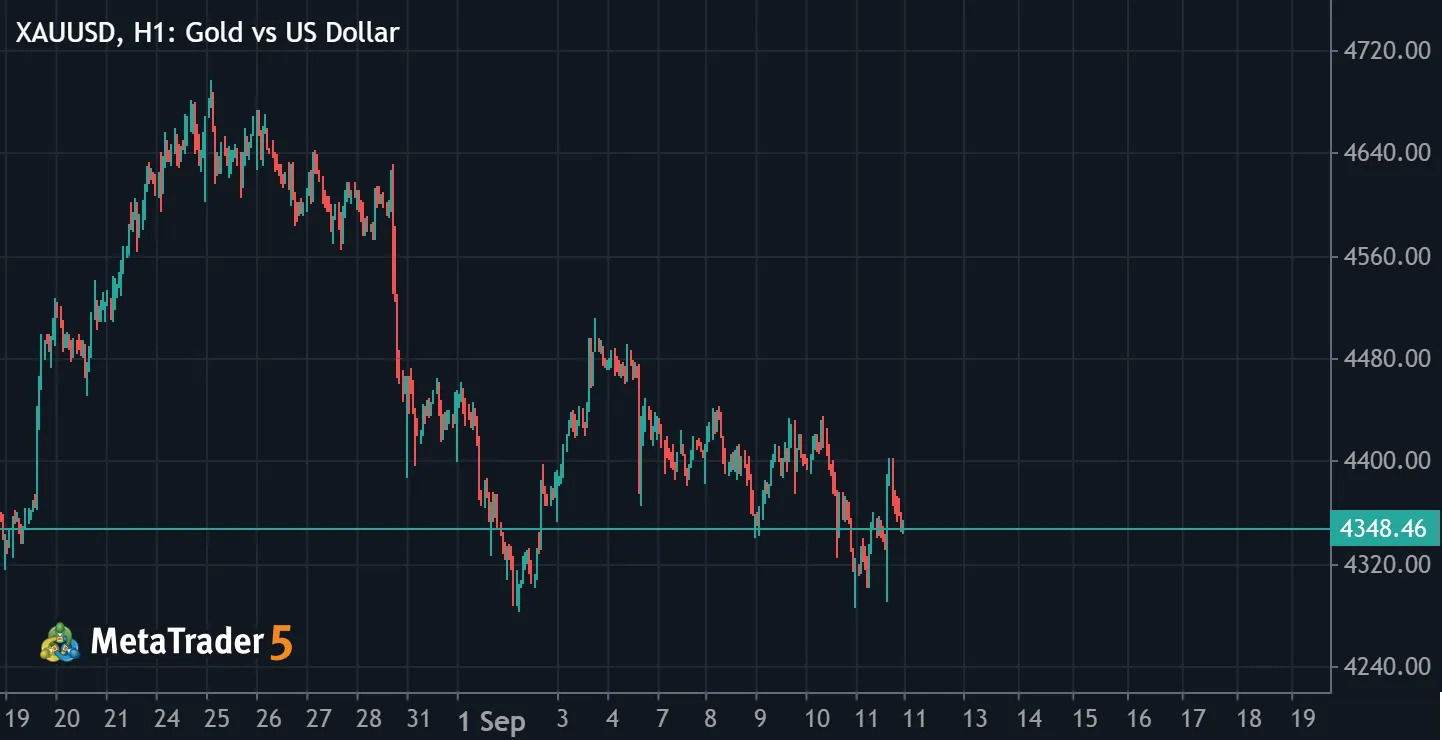
XAUUSD is currently pulling back on the daily chart following a strong August rally. Short-term direction is currently neutral to slightly bearish due to the ongoing pullback from the highs, but the medium-term outlook hinges on a crucial technical test at the 50-day moving average. If the price successfully bounces from this support, it could resume its upward trend; however, a break below it would signal a deeper correction. Price Action: Gold is trading around 4348.46, cooling off from its mid-August peak near the 4600–4700 resistance zone. Moving Averages: Price has slipped below the 20-day MA and is now testing the 50-day MA as key dynamic support to see if the broader uptrend can hold. RSI: Sitting flat around the neutral 50 mark, showing a healthy reset from previous overbought