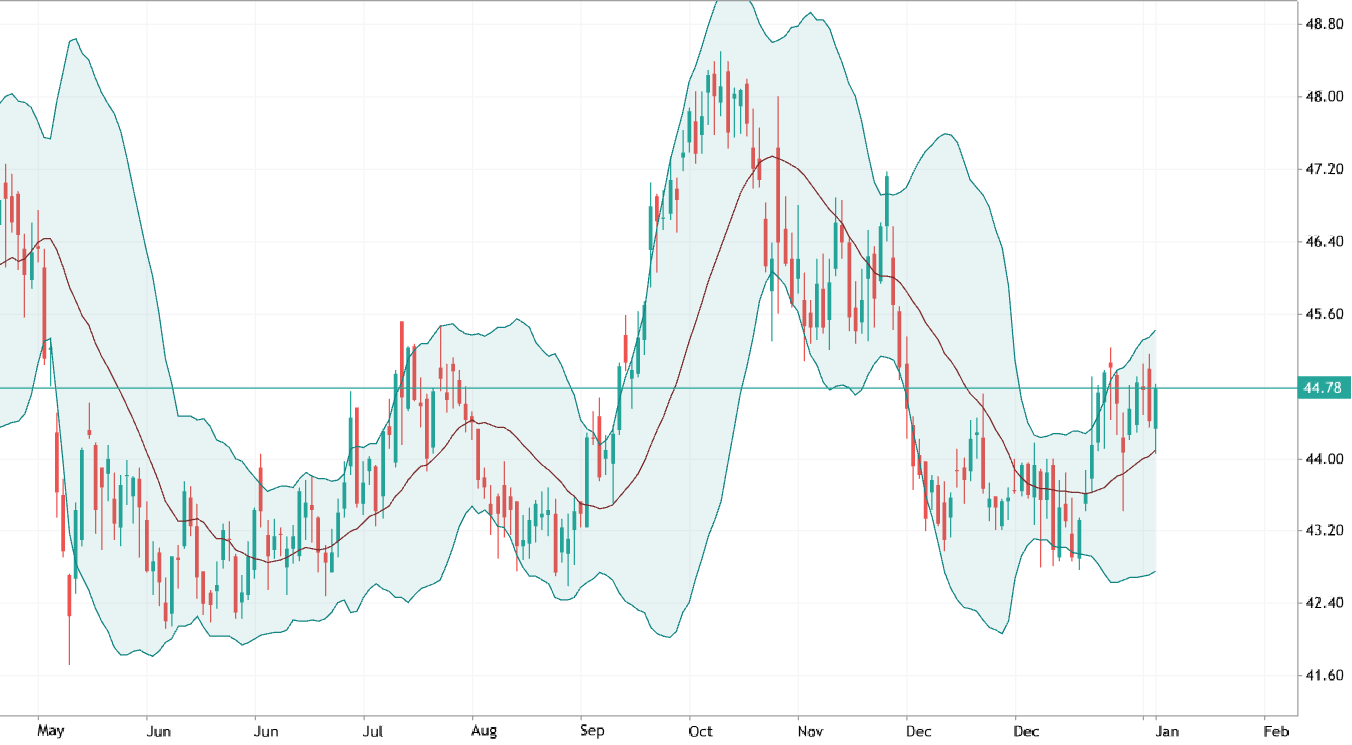
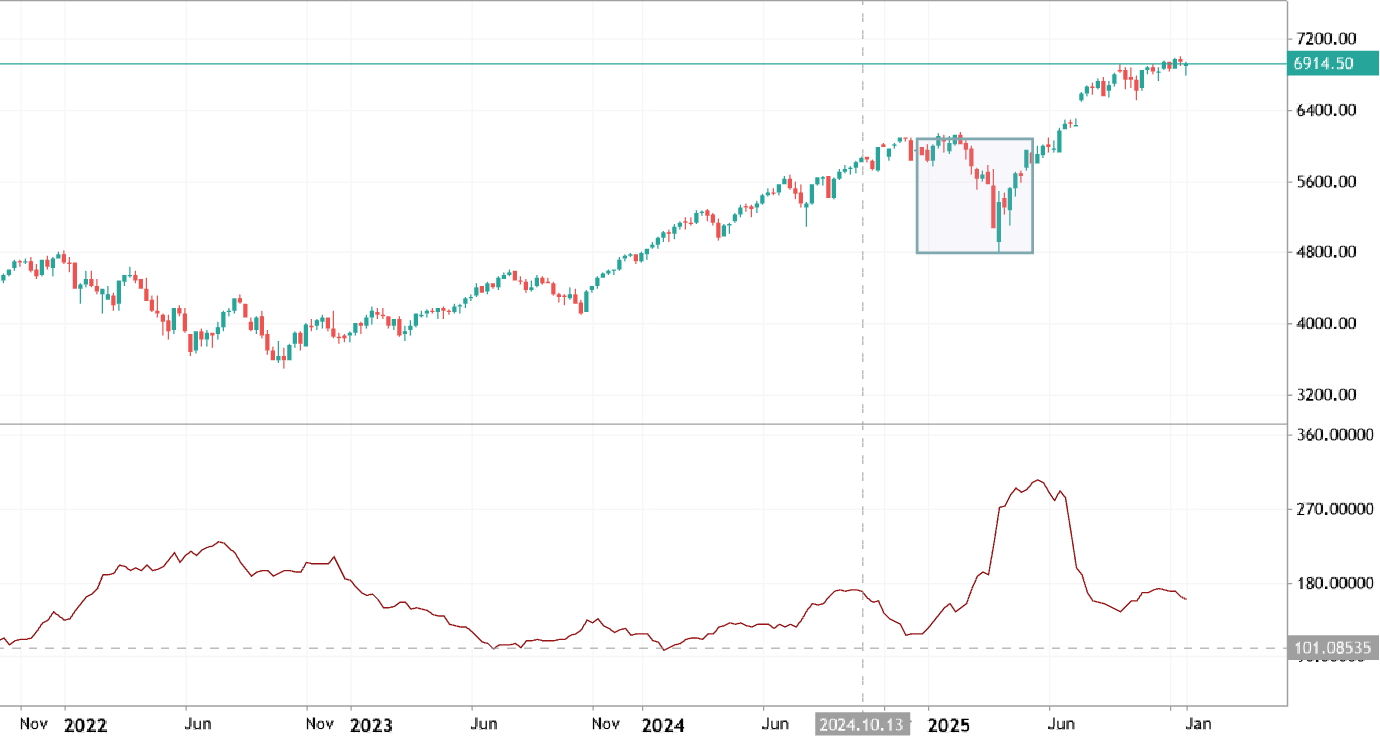
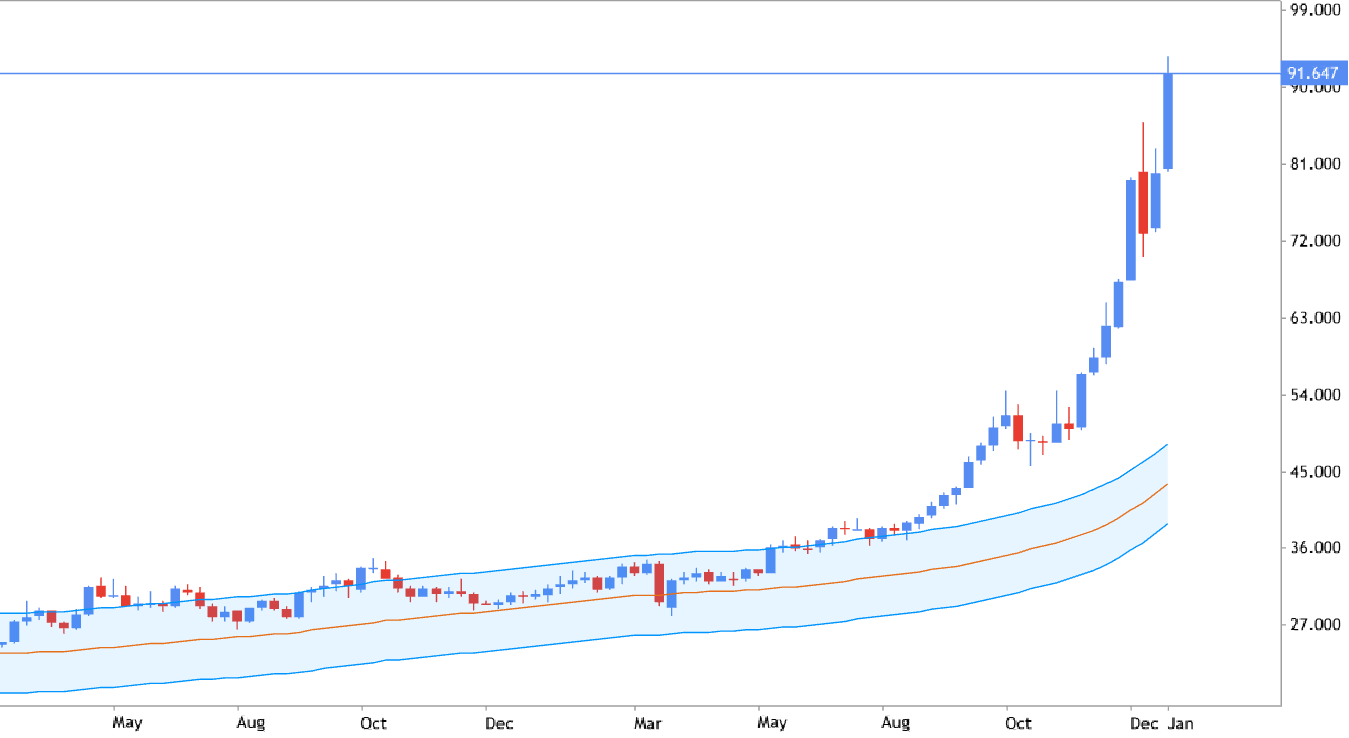
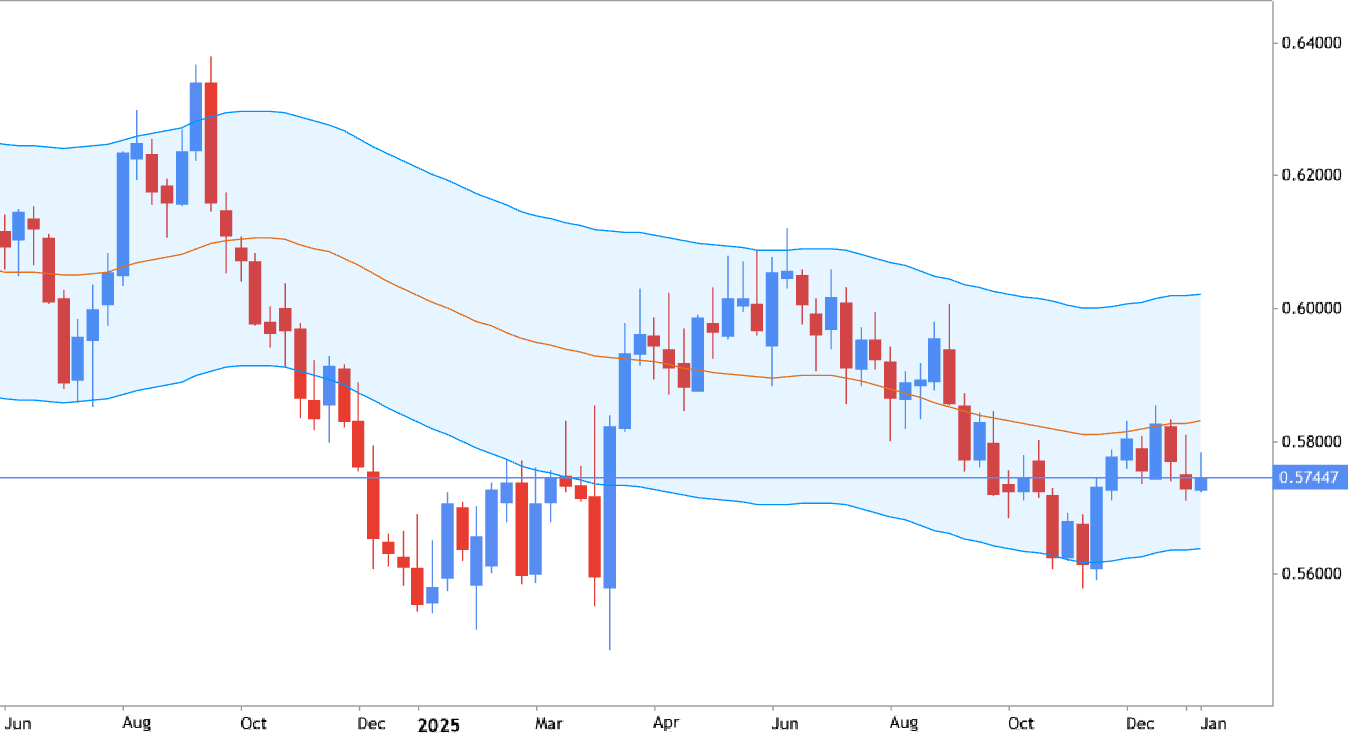
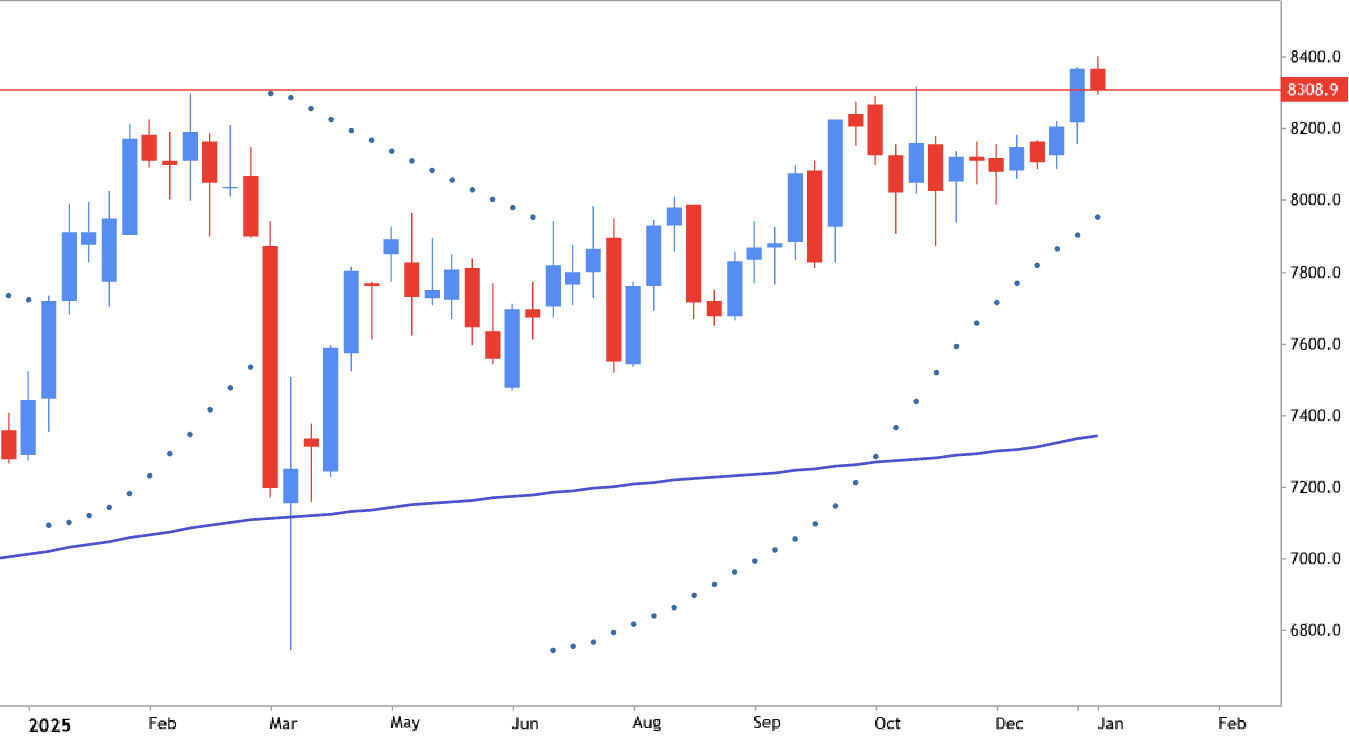
Bollinger Bands - traditional general approach EXC Exelon Corporation - Common Stock
Bollinger Bands - traditional general approach
Bollinger bands are very similar to moving averages. The bands are plotted at two standard deviations above or below the moving average. This is typically based off of the simple moving average, but an exponential moving average can be used to increase the sensitivity of the indicator. A 20-day simple moving average is recommended for the center band and 2 standard deviations for the outer bands. Bollinger bands are typically used by traders to detect extreme unsustainable price moves, capture changes in trend, identify support/resistance levels and spot contractions/expansions in volatility. There are a number of ways to interpret Bollinger Bands: when the prices break above or below the upper or lower band, it is an indication that a breakout/breakdown is occurring. Alternatively, some traders use Bollinger Bands as an overbought and oversold indicator.
0
newdigital Sergey Golubev 2026.01.31 09:19
Average True Range - traditional general approach
500
US500 US SPX 500 Index
Average True Range - traditional general approach
The Average True Range (ATR) indicator is a measure of volatility. The ATR indicator measures the range of price movement for a particular price period. The ATR is a directionless indicator and it does not indicate the direction of the trend. ATR measures volatility, and this allows traders to set stops based actual market behavior. Low ATR values indicated extended periods of sideways price movement, such as those found at market tops and consolidation periods. Low ATR values are typical for the periods of sideways movement of long duration which happen at the top of the market and during consolidation. High ATR values indicated market bottoms after a sell off. Besides, the higher the value of the ATR indicator, the higher the probability of a trend change, and the lower the indicator’s value, the weaker the trend movement.
0
newdigital Sergey Golubev 2026.01.24 15:03
Envelopes - traditional general approach NZDUSD New Zealand Dollar vs US Dollar
Envelopes - traditional general approach
Envelopes indicator consists of a moving average plus and minus a certain defined percentage deviation. The Envelopes indicator serves as an indicator of overbought or oversold conditions, visual representations of price trend, and the indicator of the detection of the price breakouts. Buy when price penetrates (or bounced to above) the lower envelope and closes back inside the envelope. Sell when the price penetrates (or bounced to below) the upper envelope and then closes back down inside the envelope.
0
newdigital Sergey Golubev 2026.01.15 17:19
Parabolic SAR - traditional general approach
40
FRA40 CAC 40
Parabolic SAR - traditional general approach

Parabolic SAR is something as "stop and reversal system", and it is shown as the series of dots placed either above or below the price on a chart. If the dot is located below the price so it means the bullish trend, and if dot is above the price so it is the bearish trend in that moment. So, this indicator is providing some kind of direction of the trend, and, besides, it allows us to set stop loss and to define the reversal of the price movement. Many traders are using this indicator together with SMA indicators for example: 55 SMA in intra-day basis, 100 SMA and 200 SMA.

0
newdigital Sergey Golubev 2026.01.15 17:11
Ichimoku Cloud: identify the trend, helps you to place stops and recognize when should be bullish or bearish (and why) GBPJPY Pound Sterling vs Yen
Ichimoku Cloud: identify the trend, helps you to place stops and recognize when should be bullish or bearish (and why)
Ichimoku is the indicator which is also well-known trading system by itself.. The creator of the indicator (Goichi Hosada) introduced Ichimoku in the beginnig as the indicator which is having the ability to determine whether a tradable trend is present or we should wait for for direction. And the one of the main component of Ichimoku indicator is the Cloud. To make it shorter - the traders should always look at the price (as the main indicator in this case) to be above/below or inside the cloud to understand the market condition in general: if the price is above the cloud so it is for primary bullish market condition, if the price is below the cloude - it means that the price is located in the primary bearish area of the chart, and if the price is inside the cloud so it is for the secondary ranging condition waiting for the direction.
0
newdigital Sergey Golubev 2026.01.13 10:13
How to estimate the valid condition for buy position just plotting two SMA indicators to the chart USDJPY US Dollar vs Yen
How to estimate the valid condition for buy position just plotting two SMA indicators to the chart
When plotting two SMA indicators to the chart (SMA with the period of 100 and SMA with 200) so we can look at the price - about the location of the price cmpare with 100 SMA/200 SMA. If 100 SMA is located above 200 SMA and the price is above 200 SMA so it means that the price is located in the primary bullish area of the chart. But there is the ranging zone between 100 SMA and 200 SMA, so the valid condition for buy order in this case is the following: if the price breaks 100 SMA to above on close bar so we may consider to open buy trade. Recommendation: please confirm any possible buy position with some other indicators.
0
newdigital Sergey Golubev 2026.01.13 09:48
RSI - traditional general approach GBPJPY Pound Sterling vs Yen
RSI - traditional general approach
The Relative Strength Index is arguably the most popular oscillator out there. A big component of its formula is the ratio between the average gain and average loss over the last 14 periods. The RSI is bound between 0 – 100 and is considered overbought above 70 and oversold when below 30. Traders generally look to sell when 70 is crossed from above and look to buy when 30 is crossed from below.
0
newdigital Sergey Golubev 2026.01.13 09:36
DeMarker - traditional general approach
50
HK50 HK50
DeMarker - traditional general approach
The DeMarker indicator named after Thomas DeMark is a momentum oscillator very similar in nature to the Relative Strength Index (RSI) developed by Welles Wilder. By comparing inter-period price maxima and minima the DeMarker indicator attempts to gather information about price movements to help determine the underlying trend strength and identify over-bought/sold trade conditions. The Default time span for the calculation of the DeMarker indicator is 14 periods. The overbought and oversold lines are typically drawn at 0.7 and 0.3, respectively. Traders should look to go long when the DeMarker falls below 0.3 and look to go short when the DeMarker rises above 0.7 and falls back below it.
0
newdigital Sergey Golubev 2026.01.13 07:35
Alligator - traditional general approach AUDUSD Australian Dollar vs US Dollar
Alligator - traditional general approach

The alligator was first described by Bill Williams in his book New Trading Dimensions. There are three smoothed moving averages using 13, eight, and five periods and shift them by eight, five, and three bars into the future. The longest period line is blue (the alligator's jaw), the middle one is red (the alligator's teeth), and the shortest one is green (the alligator's lips). According to Williams, when these three moving averages are twisted together, it means the alligator indicator rests, and so we also rest. But the longer the alligator sleeps, the hungrier it is. So when the alligator awakes after a good, long rest it is very hungry to hunt for food. And its food is price. For example: when all three lines are aligned, going up one after another with the green being greater than red being greater than blue, prices are in an uptrend. You need to look into the possibility of buying (opposite to sell).

0
newdigital Sergey Golubev 2026.01.13 05:53
Moving Averages - traditional general approach EURUSD Euro vs US Dollar
Moving Averages - traditional general approach
Moving Average (MA for short) is a technical tool that averages a currency pair’s price over a period of time. The smoothing effect this has on the chart helps give a clearer indication on what direction the pair is moving either up, down, or sideways. There are a variety of moving averages to choose from. Simple Moving Averages and Exponential Moving Averages are by far the most popular. The traders are usually using SMA indicators with the period of 100 and 200 to estimate the market condition, and with the periods of 55 and 11 for intra-day trading for example.
0
newdigital Sergey Golubev 2026.01.13 05:33