

 Apri profilo MQL5
Grafici & Idee
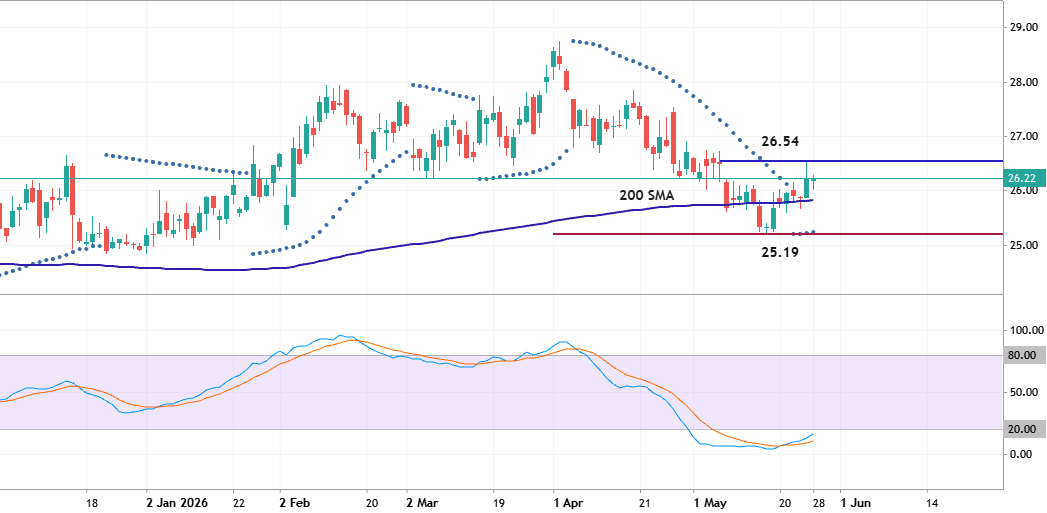

PFE - Daily Trading Forecast
Daily price was bounced from support level at 25.19 to above for 200 SMA to be crossed for the bullish trend to be resumed. Stochastic oscillator is showing the oversold market condition for the price, and Parabolic SAR is on uptrend for the price to be started so the bullish trend continuation is very likely for D1 price for example. if the price breaks 26.54 resistance level to above for the 27.85 possible target so the primary bullish trend will be resumed; If the price crosses support level at 25.19 to below so the bearish reversal will be started with 24.83 as the target to re-enter; alternatively, the price will be on secondary ranging to be near 200 SMA waiting for the direction of the strong trend to be started. Trading Summary : ranging for direction
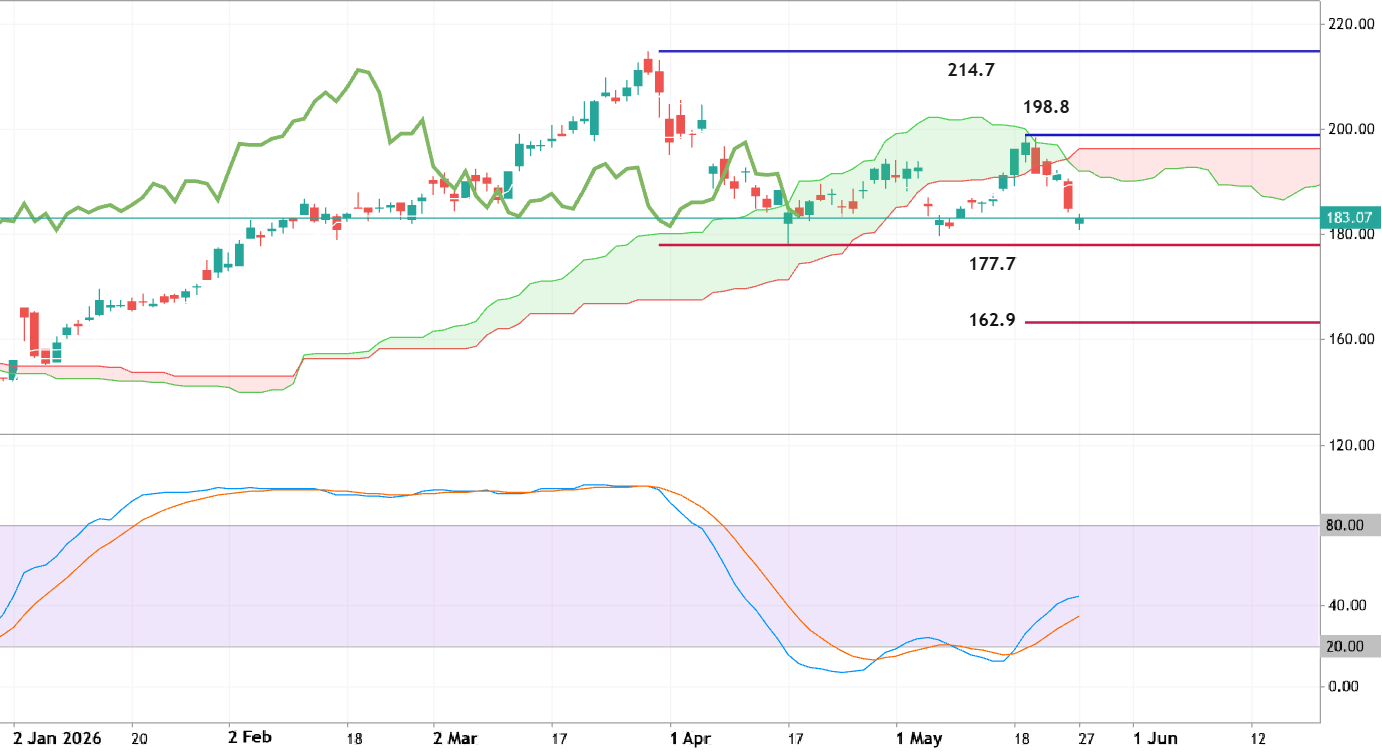

CVX - Daily Trading Forecast
Daily price broke Ichimoku cloud to below for the primary daily bearish reversal. Chinkou Span line of Ichimoku indicator is crossing the historical price to below for the good bearish breakdown but Stochastic oscillator is indicating the possible rally in the near future. If the price breaks support level at 177.7 to below with 162.9 level as a possible target so the bearish trend will be continuing. If the price crosses resistance level at 198.8 to above with 214.7 level as a possible target so the bullish reversal will be started. Alternatively, the price will be on secondary ranging waiting for direction. Trading Summary : daily bearish reversal; watch the s/r levels for the next direction
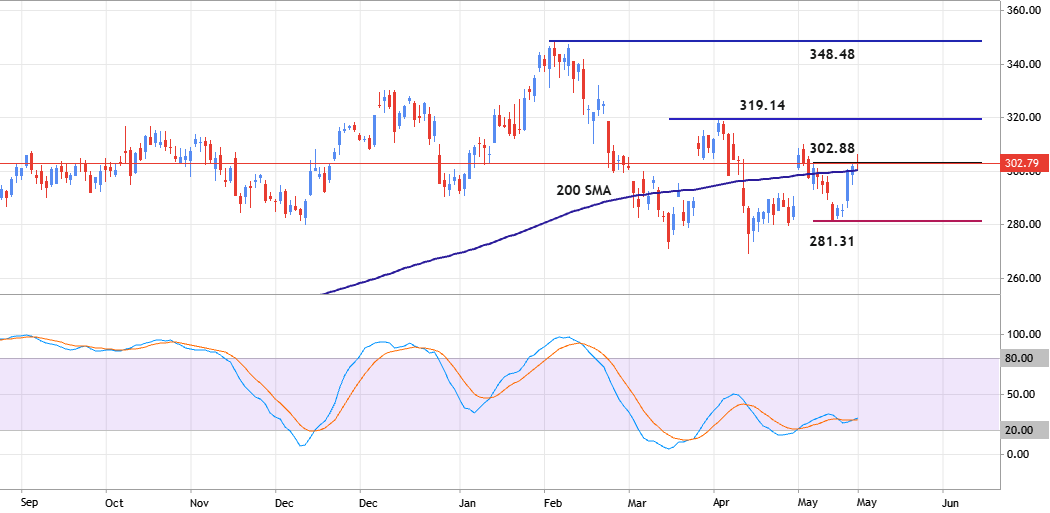

GE - Daily Ranging for Direction
The daily price is on ranging near and above 200 SMA: if the price breaks 302.88 level to above for the daily close bar and with 319.14 target to re-enter so the primary bullish trend will be resumed and continuing; if the price crosses 200 SMA to below together with 281.31 support so the bearish reversal will be started; alternatively, the price will be on the ranging to be near and around 200 SMA waiting for the direction of the trend to be started. Trading Summary : ranging for direction
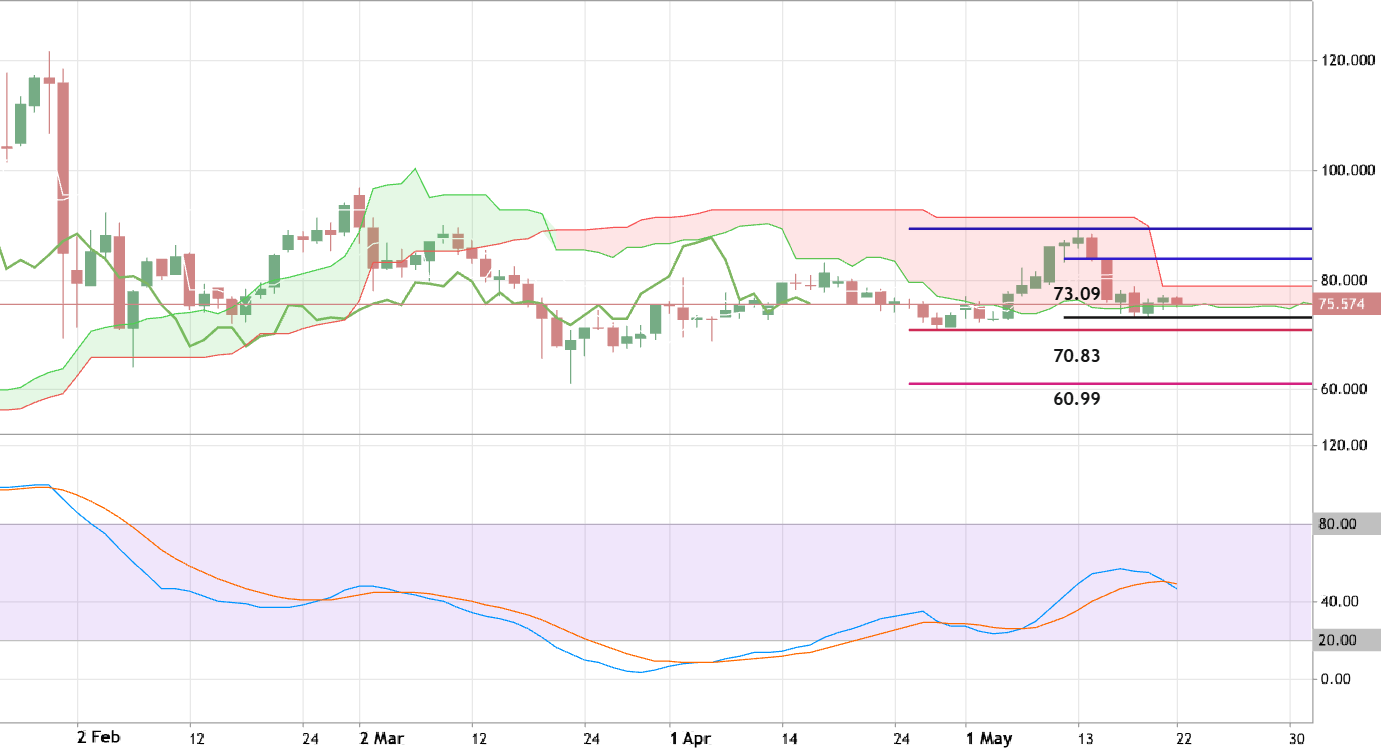
XAGUSD - Daily Ranging for the Possible Bearish Reversal
Daily price is breaking the Ichimoku cloud with Senkou Span A together with support level at 73.09 to below for the bearish reversal to be started. Chinkou Span line already crossed the historical price to below and Stochastic oscillator is showing the downtrend to be started in the near future. If the price breaks 73.09 support to below so the primaru bearish reversal will be started with 70.83 target to re-enter. If the price crosses resistance level at 83.86 to above so the primary bullish trend will be resumed with 89.38 as a possible target. Alternatively, the price will be on secondary ranging to be near and inside Ichimoku cloud waiting for the direction of the strong trend to be started for example. Trading Summary : waiting for direction
EURCHF - Daily Bearish Reversal
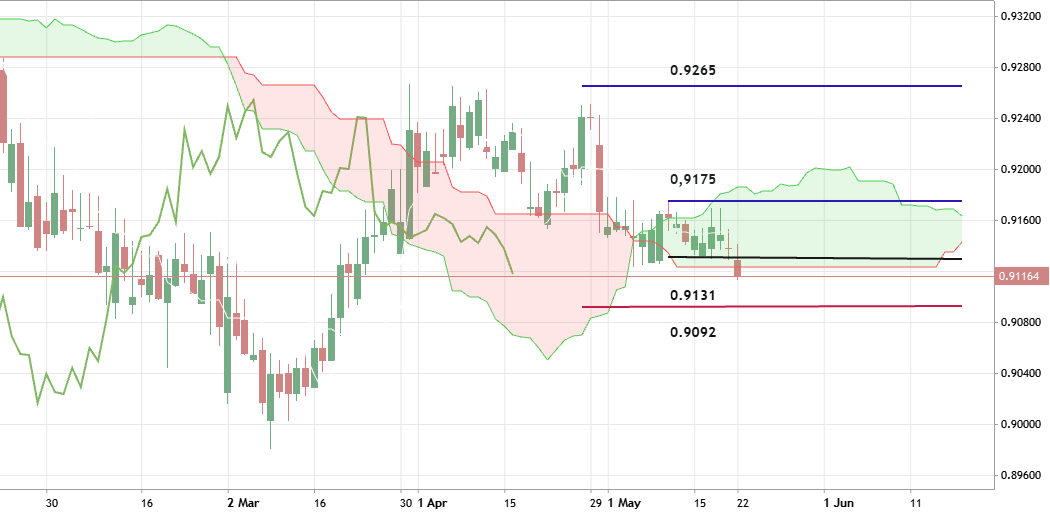
Daily price is breaking the descending triangle pattern with support at 0.9131 together with Ichimoku cloud to below for the good breakdown with the primary bearish reversal to be started. If the price breaks 0.9131 support to below on close daily bar so the primary bearish reversal will be continuing with 0.9092 level as a possible target to re-enter. If the price crosses the resistance level at 0.9175 so the primaru bulish trend will be resumed with the secondary ranging condition and with 0.9265 possible target. Alternatively, the price will be on ranging within s/r levels to be near and inside Ichimoku cloud waiting for the direction of the strong trend to be started. Trading Summary : possible daily bearish reversal
CADJPY - Possible Daily Breakdown with the Bearish Reversal
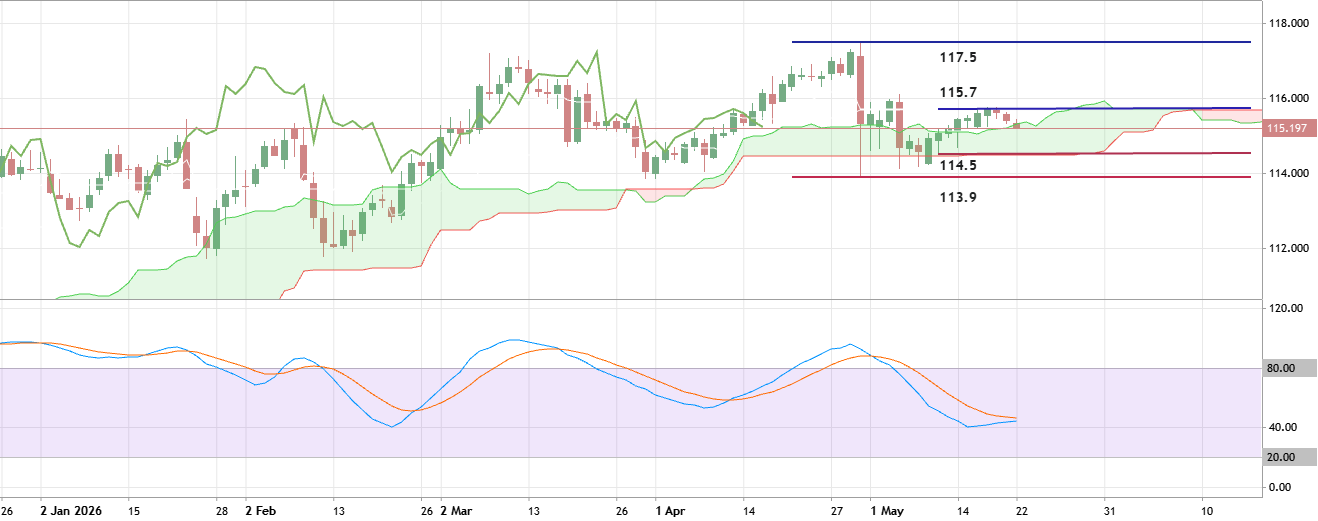
Daily price is located above and near Ichimoku cloud in the bullish area of the chart. The price was bounced from resistance level at 115.7 to below to cross the Ichimoku cloud border from above. Besides, the Chinkou Span line of Ichimoku indicator is breaking the historical price to below for the good breakdown to be started, and Stochastic oscillator is indicating the downtrend in the near future. If the price breaks support level at 114.5 to below so the primary bearish reversal will be started with 113.9 as a possible target. If the price crosses resistance at 115.7 to above so the primary bullish trend will be resumed with 117.5 possible target. Alternatively, the price will be on secondary ranging within s/r levels waiting for direction. Trading Summary : possible daily breakdown

BAC - Daily Trading Forecast
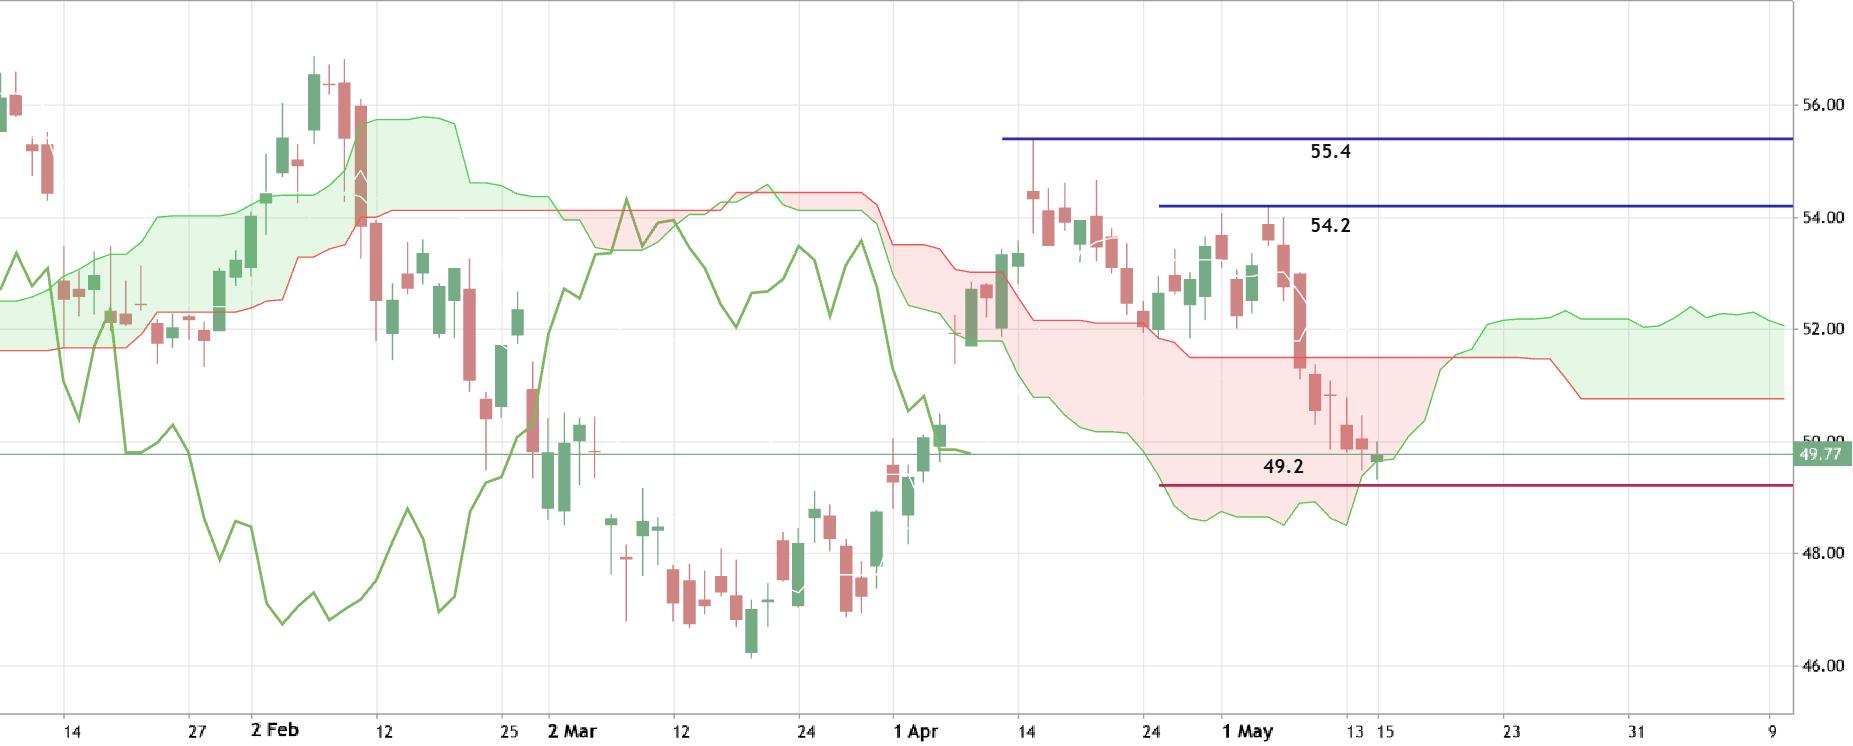
The Ichimoku cloud was almost broken by the daily price to below for the good daily bearish reversal, and the Chinkou Span line of Ichimoku indicator is showing the daily breakdown to be started. If the price breaks the support level at 49.2 to below on the daily close bar so the daily price will come to the bearish area of the chart with the bearish reversal for example. If the price crosses the resistance level at 54.2 to above for the possible target to re-enter as 55.4 resistance so the primary bullish trend will be resumed. Alternatively, the price will be on ranging within s/r levels waiting for direction. Trading Summary : possible bearish reversal

SHEL - Daily Trading Forecast
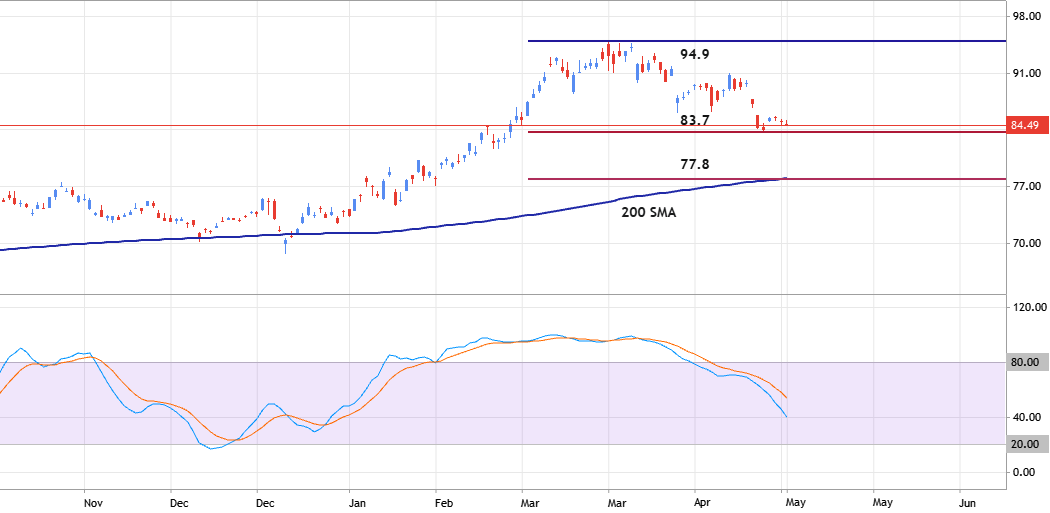
Daily price is located above 200 SMA in the bullish area of the chart. The price was bounced from 94.9 resistance level to below for the secondary correction to be started and with Stochastic oscillator to be confirmed this short term trend for example. For now, the price is trying to break the descending triangle pattern with support level at 83.7 for the correction to be continuing up to the bearish reversal support level at 77.8. Alternatively, the price will be on the secondary ranging within s/r levels of the primary bullish trend waiting for the direction of the strong bullish trend to be continuing in the case of resistance level at 94.9 to be broken to above or to the primary bearish reversal to be started with 77.8 support level to be crossed to below on the close daily bar for

GOOGL - Technical Analysis 2026
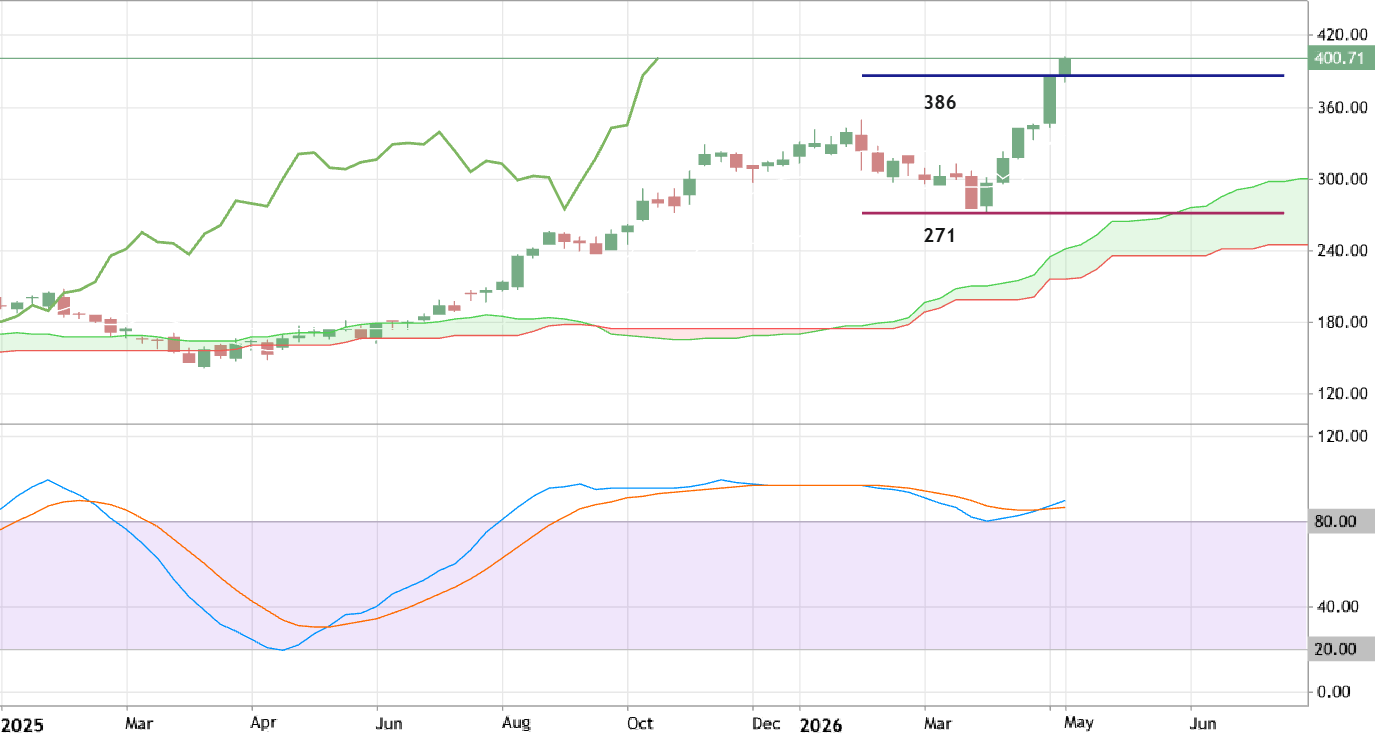
The weekly price is on strong bullish breakout for crossing the resistance level at 386 to above for the strong bullish trend to be continuing . Chinkou Span line of Ichimoku indicator is showing the strong bullish breakout but Stochastic oscillator is indicating the overbought market condition for example, and if the price breaks the support level at 271 to below so the primary bearish reversal will be started . Alternatively, the price will be on bullish ranging within the possible new levels waiting for direction. Trading Summary : possible bullish trend to be continuing.
XRPUSD - Long-Term Technical Forecast
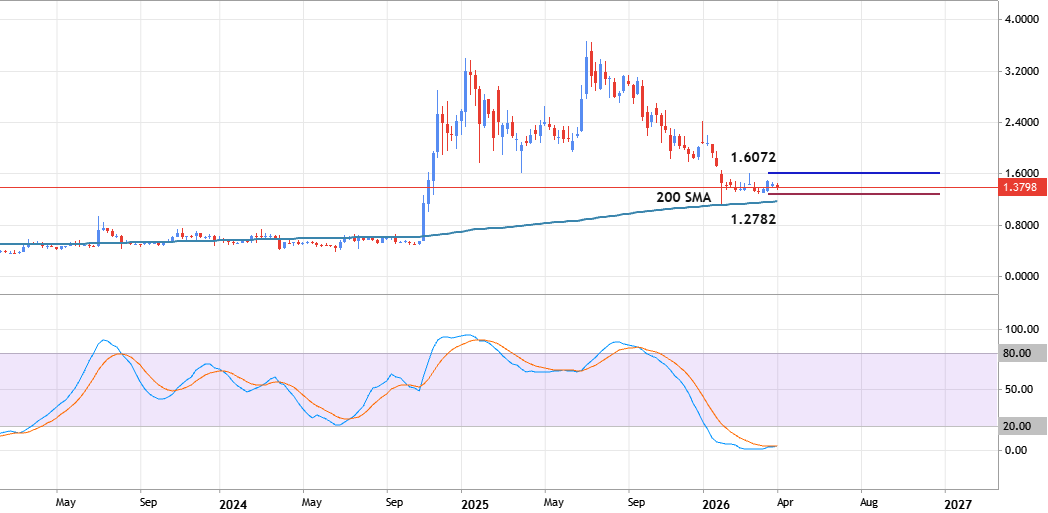
Weekly price is on ranging near and above 200 SMA in the bullish area of the chart. The price is located within 1.2782/1.6072 s/r channel waiting for the bullish trend to be continuing with 1.6072 resistance to be broken on close weekly bar or for the primary weekly bearish reversal to be started with the price to be crossed 200 SMA together with 1.2782 support level to below. Stochastic oscillator is on oversold market condition so the most likely scenario is the primary bullish trend to be resumed. Trading Summary : waiting for direction

IBIT - Trading Ideas for 2026
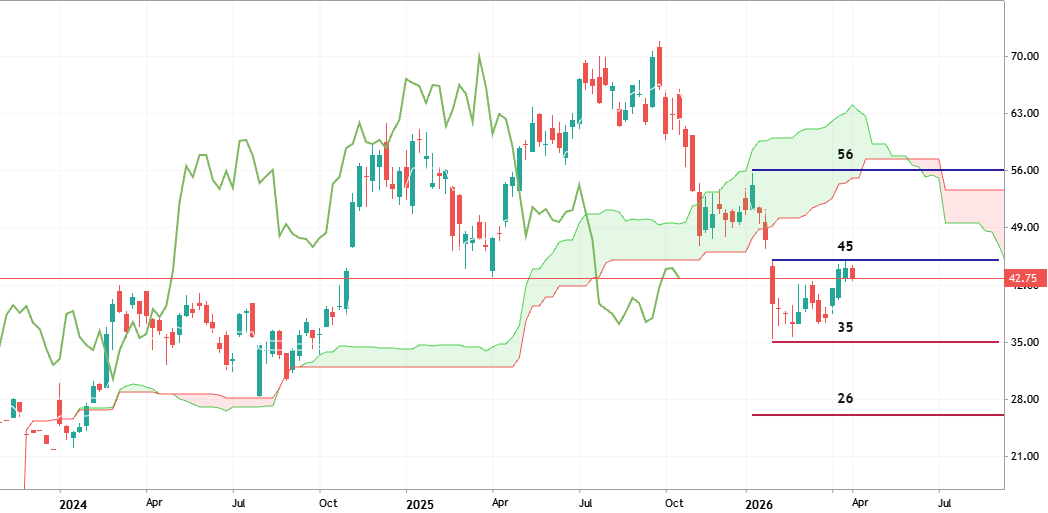
The weekly price is located near and below Ichimoku cloud in the bearish area of the chart for the secondary ranging within 35/45 s/r channel waiting for the direction of the bearish trend to be continuing or for the bear market rally to the possible bullish reversal to be started. There are key s/r levels for possible breakout and breakdown to be formed, for example: 26 support for possible bearish breakdown and resistance level at 56 for the possible bullish breakout. Trading Summary : wait for the s/r levels to be crossed on the close weekly bar for the bearish trend to be continuing or for the rally-to-reversal to be started.
XNGUSD - Long-Term Technical Forecast
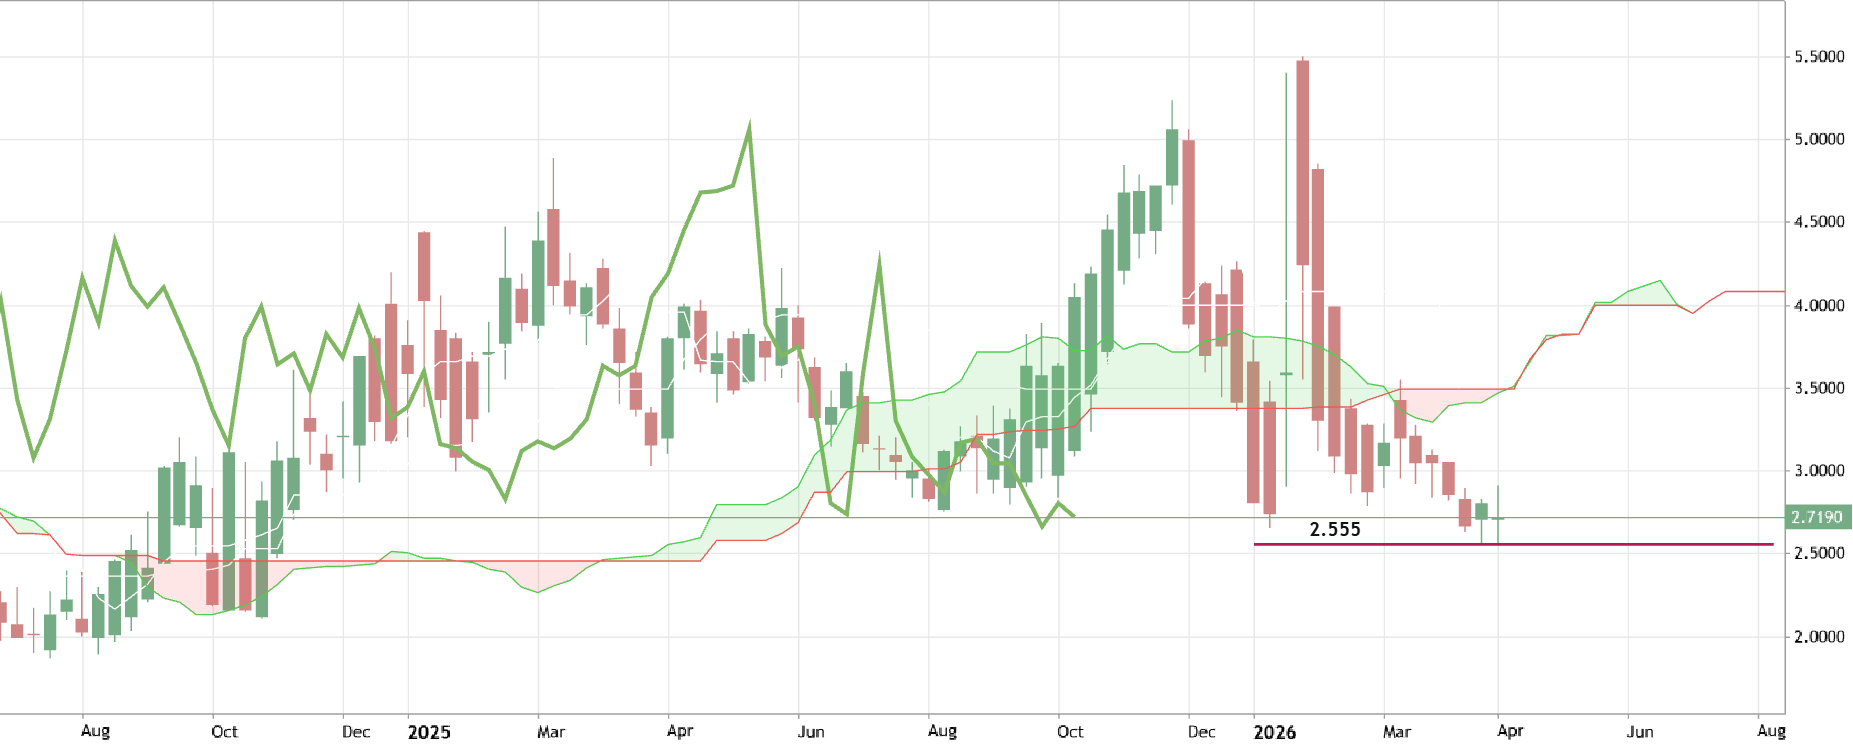
The weekly price is located below Ichimoku loud in the bearish area of the chart. The price is on ranging to be near and below Ichimoku cloud for trying to break the support level at 2.555 to below for the bearish ranging trend to be continuing. Alternatively (and based on fundamental factors) the price will be bounced from the support level to above for the primary bullish reversal to be started. Most likely scenario : ranging