
PYPL
#320
PayPal Holdings, Inc. - Common Stock
56.1 6 USD
+0.17%
Сектор: Финансы
Базовая: USD
Валюта прибыли: USD
Дневной диапазон
Годовой диапазон
Дневное изменение
+17.18%
Месячное изменение
+28.81%
6-месячное изменение
+1.04%
Годовое изменение
-22.51%
Предыдущее закрытие
55.5 1
Open
55.4 1
Low
55.2 8
High
56.3 0
Volume
9 094
Financials
Значение Q1, 25Q2, 25Q3, 25Q4, 25Q1, 26 Current
Key stats
Valuation ratios
Profitability ratios
Liquidity ratios
Solvency ratios
Per share metrics
Новости
Cantor Fitzgerald сохраняет нейтралитет по PayPal на фоне переговоров
Canaccord повысил целевую цену акций PayPal
Clear Street присвоил PayPal рейтинг «держать»
Рынок акций США закрылся ростом, Dow Jones прибавил 0,29%
Macquarie подтверждает рейтинг PayPal на фоне сделки
Wolfe Research о слухах о поглощении PayPal
Stripe и PE-фонд предложили купить акции PayPal за $60,50
Mizuho подтверждает нейтральный рейтинг PayPal на фоне слухов о покупке Stripe
TD Cowen подтверждает рейтинг «держать» по акции PayPal
William Blair подтверждает рейтинг PayPal на фоне сообщений о поглощении
Берри отверг предложение о покупке PayPal: «$60,50 — слишком мало»
Графики и идеи
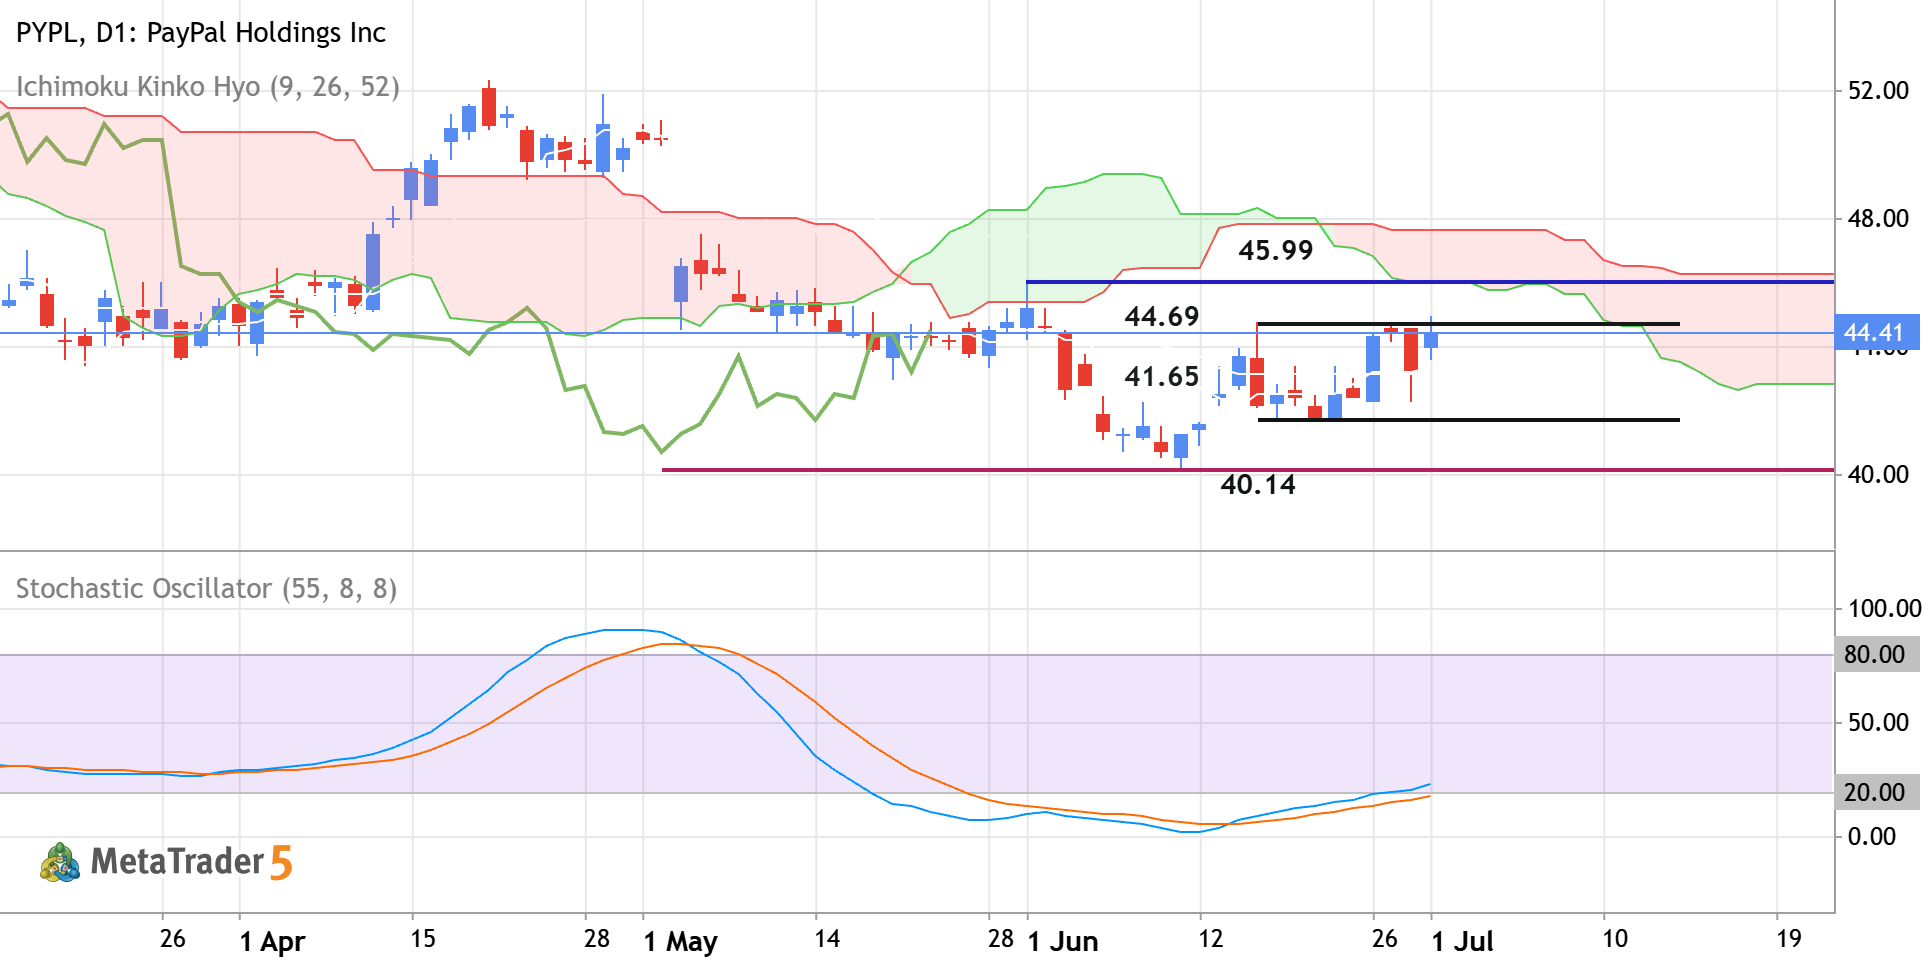
PYPL - Daily Rally to the Possible Bullish Reversal
Daily price is located near and below Ichimoku cloud in the bearish area of the chart. The price was blinced from resistance levels at 40.14 and 41.65 to above for the bear market rally to be started. The Stochastic oscillator is showing the possible uptrend in the near future, and Chinkou Span line is crossing historical price but on open daily bar for now. If the price breaks the resistance level at 44.69 to the 45.99 to above so the primary bullish reversal will be started. If the price crosses support at 41.65 together with support level at 40.14 to below so the primary bearish trend will be resumed. Alternatively, the price will be on secondary ranging within the primary bearish trend to be near and below Ichimoku cloud waiting for direction of the strong trend to be started. Trading
0 

The PYPL doesn’t have other trading ideas at this time
Browse ready-made trading ideas or select a symbol and create your own
Go to Charts and Trading Ideas