
PYPL
#320
PayPal Holdings, Inc. - Common Stock
55.5 1 USD
+0.17%
Secteur: Financier
Base: USD
Devise de Profit: USD
Range quotidien
Range Annuel
Changement quotidien
+17.18%
Changement Mensuel
+27.32%
Evolution sur 6 mois
-0.13%
Changement Annuel
-23.40%
Clôture Précédente
47.3 7
Open
55.5 2
Low
55.5 1
High
55.5 2
Volume
302
Financials
Valeur Q1, 25Q2, 25Q3, 25Q4, 25Q1, 26 Current
Key stats
Valuation ratios
Profitability ratios
Liquidity ratios
Solvency ratios
Per share metrics
Nouvelles
Canaccord relève son objectif de cours sur PayPal après la transition de PDG
Clear Street initie une couverture de PayPal avec un avis Neutre
Macquarie maintient sa note sur PayPal grâce aux avantages de financement
Wolfe Research commente les rumeurs d’offre de rachat de PayPal
Stripe et une firme de capital-investissement offrent d’acquérir PayPal à 60,50$ par action
Mizuho maintient la note Neutre sur PayPal en pleine rumeur de rachat par Stripe
TD Cowen maintient sa recommandation "Conserver" sur PayPal au milieu des spéculations de rachat
William Blair maintient sa recommandation sur PayPal après des rumeurs de rachat
Burry rejette l’offre de rachat de PayPal : "60,50$ est tout simplement trop bas"
Pourquoi l’action PayPal s’envole-t-elle aujourd’hui ?
L'action de PayPal grimpe de près de 15 % en préouverture alors que Stripe et Advent International proposent conjointement une acquisition de 53 milliards de dollars | Benzinga France
Graphique & Idées
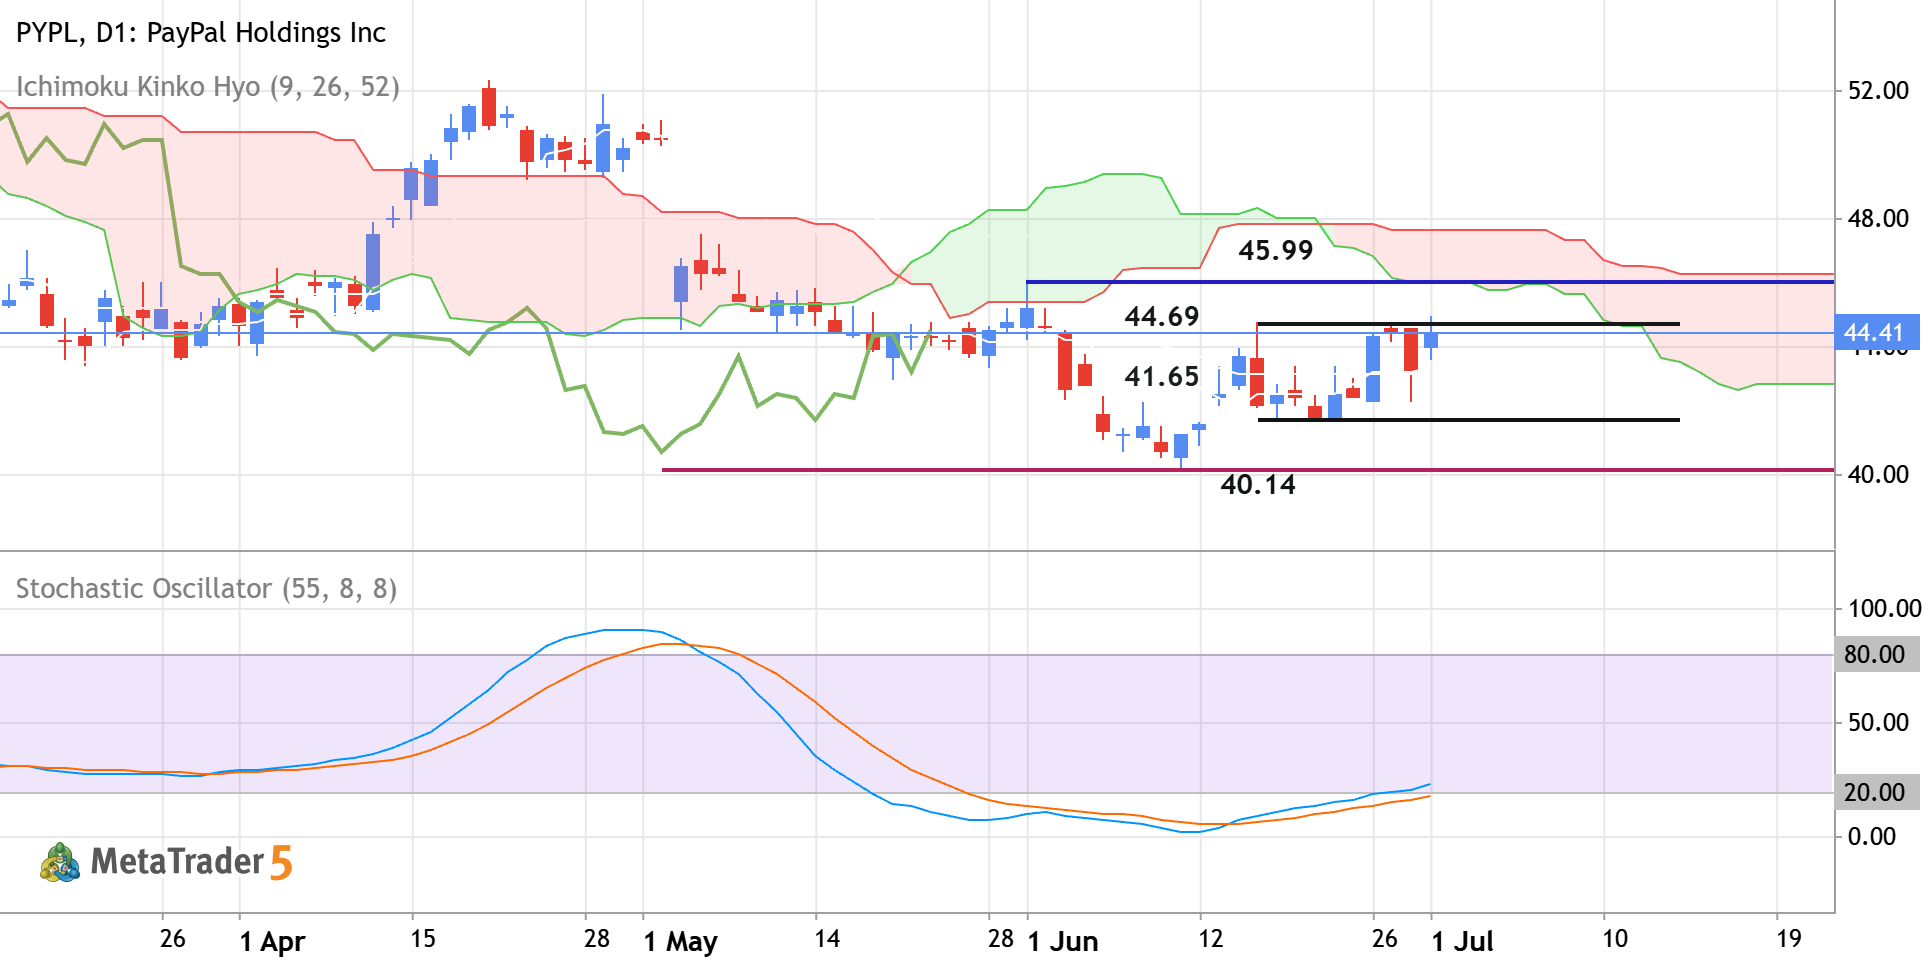
PYPL - Daily Rally to the Possible Bullish Reversal
Daily price is located near and below Ichimoku cloud in the bearish area of the chart. The price was blinced from resistance levels at 40.14 and 41.65 to above for the bear market rally to be started. The Stochastic oscillator is showing the possible uptrend in the near future, and Chinkou Span line is crossing historical price but on open daily bar for now. If the price breaks the resistance level at 44.69 to the 45.99 to above so the primary bullish reversal will be started. If the price crosses support at 41.65 together with support level at 40.14 to below so the primary bearish trend will be resumed. Alternatively, the price will be on secondary ranging within the primary bearish trend to be near and below Ichimoku cloud waiting for direction of the strong trend to be started. Trading
0 

The PYPL doesn’t have other trading ideas at this time
Browse ready-made trading ideas or select a symbol and create your own
Go to Charts and Trading Ideas