
PYPL
#320
PayPal Holdings, Inc. - Common Stock
56.1 6 USD
+0.17%
Sektör: Finansal
Baz: USD
Kar Para Birimi: USD
Günlük Aralık
Yıllık Aralık
Günlük Değişim
+17.18%
Aylık Değişim
+28.81%
6 Aylık Değişim
+1.04%
Yıllık Değişim
-22.51%
Önceki Kapanış
55.5 1
Open
55.4 1
Düşük
55.2 8
High
56.3 0
Hacim
9 094
Financials
Değer Q1, 25Q2, 25Q3, 25Q4, 25Q1, 26 Current
Key stats
Valuation ratios
Profitability ratios
Liquidity ratios
Solvency ratios
Per share metrics
Haberler
Cantor Fitzgerald, PayPal hissesi için Neutral görüşünü korudu
Canaccord, PayPal için hisse fiyat hedefini yükseltti
Clear Street, PayPal hissesi için yeniden yapılanma belirsizliği nedeniyle Tut önerisi verdi
Macquarie, PayPal hissesi için tavsiyesini yineledi
Wolfe Research, PayPal hisse satın alma teklifleri hakkında yorum yaptı
Stripe ve özel sermaye şirketi PayPal hisselerini 60,50 dolardan almayı teklif etti
Mizuho, Stripe satın alma haberi sonrası PayPal hissesi için Nötr görüşünü korudu
TD Cowen, satın alma spekülasyonları arasında PayPal için Tut önerisini korudu
William Blair, satın alma habri sonrası PayPal hisse notunu korudu
Burry PayPal teklifini yetersiz buldu: "60,50 dolar çok düşük"
PayPal hisseleri neden bugün yükseliyor?
Grafikler ve Fikirler
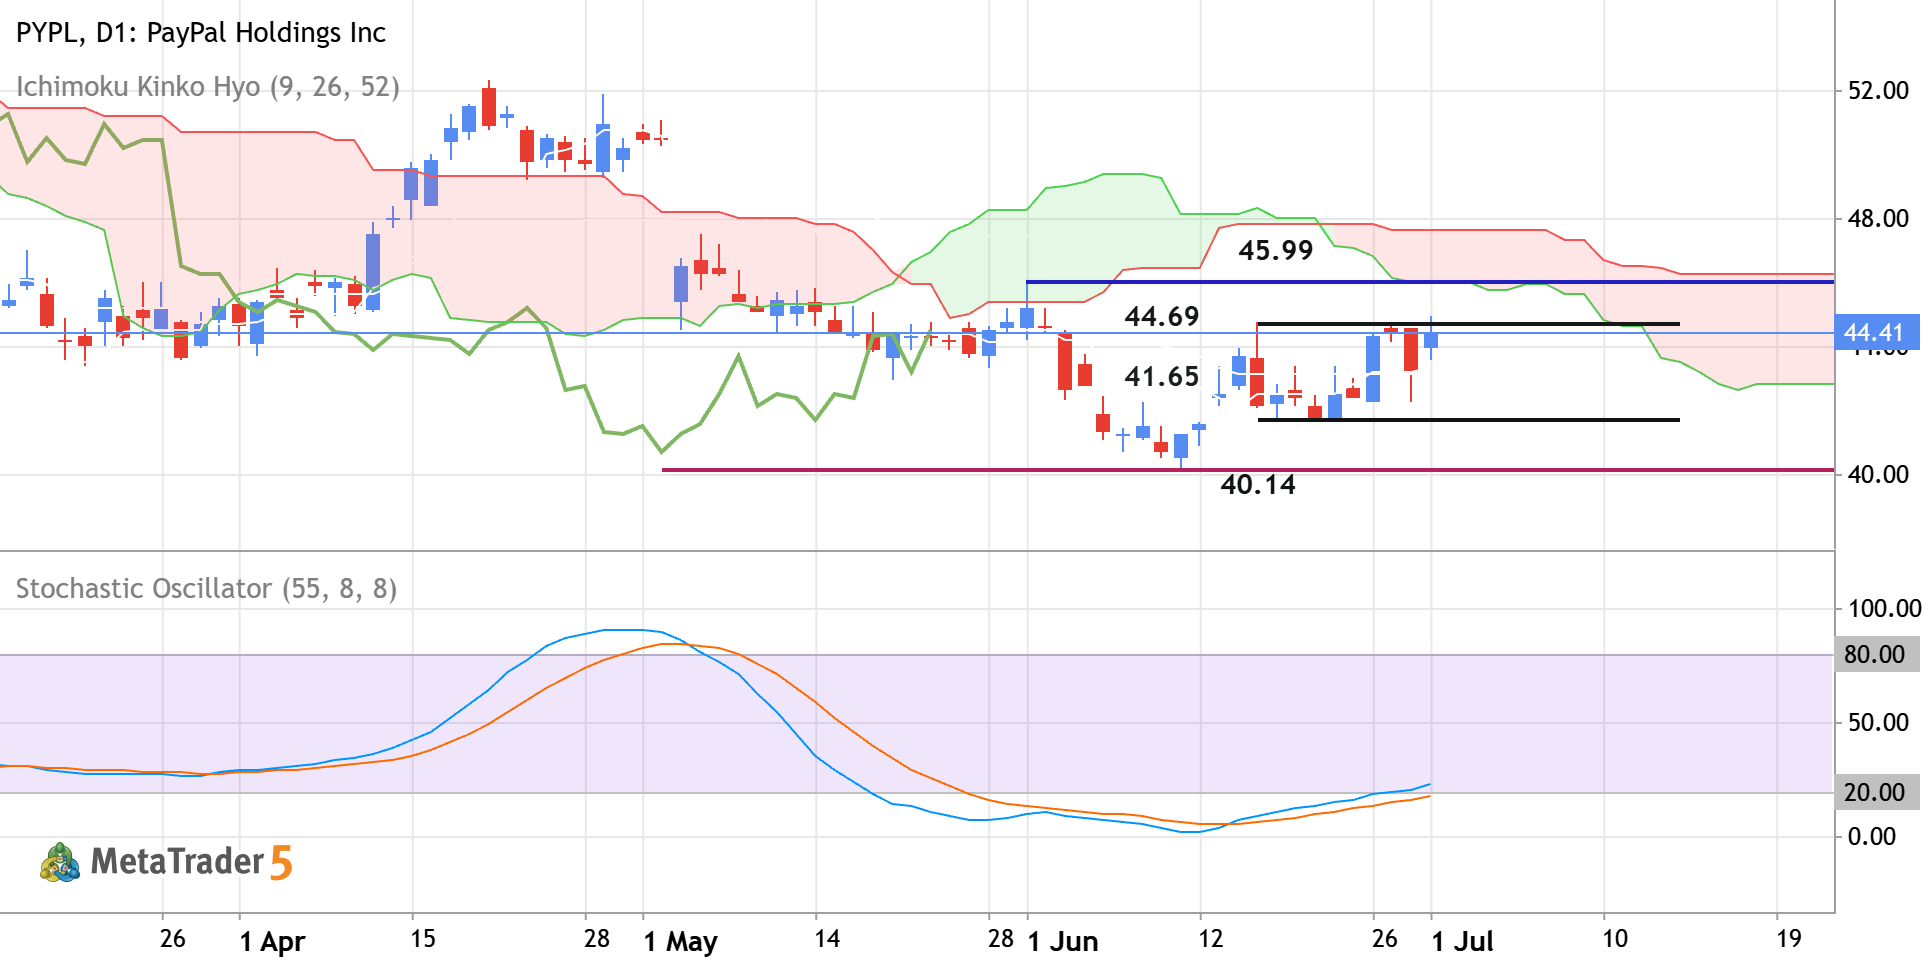
PYPL - Daily Rally to the Possible Bullish Reversal
Daily price is located near and below Ichimoku cloud in the bearish area of the chart. The price was blinced from resistance levels at 40.14 and 41.65 to above for the bear market rally to be started. The Stochastic oscillator is showing the possible uptrend in the near future, and Chinkou Span line is crossing historical price but on open daily bar for now. If the price breaks the resistance level at 44.69 to the 45.99 to above so the primary bullish reversal will be started. If the price crosses support at 41.65 together with support level at 40.14 to below so the primary bearish trend will be resumed. Alternatively, the price will be on secondary ranging within the primary bearish trend to be near and below Ichimoku cloud waiting for direction of the strong trend to be started. Trading
0 

The PYPL doesn’t have other trading ideas at this time
Browse ready-made trading ideas or select a symbol and create your own
Go to Charts and Trading Ideas