
PYPL
#320
PayPal Holdings, Inc. - Common Stock
56.1 6 USD
+0.17%
Sektor: Finanzen
Basis: USD
Gewinnwährung: USD
Tagesspanne
Jahresspanne
Tagesänderung
+17.18%
Monatliche Änderung
+28.81%
6 month change
+1.04%
Jahresänderung
-22.51%
Vorheriger Schlusskurs
55.5 1
Open
55.4 1
Tief
55.2 8
High
56.3 0
Volumen
9 094
Financials
Wert Q1, 25Q2, 25Q3, 25Q4, 25Q1, 26 Current
Key stats
Valuation ratios
Profitability ratios
Liquidity ratios
Solvency ratios
Per share metrics
Nachrichten
Fokus auf CEO-Wechsel: Canaccord hebt Kursziel für PayPal an
Clear Street startet PayPal-Coverage mit "Halten" wegen Restrukturierungs-Unsicherheit
ROUNDUP/Aktien New York Schluss: Wall Street steigt etwas - Nasdaq schwächelt
AKTIE IM FOKUS 2: Übernahmefantasie treibt Paypal an
Macquarie bestätigt PayPal-Rating angesichts von Finanzierungsvorteilen bei möglicher Übernahme
Aktien New York: Wall Street legt etwas zu - Nasdaq schwächelt
Kreise: Paypal vor Kaufofferte von Konkurrent Stripe und Finanzinvestor Advent
Wolfe Research kommentiert Gerüchte über Übernahmeangebot für PayPal
ROUNDUP/Aktien New York: Dow im Plus - Nasdaq schwächelt
Stripe und Private-Equity-Firma bieten 60,50 Dollar pro Aktie für PayPal
Mizuho bestätigt "Neutral"-Einstufung für PayPal nach Gerüchten über Stripe-Übernahme
Charts & Ideen
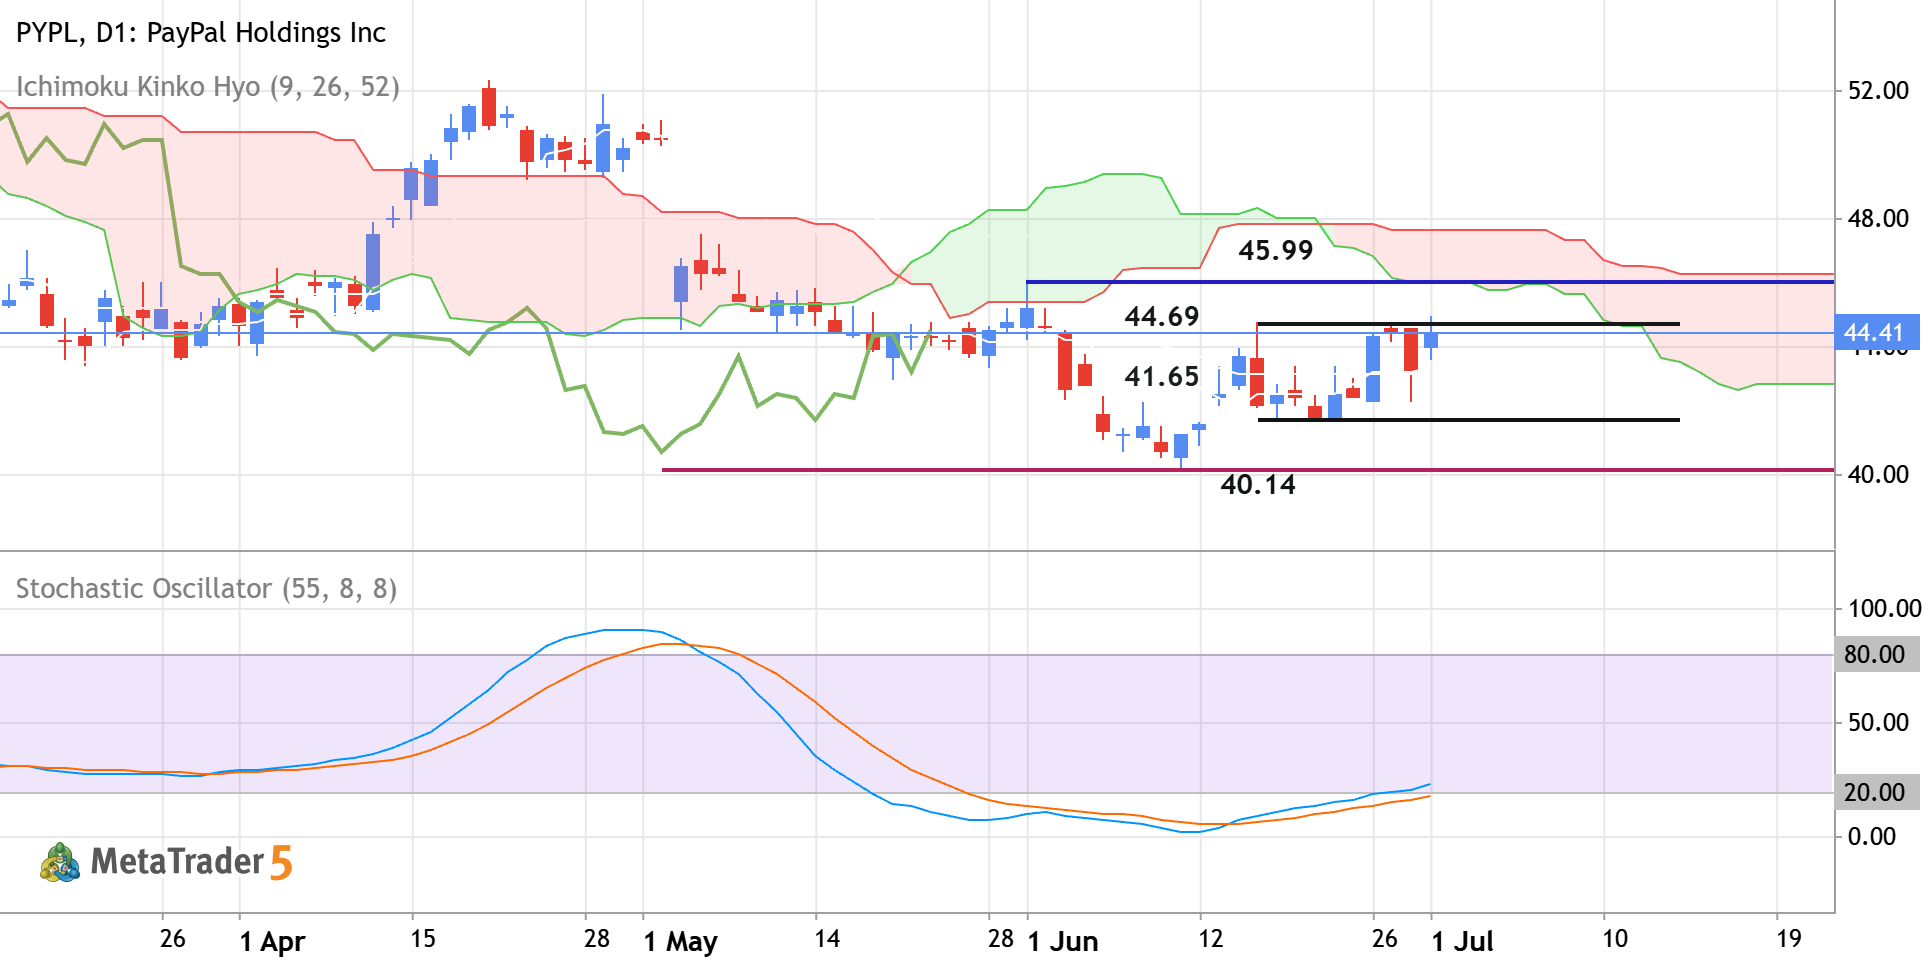
PYPL - Daily Rally to the Possible Bullish Reversal
Daily price is located near and below Ichimoku cloud in the bearish area of the chart. The price was blinced from resistance levels at 40.14 and 41.65 to above for the bear market rally to be started. The Stochastic oscillator is showing the possible uptrend in the near future, and Chinkou Span line is crossing historical price but on open daily bar for now. If the price breaks the resistance level at 44.69 to the 45.99 to above so the primary bullish reversal will be started. If the price crosses support at 41.65 together with support level at 40.14 to below so the primary bearish trend will be resumed. Alternatively, the price will be on secondary ranging within the primary bearish trend to be near and below Ichimoku cloud waiting for direction of the strong trend to be started. Trading
0 

The PYPL doesn’t have other trading ideas at this time
Browse ready-made trading ideas or select a symbol and create your own
Go to Charts and Trading Ideas