
PYPL
#320
PayPal Holdings, Inc. - Common Stock
56.1 6 USD
+0.17%
Sector: Financial
Base: USD
Profit Currency: USD
Daily Range
Year Range
Daily Change
+17.18%
Monthly Change
+28.81%
6 month change
+1.04%
Year Change
-22.51%
Previous Close
55.5 1
Open
55.4 1
Low
55.2 8
High
56.3 0
Volume
9 094
Financials
Value Q1, 25Q2, 25Q3, 25Q4, 25Q1, 26 Current
Key stats
Valuation ratios
Profitability ratios
Liquidity ratios
Solvency ratios
Per share metrics
News
Paypal (PYPL) Moves 17.2% Higher: Will This Strength Last?
Company News for July 16, 2026
Stocks Slip Before the Open as Chipmakers Extend Slide, U.S. Retail Sales Data and Earnings on Tap
ASTS, PYPL, AAPL, MU, SNDK: 5 Trending Stocks Today - SanDisk (NASDAQ:SNDK)
PayPal: Gotta Raise The Bid (NASDAQ:PYPL)
Stripe-PayPal deal could accelerate shift to blockchain-based money, Polygon exec says
PayPal: A Bargain For Stripe, A Bad Deal For Shareholders (NASDAQ:PYPL)
Dow Jones Futures: Apple, Google Mask Dell, Sandisk, Micron Sell-Off; J.B. Hunt Jumps Late
Broader Market Settles Higher as Positive Inflation News Outweighs Chip Rout
Stock Market Today: SPY, QQQ Mixed as PPI Inflation Cools; Trump Ramps Up Pressure on Iran - TipRanks.com
The $53 Billion Reason PayPal Stock Is Up Today
Charts & Ideas
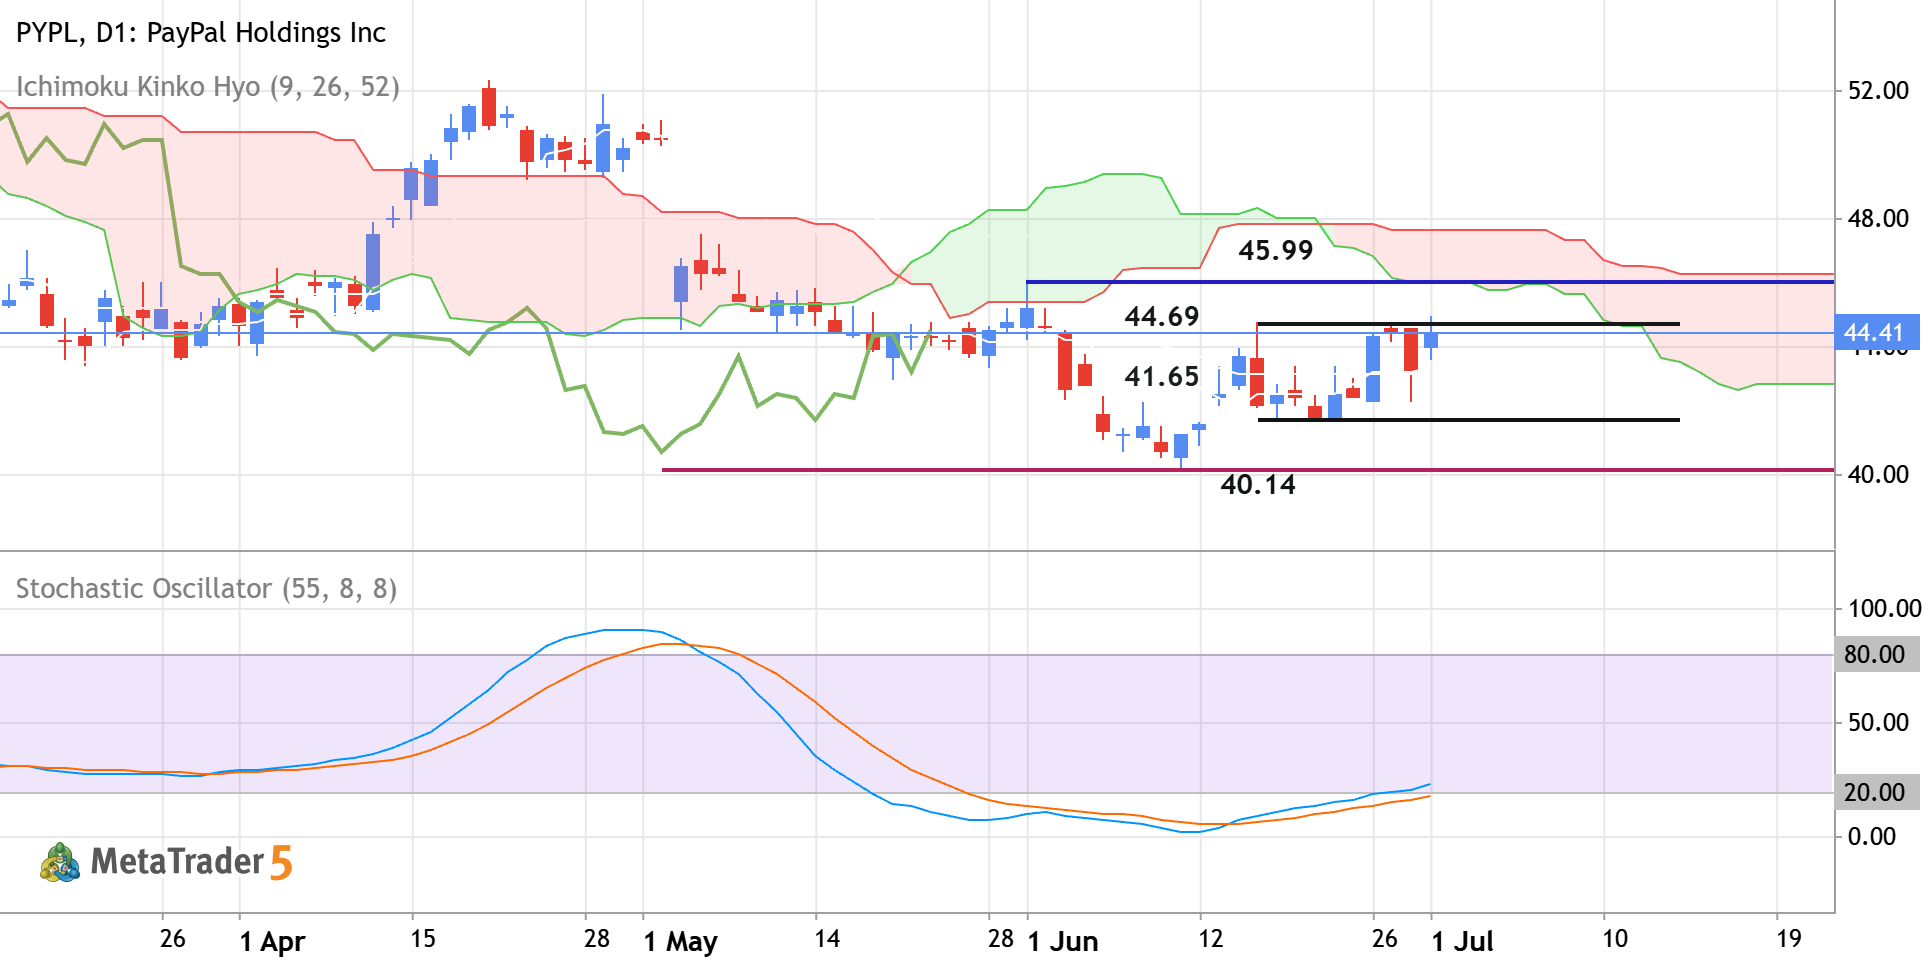
PYPL - Daily Rally to the Possible Bullish Reversal
Daily price is located near and below Ichimoku cloud in the bearish area of the chart. The price was blinced from resistance levels at 40.14 and 41.65 to above for the bear market rally to be started. The Stochastic oscillator is showing the possible uptrend in the near future, and Chinkou Span line is crossing historical price but on open daily bar for now. If the price breaks the resistance level at 44.69 to the 45.99 to above so the primary bullish reversal will be started. If the price crosses support at 41.65 together with support level at 40.14 to below so the primary bearish trend will be resumed. Alternatively, the price will be on secondary ranging within the primary bearish trend to be near and below Ichimoku cloud waiting for direction of the strong trend to be started. Trading
0 

The PYPL doesn’t have other trading ideas at this time
Browse ready-made trading ideas or select a symbol and create your own
Go to Charts and Trading Ideas