usdjpy h4 analysis USDJPY US Dollar vs Yen
usdjpy h4 analysis
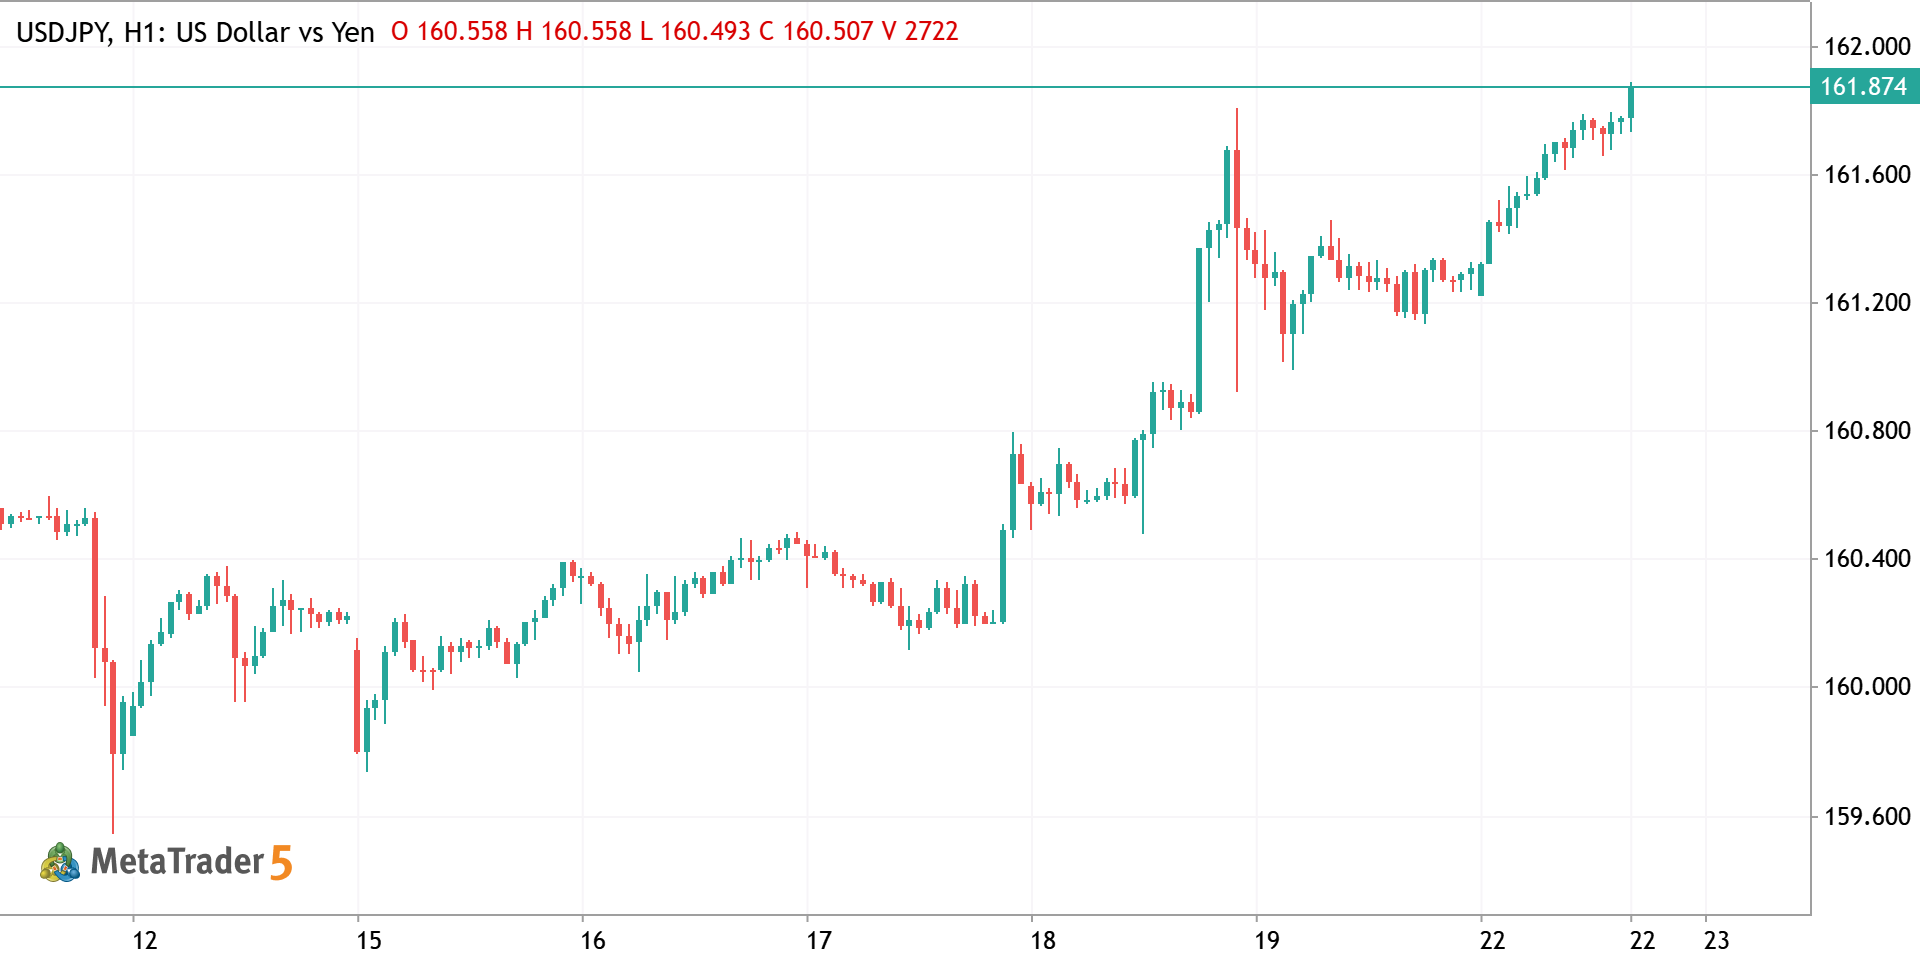
USDJPY H4 Analysis Price is respecting a descending channel and currently testing key resistance around 1593–1595. Rejection from this zone suggests bearish pressure remains intact. As long as price stays below the trendline, expect a downside move toward 1580 and potentially 1570. A clean breakout above 1595 would invalidate the bearish setup and open room for higher levels. Bias: Bearish below resistance Key Levels: 1595 resistance | 1580–1570 support
0
Goldanalysisteam Abdul Qayoom 2026.04.22 08:55
gbp jpy intraday smart analysis GBPJPY Pound Sterling vs Yen
gbp jpy intraday smart analysis
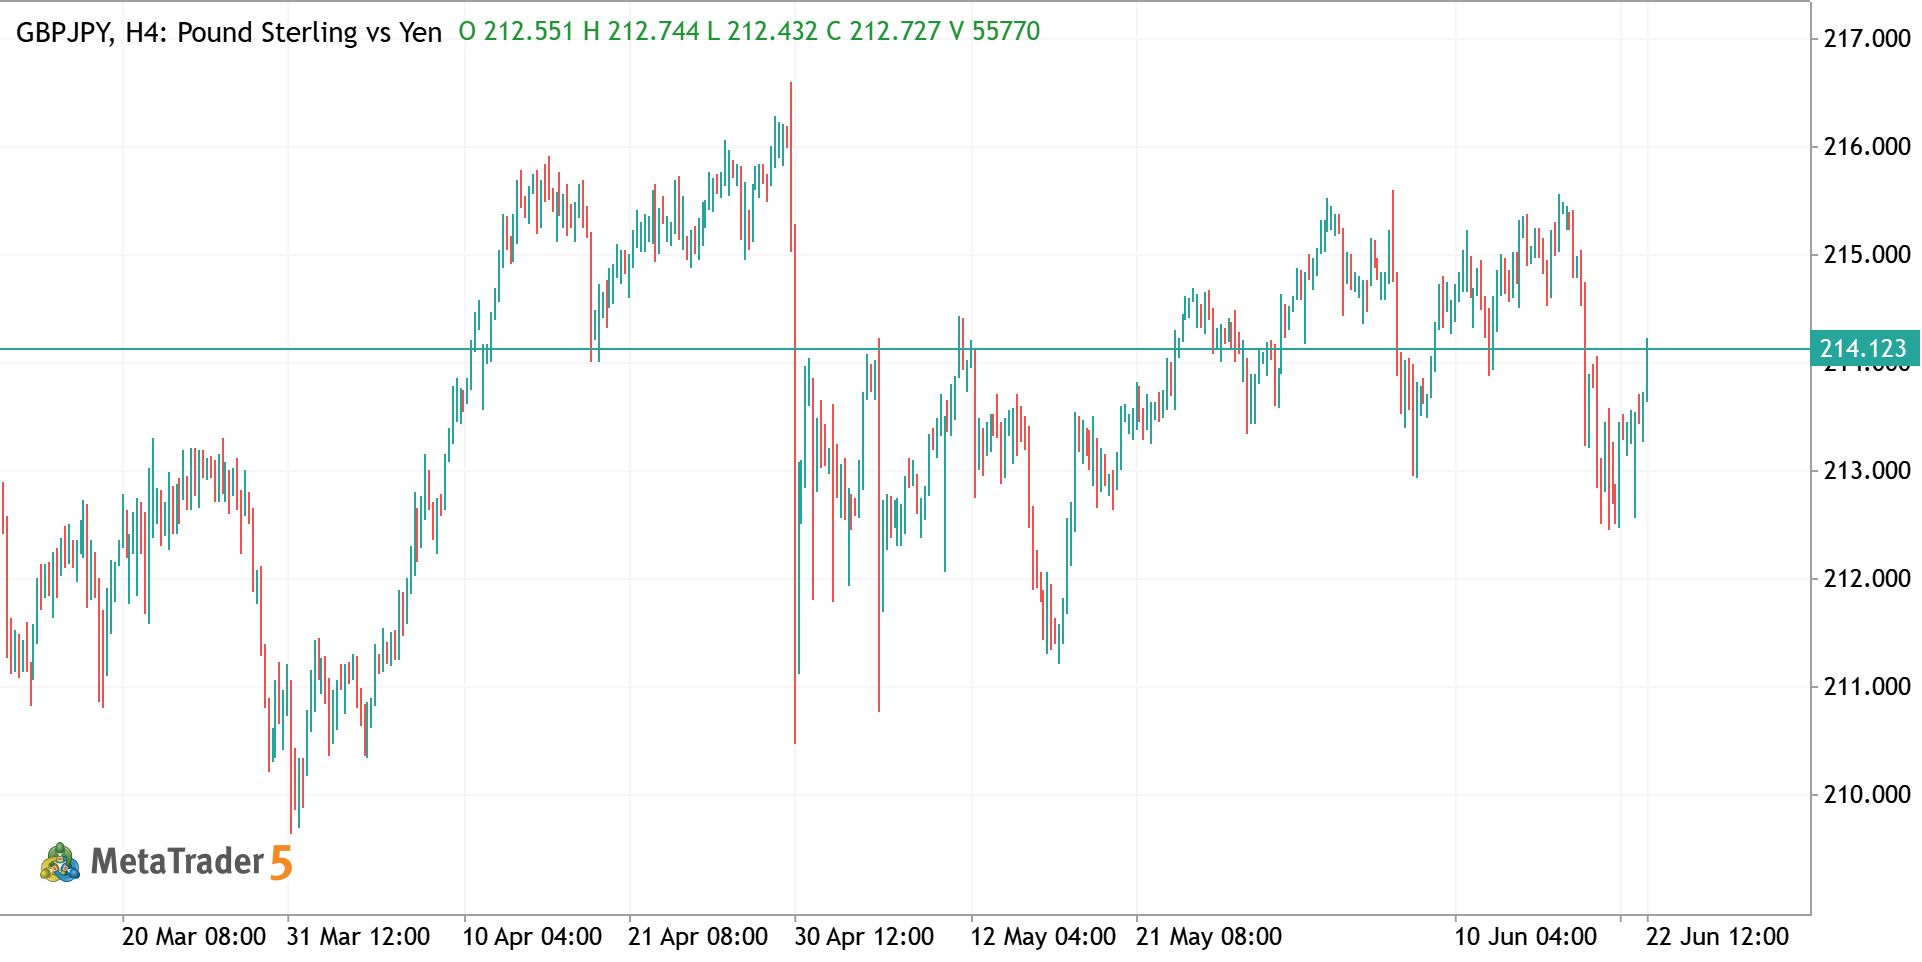
GBP JPY Intraday – Smart Analysis Price is moving inside a clear consolidation range after an impulsive move up. Multiple rejections from resistance show weakening bullish momentum. 🔹 Structure: Range-bound between support & resistance Liquidity building on both sides 🔻 Bearish Scenario: Break below range support → continuation toward lower demand zone Recent fake breakout suggests downside liquidity grab 🔸 Bullish Scenario: Clean breakout + hold above resistance → continuation of uptrend 📌 Conclusion: Currently in accumulation/distribution phase — wait for confirmed breakout. Short bias below support, bullish only on strong breakout and retest
0
Goldanalysisteam Abdul Qayoom 2026.04.21 09:30
USDJPY H4 ANALYSIS TRDE IDEA USDJPY US Dollar vs Yen
USDJPY H4 ANALYSIS TRDE IDEA
Hello Traders! What are vour thoughts on USDJPY? On the 4-hour chart. USD /JPY is exhibiting a well-defined bearish structure in the medium term. After several failed attempts to break and hold above the 160.000 psychologica resistance level, price action is now signaling a shift toward a bearish momentum. Key Technical Insights: Supply Zone: The red shaded area between 159.500 and 160.200 has proven to be a formidable barrier Multiple rejections in this zone indicate neavy institutional selling pressure Descendina Channel & Confluence: The pair is currentlv trading within a descending channel. Price has recently tapped the upper boundary of this channel, coinciding perfectly with the Fibonacci retracement . This technical confluence strenathens the bearish Given the current structure
2026.04.21 08:16 0