

NVDA
#1
NVIDIA Corporation - Common Stock
229.2 8 USD
-0.01%
Market Price
Sector: Technology
Base: USD
Profit Currency: USD
Daily Range
Year Range
Daily Change
-0.52%
Monthly Change
+8.62%
6 month change
+23.26%
Year Change
+21.98%
Previous Close
230.4 8
Open
233.8 8
Low
229.1 1
High
233.8 9
Financials
2017
Current report, Q4 FY2017
NVIDIA CORP current report, Q4 FY2017
8-K
Quarterly report, Q3 FY2018
NVIDIA CORP quarterly report, Q3 FY2018
10-Q
Current report, Q3 FY2017
NVIDIA CORP current report, Q3 FY2017
8-K
Quarterly report, Q2 FY2018
NVIDIA CORP quarterly report, Q2 FY2018
10-Q
Current report, Q2 FY2017
NVIDIA CORP current report, Q2 FY2017
8-K
Current report, Q2 FY2017
NVIDIA CORP current report, Q2 FY2017
8-K
Current report, Q2 FY2017
NVIDIA CORP current report, Q2 FY2017
8-K
Quarterly report, Q1 FY2018
NVIDIA CORP quarterly report, Q1 FY2018
10-Q
Current report, Q1 FY2017
NVIDIA CORP current report, Q1 FY2017
8-K
Current report, Q1 FY2017
NVIDIA CORP current report, Q1 FY2017
8-K
News
IREN Scores Major AI Cloud Deal With Anthropic: Report
Ray Dalio Says the AI Bubble Is Close to Bursting. A Strategist Says Zombie Companies Are the Real Risk
Dividend Harvesting Portfolio Week 293: $29,300 Allocated $3,401.43 In Projected Dividends
Zacks Investment Ideas feature highlights: Meta Platform, NVIDIA, Palantir, Cisco, SanDisk and Qualcomm
Zacks Investment Ideas feature highlights: Qualcomm, Alphabet, Tesla, AMD, Amazon, Taiwan Semiconductor, NVIDIA, Intel, Apple, Broadcom and SpaceX
Zacks Investment Ideas feature highlights: Micron, NVIDIA and Hewlett Packard Enterprise
Forget Chip Shortages: Intel, Broadcom CEOs Warn AI's Next Big Crisis Could Be Cash
Palantir CTO Blasts Silicon Valley’s ‘Doomsday Cult’ Over AI Safety — Says Pentagon Has 'Already Replaced' Anthropic
Bernie Sanders Slams Trump Over AI ‘Hoax’ Claims as He Questions Billions in Family Wealth Tied to Crypto and AI Investments
Guide to Magnificent Seven ETF investing
‘The prospectus looks impressive’: My financial adviser wants me to invest $350,000 in a UAE data center. Is this risky?
Charts & Ideas
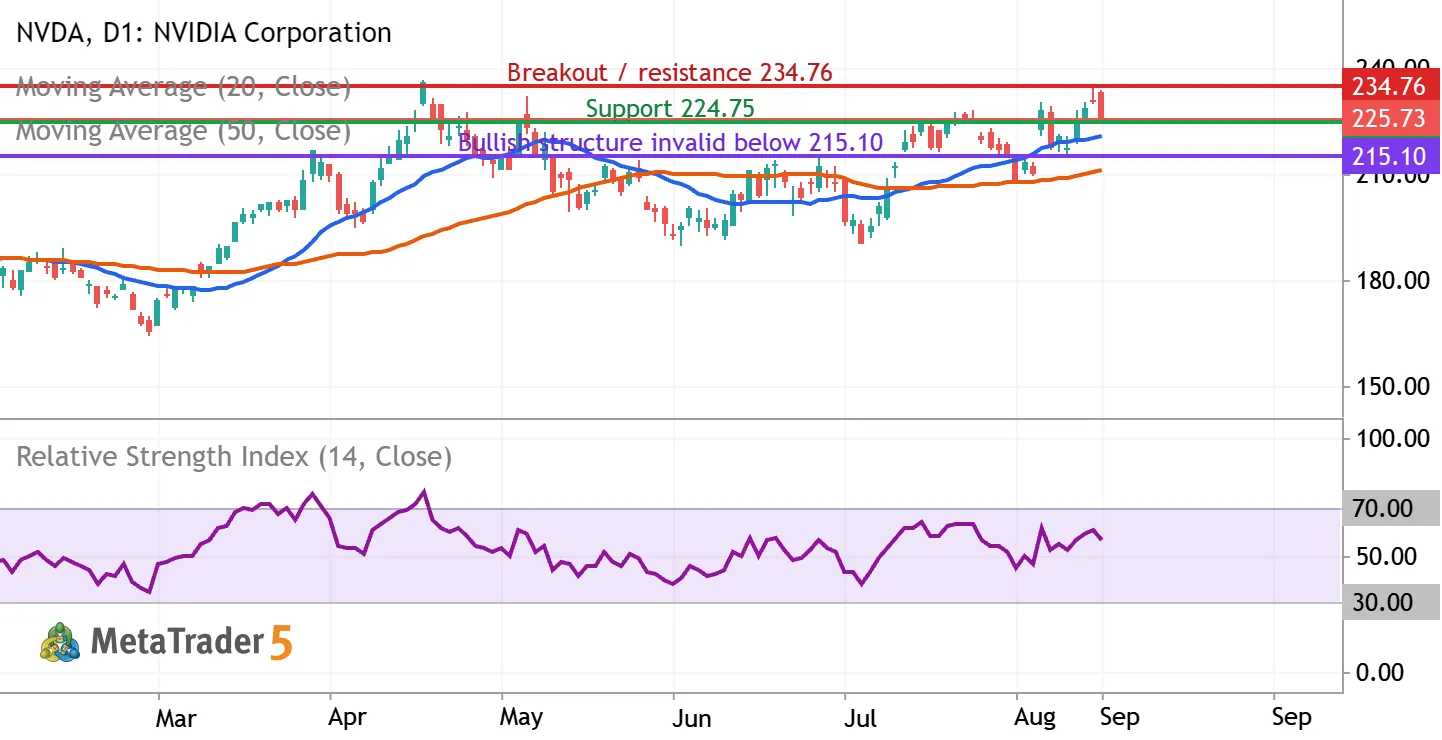
NVDA: testing $225 support as the uptrend meets $234.76 resistance
NVIDIA (NASDAQ: NVDA) | Daily chart | September 9, 2026 Bias: conditionally bullish over the next 2–6 weeks. Entry confirmation is still required. The latest completed regular session, September 8, closed at $225.73, down 2.01%, after reaching $233.71 intraday. The close near the session low signals selling pressure despite the broader recovery. What the indicators show The chart includes a blue 20-day simple moving average, an orange 50-day simple moving average, and purple RSI(14), all calculated from closing prices. At the latest completed candle, MetaTrader showed the averages near $220.48 and $211.22, with RSI near 56.19. Price remains above both rising averages, and the 20-day average is above the 50-day average. RSI above 50 supports positive momentum, but its reading below 70 is


The NVDA doesn’t have other trading ideas at this time
Browse ready-made trading ideas or select a symbol and create your own
Go to Charts and Trading Ideas