

NVDA
#1
NVIDIA Corporation - Common Stock
226.4 7 USD
-0.01%
Market Price
Sector: Technology
Base: USD
Profit Currency: USD
Daily Range
Year Range
Daily Change
-1.23%
Monthly Change
+7.29%
6 month change
+21.74%
Year Change
+20.48%
Previous Close
229.2 8
Open
228.7 3
Low
224.9 2
High
228.8 6
Financials
2015
Current report, Q1 FY2015
NVIDIA CORP current report, Q1 FY2015
8-K
Annual report, FY2015
NVIDIA CORP annual report, FY2015
10-K
2014
Current report, Q4 FY2014
NVIDIA CORP current report, Q4 FY2014
8-K
Quarterly report, Q3 FY2015
NVIDIA CORP quarterly report, Q3 FY2015
10-Q
Current report, Q3 FY2014
NVIDIA CORP current report, Q3 FY2014
8-K
Quarterly report, Q2 FY2015
NVIDIA CORP quarterly report, Q2 FY2015
10-Q
Current report, Q2 FY2014
NVIDIA CORP current report, Q2 FY2014
8-K
Current report, Q2 FY2014
NVIDIA CORP current report, Q2 FY2014
8-K
Current report, Q2 FY2014
NVIDIA CORP current report, Q2 FY2014
8-K
Quarterly report, Q1 FY2015
NVIDIA CORP quarterly report, Q1 FY2015
10-Q
News
Navitas Semiconductor Announces 24 Kilowatts, 800 Volts To 12 12 V DC-DC GaNFast-Powered Power Delivery Board Developed In Partnership With Nvidia
S&P 500 Dominated by AI Stocks, Adding SpaceX Would Create History Last Seen in 1880s
This Private AI Chip Startup Has Crushed NVIDIA's Stock Gains With 3.6X Returns
'Trump Administration Plans to Move AI Testing Agency Officials to White House; The White House Seeks To Integrate Caissi Into AI Decision-making Process' - The Information
Why Is Oracle Stock Falling on Monday?
TSMC Q3 Preview: The Road To $3 Trillion Is Hiding In Plain Sight (NYSE:TSM)
Broadcom CEO Says Many AI Investors Have ‘No Clue,’ Likens Boom to a Casino
Michael Burry's Big Short Gets Broader: Nvidia-Heavy Chip ETF, Nasdaq Now in Focus
Why Is Super Micro Computer Stock Falling on Monday?
HPE Partners With NVDA: Can it Help Challenge SMCI & DELL?
NVIDIA and Cisco Unveil New Pluggable Optical Module Form Factor to Scale AI Factories
Charts & Ideas
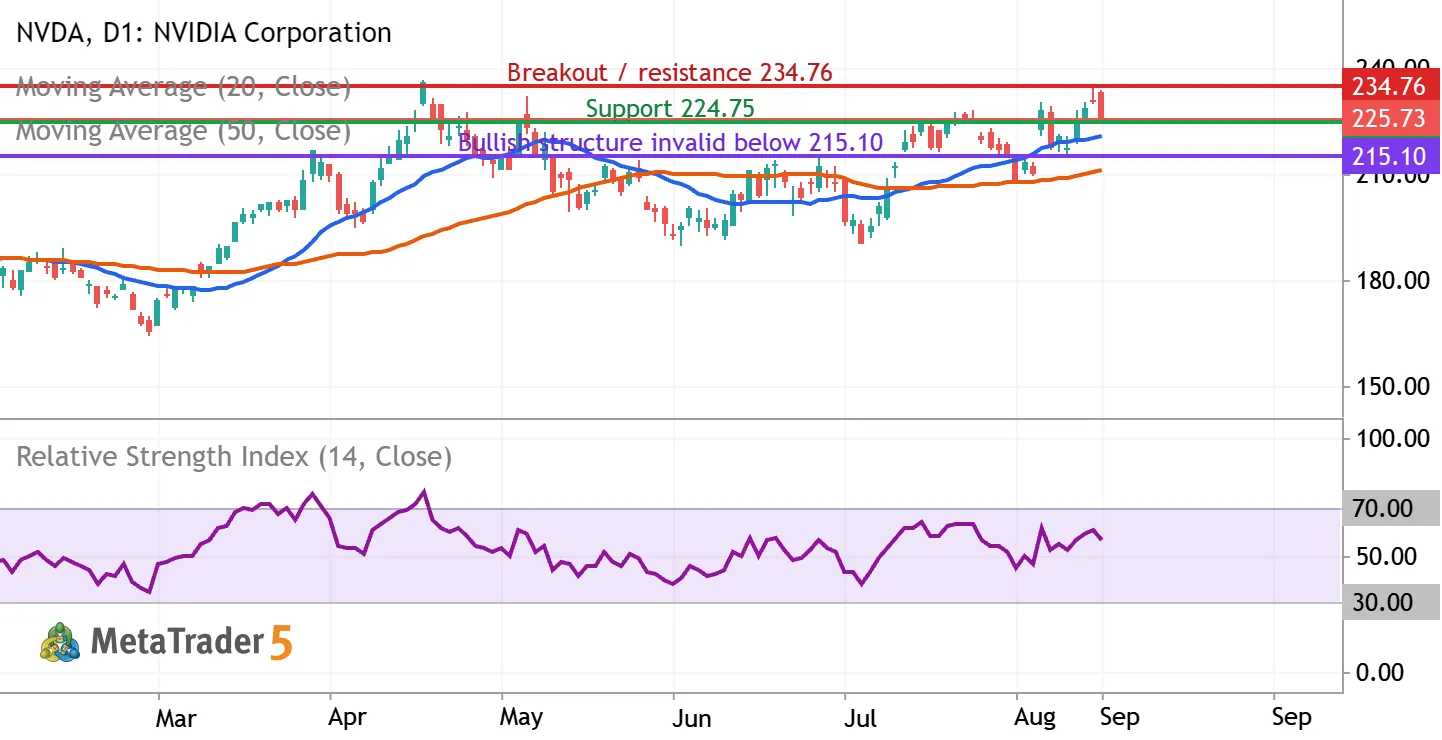
NVDA: testing $225 support as the uptrend meets $234.76 resistance
NVIDIA (NASDAQ: NVDA) | Daily chart | September 9, 2026 Bias: conditionally bullish over the next 2–6 weeks. Entry confirmation is still required. The latest completed regular session, September 8, closed at $225.73, down 2.01%, after reaching $233.71 intraday. The close near the session low signals selling pressure despite the broader recovery. What the indicators show The chart includes a blue 20-day simple moving average, an orange 50-day simple moving average, and purple RSI(14), all calculated from closing prices. At the latest completed candle, MetaTrader showed the averages near $220.48 and $211.22, with RSI near 56.19. Price remains above both rising averages, and the 20-day average is above the 50-day average. RSI above 50 supports positive momentum, but its reading below 70 is


The NVDA doesn’t have other trading ideas at this time
Browse ready-made trading ideas or select a symbol and create your own
Go to Charts and Trading Ideas