

NVDA
#1
NVIDIA Corporation - Common Stock
226.5 3 USD
-0.01%
Market Price
Sector: Technology
Base: USD
Profit Currency: USD
Daily Range
Year Range
Daily Change
-1.20%
Monthly Change
+7.32%
6 month change
+21.78%
Year Change
+20.51%
Previous Close
229.2 8
Open
228.7 3
Low
224.9 2
High
228.8 6
Financials
2002
Current report, Q3 FY2002
NVIDIA CORP current report, Q3 FY2002
8-K
Quarterly report, Q3 FY2002
NVIDIA CORP quarterly report, Q3 FY2002
10-Q
Current report, Q2 FY2002
NVIDIA CORP current report, Q2 FY2002
8-K
Current report, Q2 FY2002
NVIDIA CORP current report, Q2 FY2002
8-K
Quarterly report, Q2 FY2002
NVIDIA CORP quarterly report, Q2 FY2002
10-Q
Current report, Q2 FY2002
NVIDIA CORP current report, Q2 FY2002
8-K
Annual report, Q1 FY2002
NVIDIA CORP annual report, Q1 FY2002
10-K
2001
Quarterly report, Q4 FY2001
NVIDIA CORP quarterly report, Q4 FY2001
10-Q
Quarterly report, Q3 FY2001
NVIDIA CORP quarterly report, Q3 FY2001
10-Q
Quarterly report, Q2 FY2001
NVIDIA CORP quarterly report, Q2 FY2001
10-Q
News
TSMC Q3 Preview: The Road To $3 Trillion Is Hiding In Plain Sight (NYSE:TSM)
Broadcom CEO Says Many AI Investors Have ‘No Clue,’ Likens Boom to a Casino
Michael Burry's Big Short Gets Broader: Nvidia-Heavy Chip ETF, Nasdaq Now in Focus
Why Is Super Micro Computer Stock Falling on Monday?
HPE Partners With NVDA: Can it Help Challenge SMCI & DELL?
NVIDIA and Cisco Unveil New Pluggable Optical Module Form Factor to Scale AI Factories
9 Of 11 Sectors Rise Monday As Cyclicals Lead
AMD’s $8.2 Billion World Labs Deal Could Strengthen Its AI Growth Story
NVIDIA And Cisco Unveil USFP Optical Module Technology Supporting 400Gb/s-per-Lane Connectivity For Next-Generation AI Factories
Q3 Earnings Season Begins: Global Week Ahead
Steve Eisman Warns S&P 500 Is One Giant AI Bet: 'I Own NVDA and I Worry'
Charts & Ideas
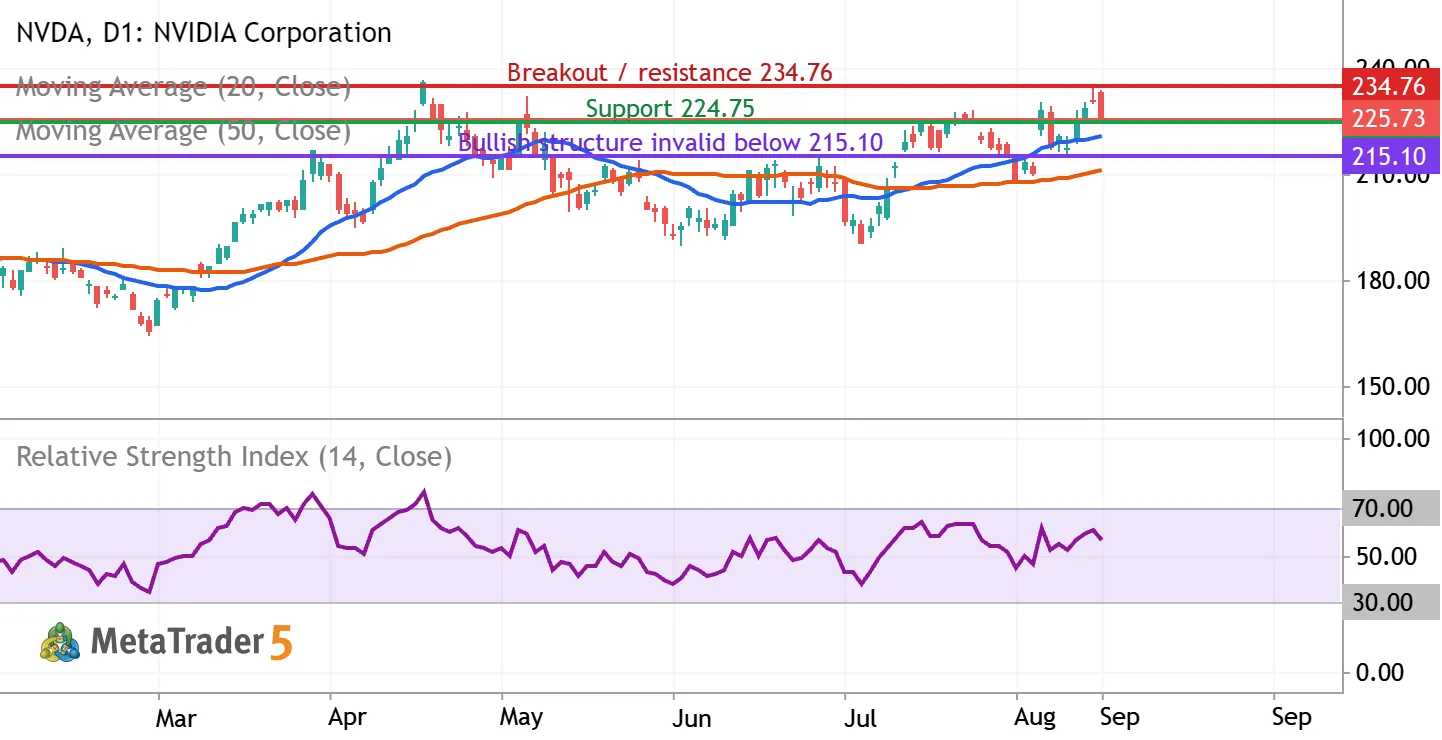
NVDA: testing $225 support as the uptrend meets $234.76 resistance
NVIDIA (NASDAQ: NVDA) | Daily chart | September 9, 2026 Bias: conditionally bullish over the next 2–6 weeks. Entry confirmation is still required. The latest completed regular session, September 8, closed at $225.73, down 2.01%, after reaching $233.71 intraday. The close near the session low signals selling pressure despite the broader recovery. What the indicators show The chart includes a blue 20-day simple moving average, an orange 50-day simple moving average, and purple RSI(14), all calculated from closing prices. At the latest completed candle, MetaTrader showed the averages near $220.48 and $211.22, with RSI near 56.19. Price remains above both rising averages, and the 20-day average is above the 50-day average. RSI above 50 supports positive momentum, but its reading below 70 is


The NVDA doesn’t have other trading ideas at this time
Browse ready-made trading ideas or select a symbol and create your own
Go to Charts and Trading Ideas