PYPL - Daily Rally to the Possible Bullish Reversal PYPL PayPal Holdings, Inc. - Common Stock
PYPL - Daily Rally to the Possible Bullish Reversal
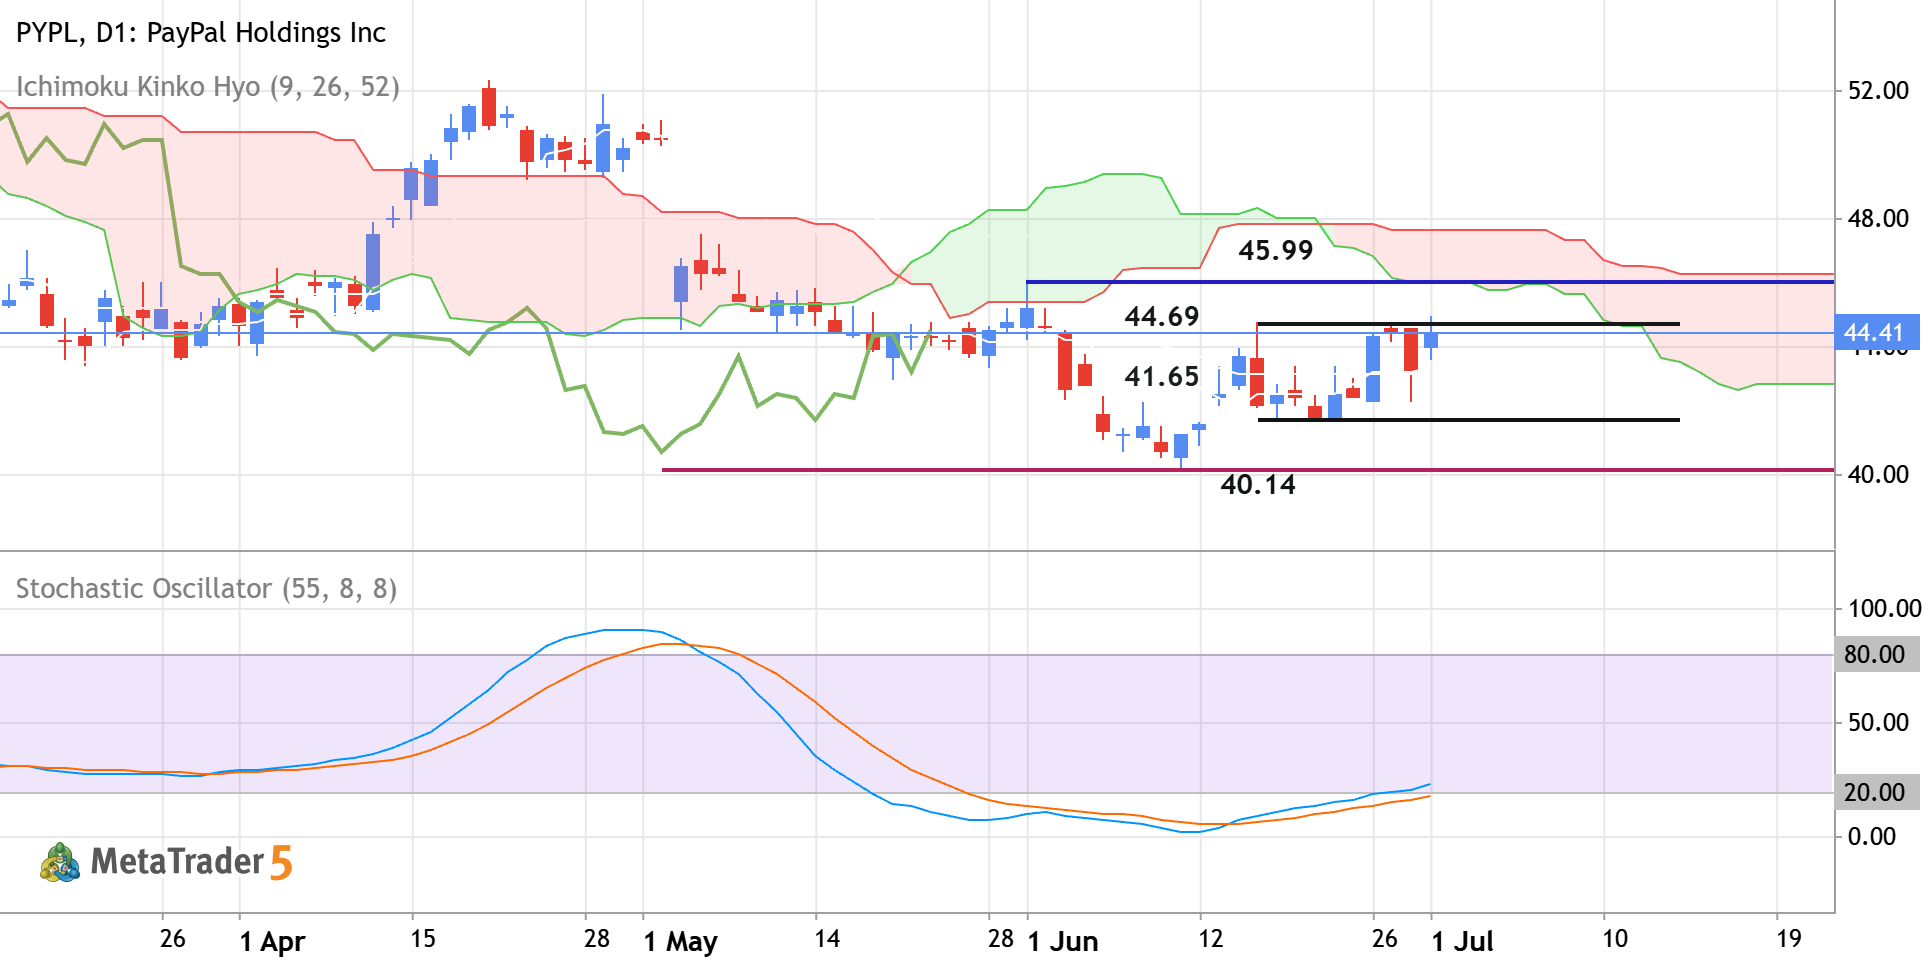
Daily price is located near and below Ichimoku cloud in the bearish area of the chart. The price was blinced from resistance levels at 40.14 and 41.65 to above for the bear market rally to be started. The Stochastic oscillator is showing the possible uptrend in the near future, and Chinkou Span line is crossing historical price but on open daily bar for now. If the price breaks the resistance level at 44.69 to the 45.99 to above so the primary bullish reversal will be started. If the price crosses support at 41.65 together with support level at 40.14 to below so the primary bearish trend will be resumed. Alternatively, the price will be on secondary ranging within the primary bearish trend to be near and below Ichimoku cloud waiting for direction of the strong trend to be started. Trading
0

newdigital Sergey Golubev 2026.07.01 18:06
GBPUSD TRADE IDEA GBPUSD Long Pound Sterling vs US Dollar
GBPUSD TRADE IDEA
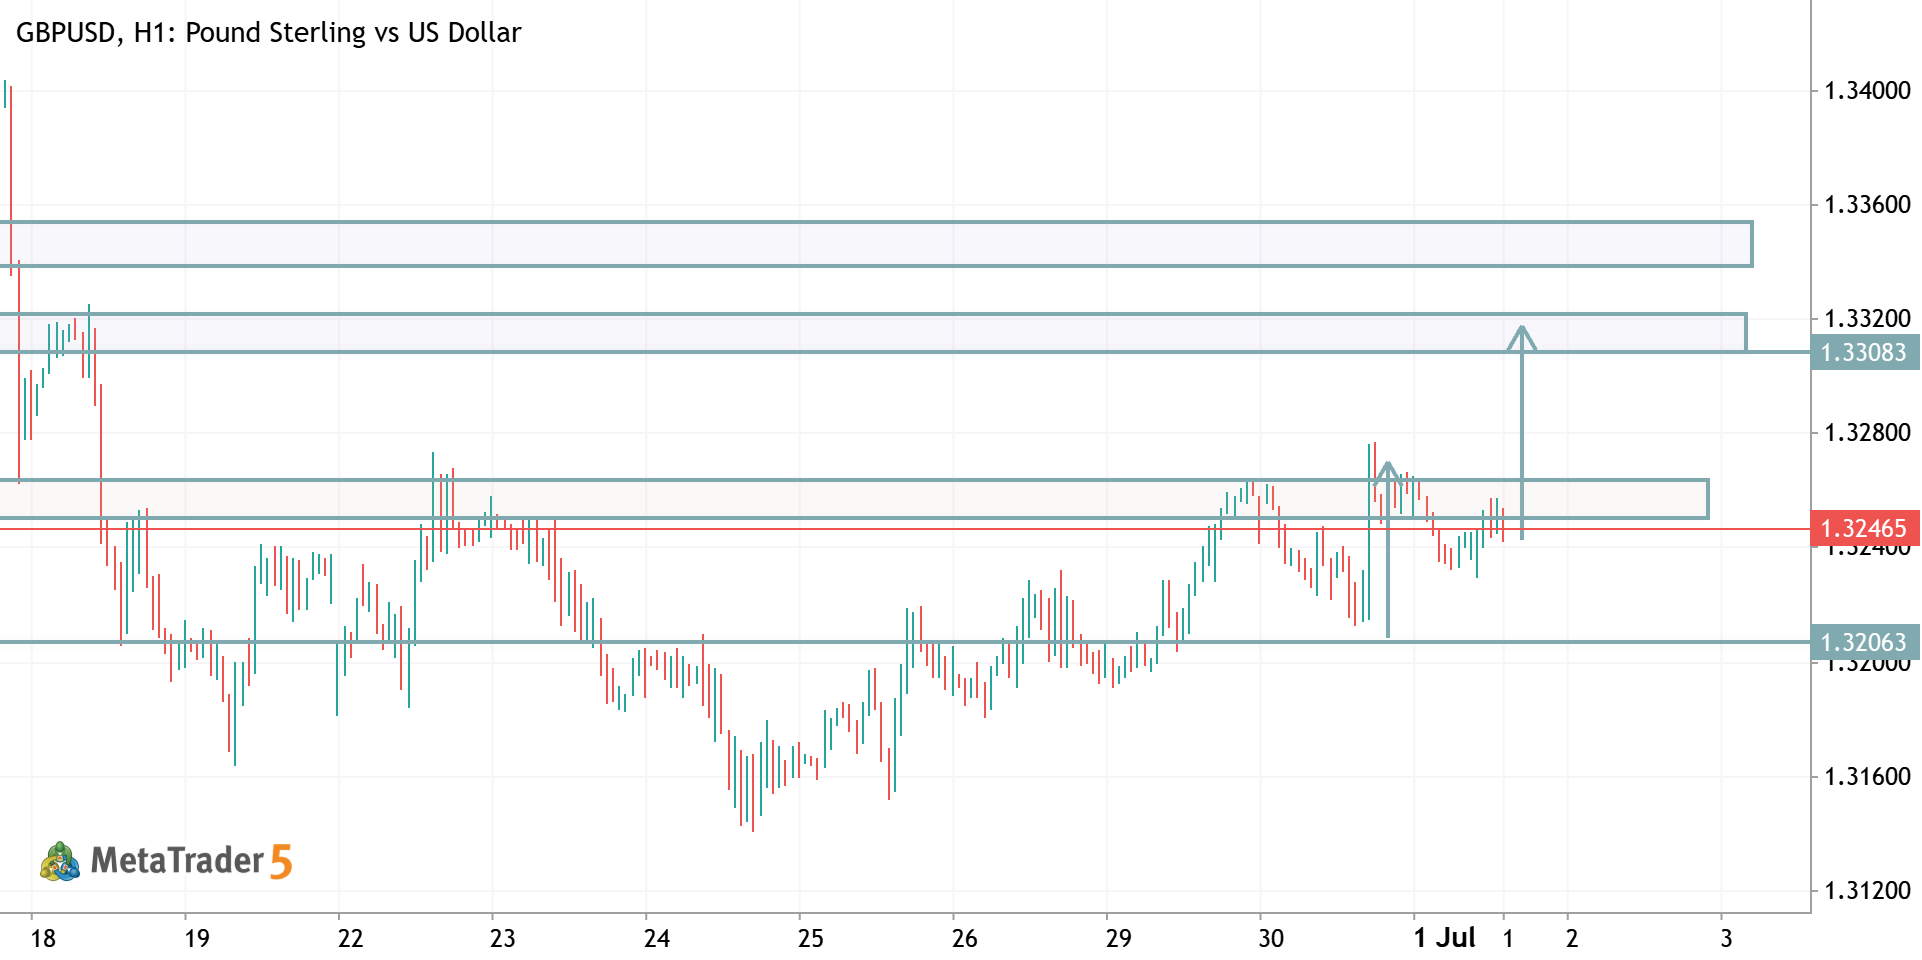
GBPUSD (H1) – Short Trade Setup Based on your chart, a short is reasonable if price rejects the resistance zone around 1.3250–1.3268 . Entry: Sell: 1.3250–1.3265 (after bearish confirmation) Stop Loss: 1.3275–1.3280 (above the recent swing high) Take Profit: TP1: 1.3206 TP2: 1.3160 TP3: 1.3135 (if bearish momentum accelerates) Trade Reason Price is testing a key resistance/supply zone . The overall trend remains bearish despite the recent recovery. A rejection from resistance offers a favorable risk-to-reward setup. Bias: Bearish (Short) , but wait for a bearish rejection candle or a break below the most recent H1 higher low before entering.
1
HamadJatoi Hamad Jatoi 2026.07.01 11:54
btcusd h1 analysis BTCUSD Bitcoin vs US Dollar
btcusd h1 analysis
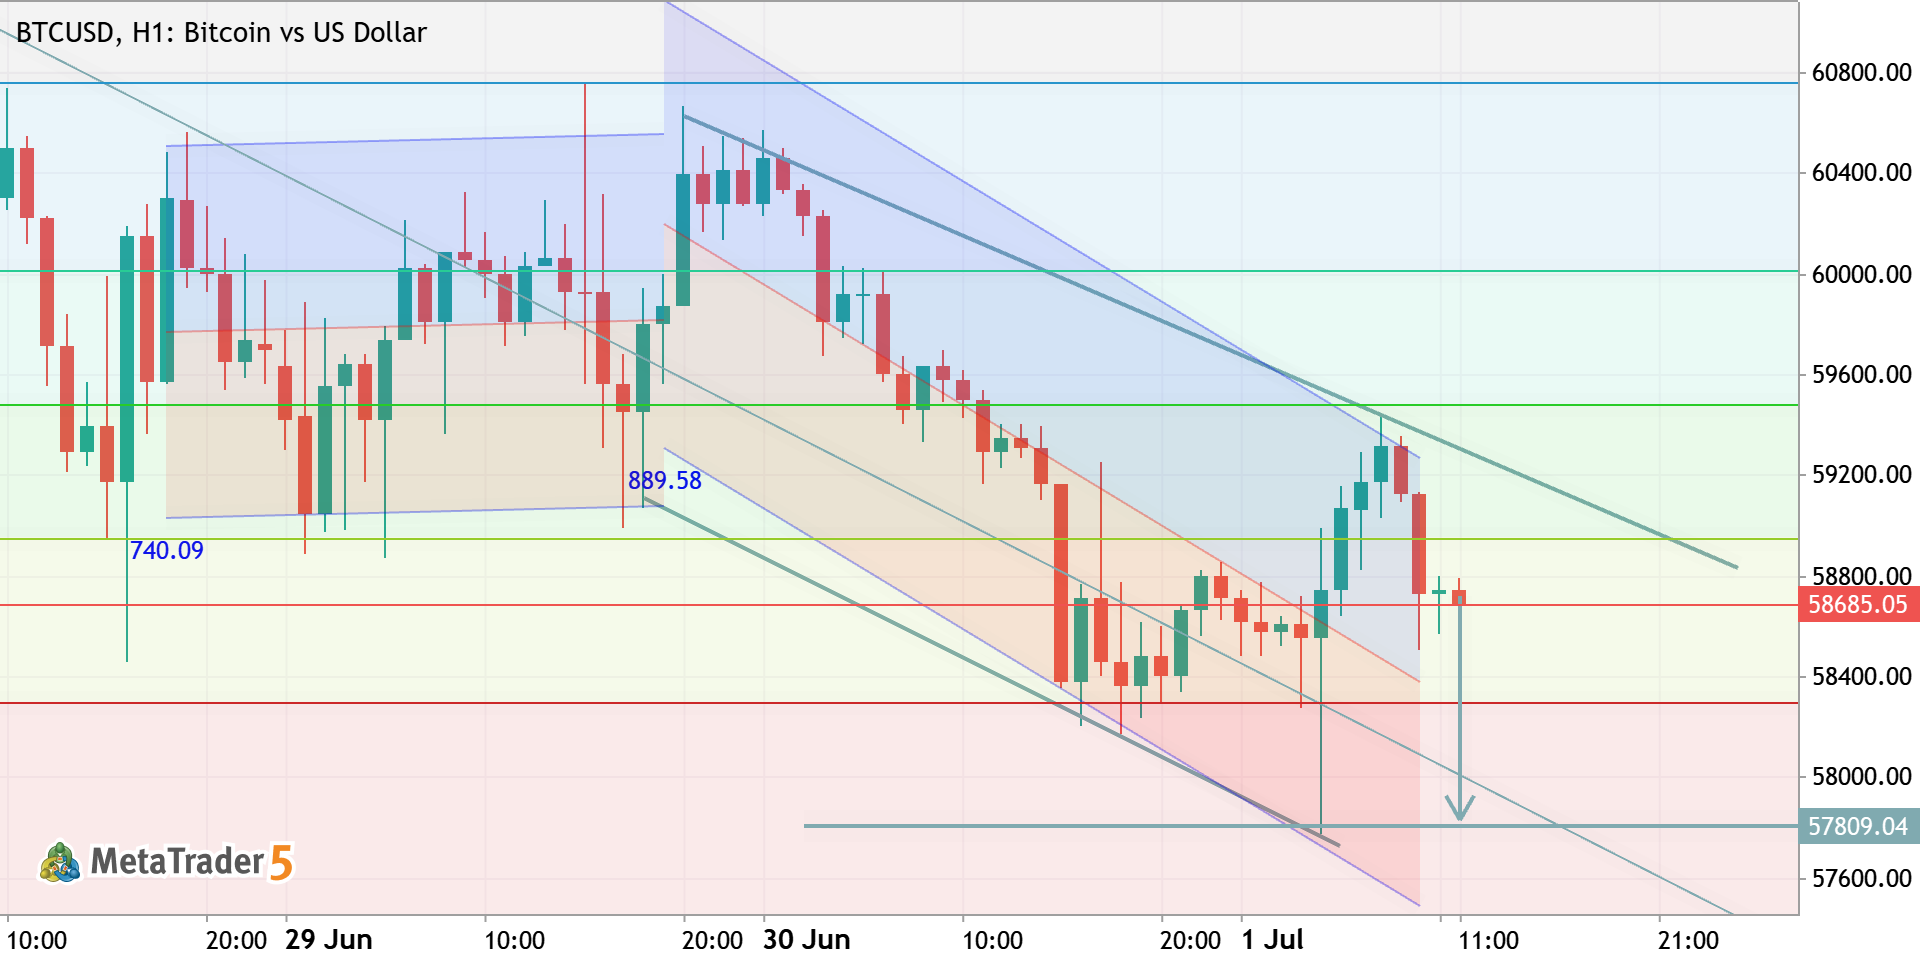
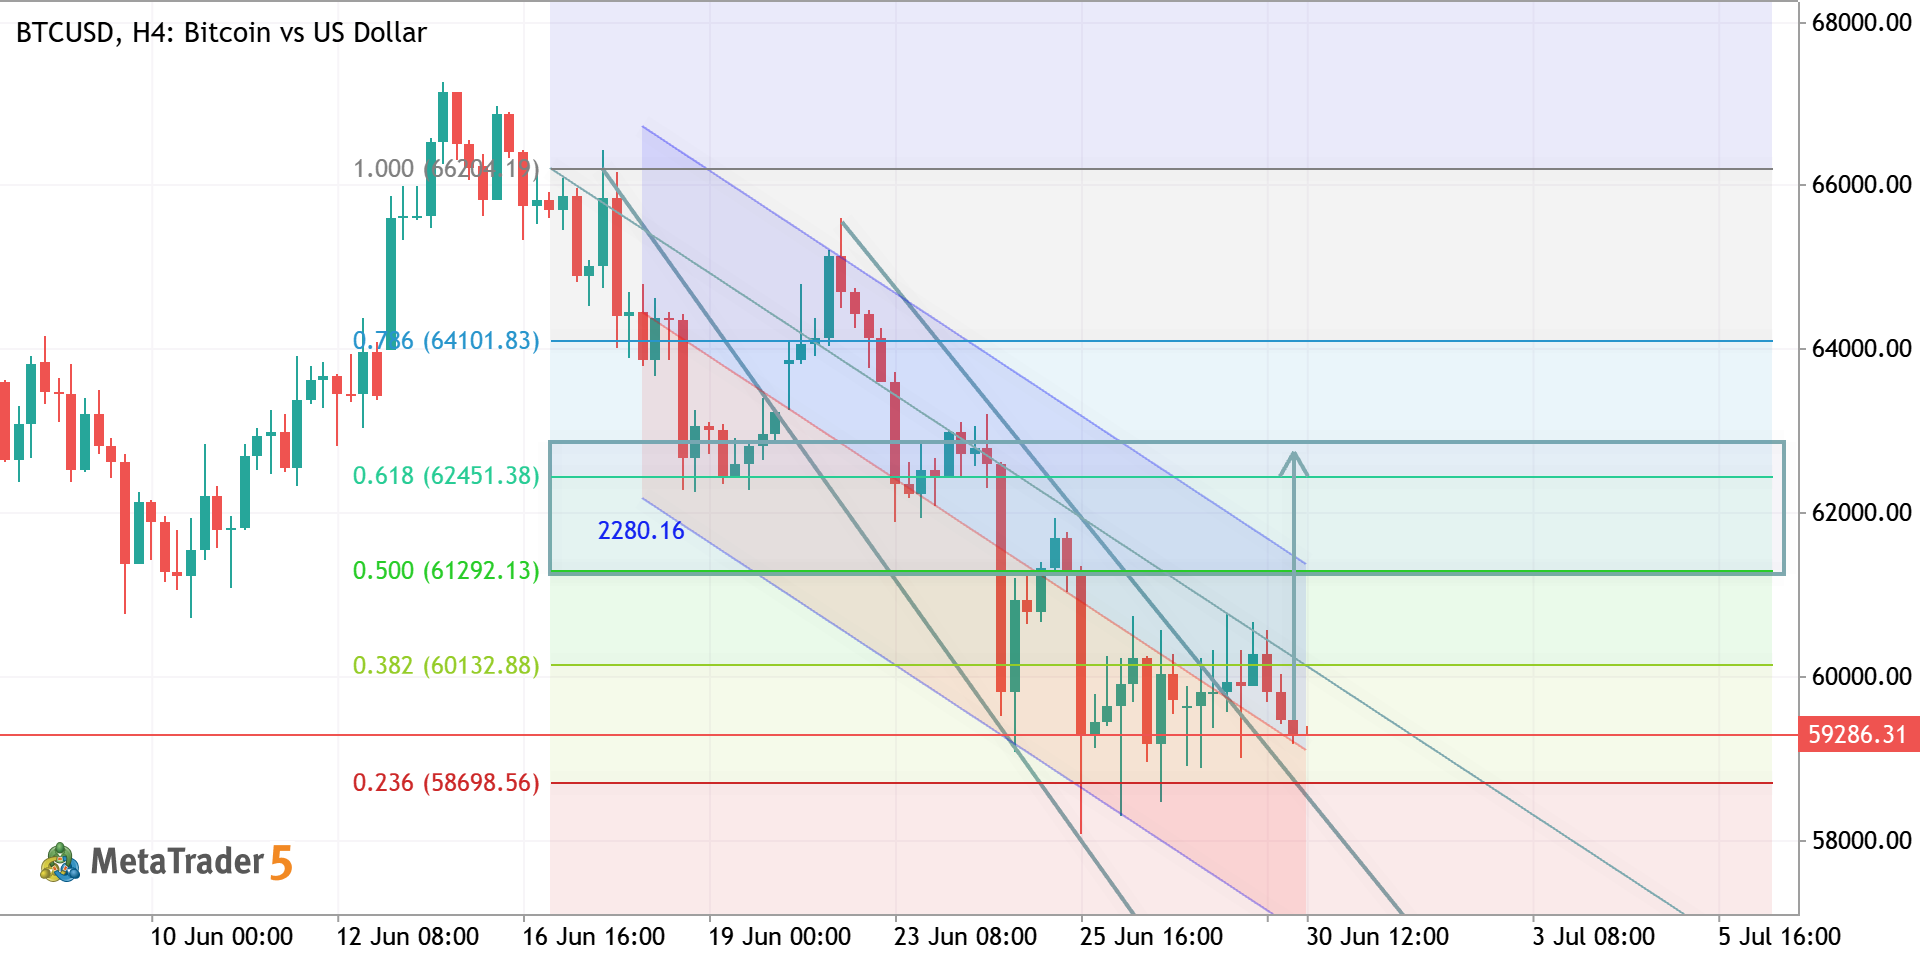
BTCUSD | H1 Analysis Price remains under bearish trendline resistance, keeping sellers in control. A rejection from the resistance zone suggests another move toward lower support if bulls fail to reclaim the trendline. Watch for a breakout above resistance before considering a bullish shift. Bias: Bearish 📉 Key Levels: Resistance: 59,300–59,500 | Support: 58,100–57,800 Trade Safe – Wait for Confirmation.
0
Goldanalysisteam Abdul Qayoom 2026.07.01 08:14
BTCUSD TRADE IDEA BTCUSD Long Bitcoin vs US Dollar
BTCUSD TRADE IDEA
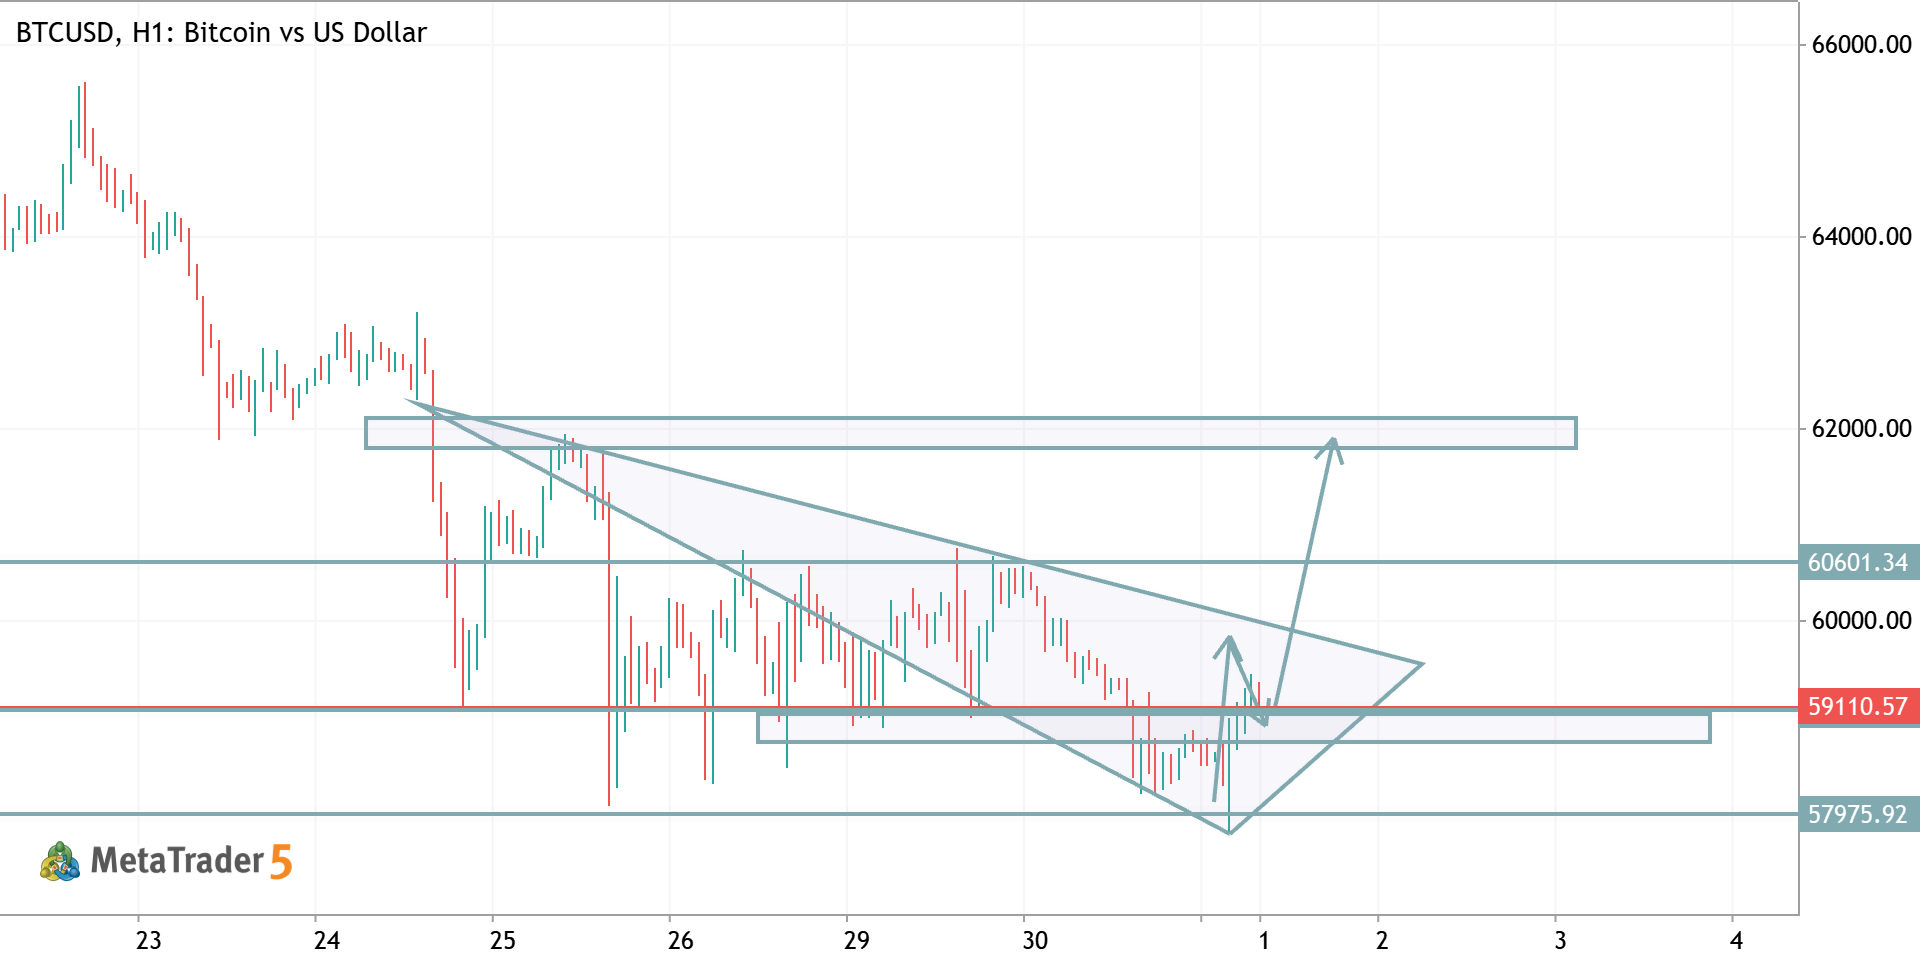
BTCUSD (H1) Trade Analysis – Bullish Bias Market Structure Price is trading inside a descending wedge , a pattern that often precedes a bullish breakout. Buyers have defended the 58,000–58,800 support area several times. Short-term momentum remains weak until the wedge resistance is broken. Buy Setup Entry Zone: 58,500–59,000 (after bullish confirmation) Stop Loss: Below 57,950 Take Profit 1: 60,300–60,600 Take Profit 2: 61,800–62,100 Take Profit 3: 63,500–64,000 (if bullish momentum continues) Alternative Scenario If BTC closes below 57,950 , the bullish setup is invalidated. A breakdown could lead to a move toward 57,000 and potentially 56,000 . Trading Plan Wait for a strong bullish rejection from support or a break and close above the wedge resistance before entering. Avoid buying in
0
HamadJatoi Hamad Jatoi 2026.07.01 05:58
EURUSD TRADE IDEA EURUSD Long Euro vs US Dollar
EURUSD TRADE IDEA
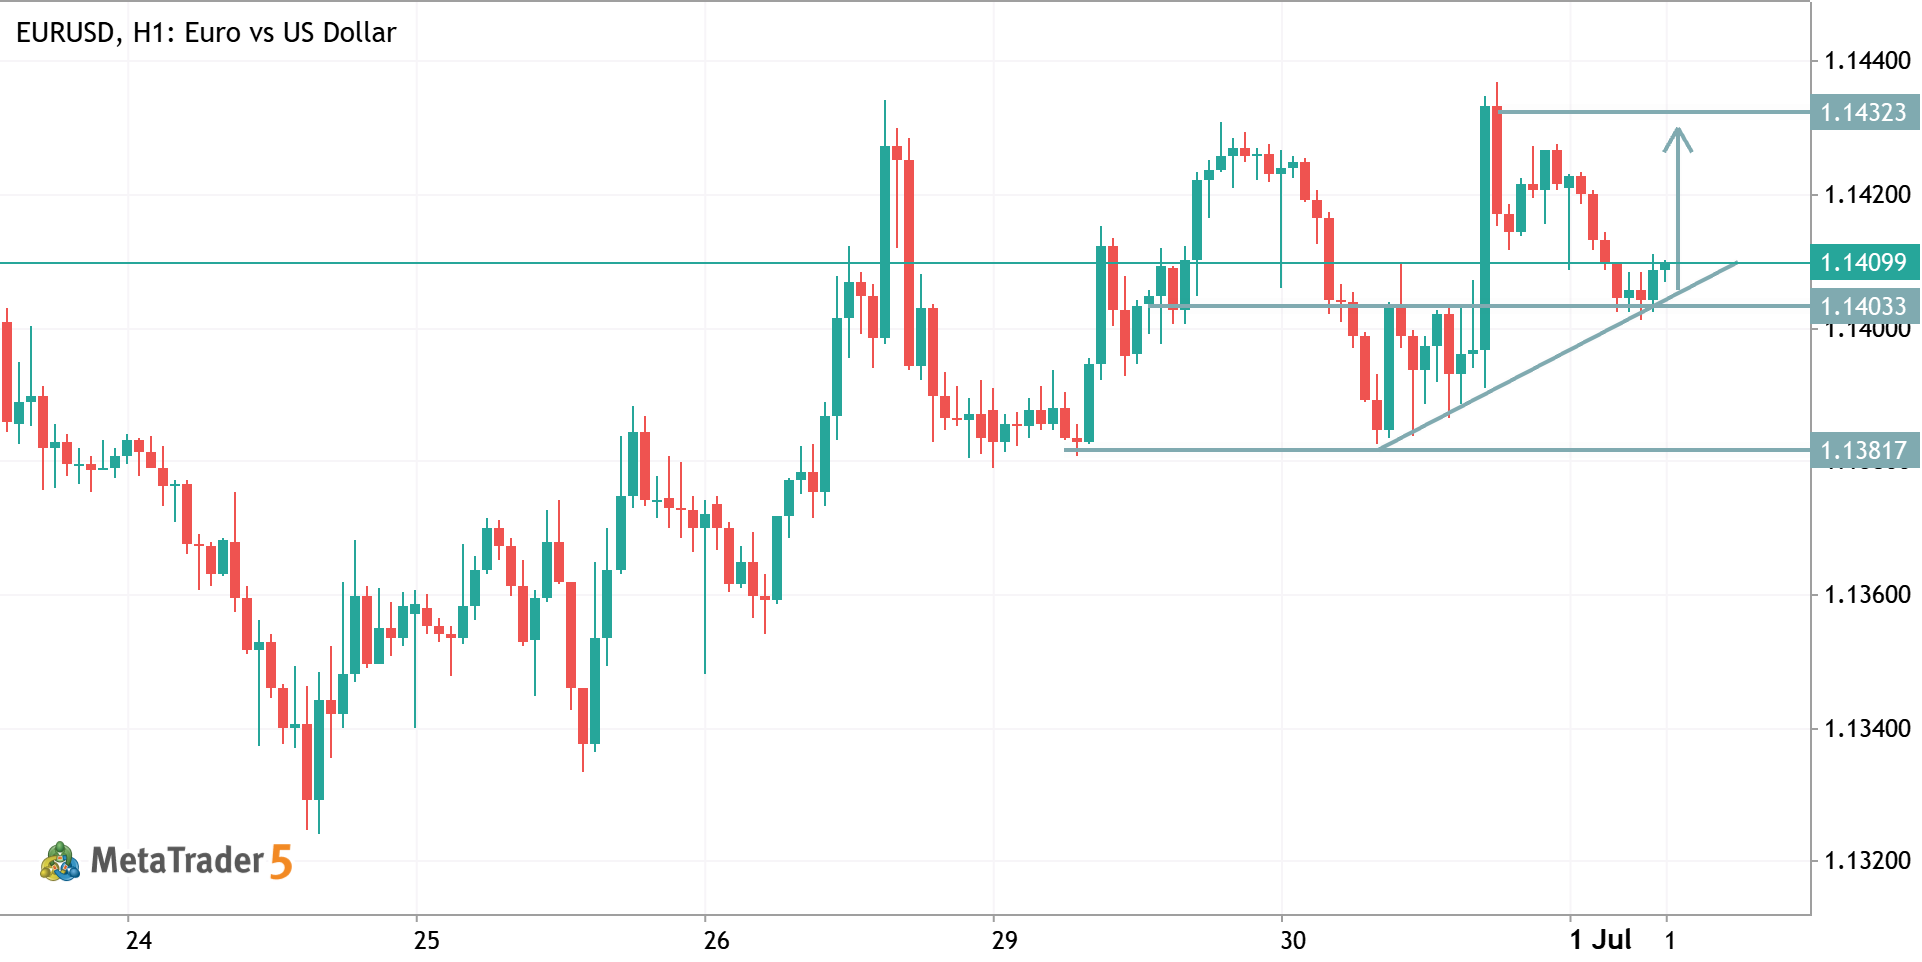
EURUSD – H1 Trade Analysis Based on the chart, EURUSD is showing a bullish bias after respecting an ascending trendline and holding above key support. Market Structure Trend: Short-term bullish. Price has formed higher lows , supported by the rising trendline. Buyers defended the 1.1403–1.1405 support zone multiple times. Key Levels Support: 1.1403 Immediate Resistance: 1.1410 Major Resistance / Target: 1.1432 Trade Idea (Buy) Entry: 1.1404–1.1410 (after a bullish rejection or candle close above resistance) Stop Loss: Below 1.1398 (or below the ascending trendline) Take Profit 1: 1.1423 Take Profit 2: 1.1432 Invalidation If price closes below 1.1403 and breaks the ascending trendline with strong bearish momentum, the bullish setup is invalidated and a move toward 1.1382 becomes more
0
HamadJatoi Hamad Jatoi 2026.07.01 05:38
XAUUSD TRADE IDEA XAUUSD Short Gold vs US Dollar
XAUUSD TRADE IDEA
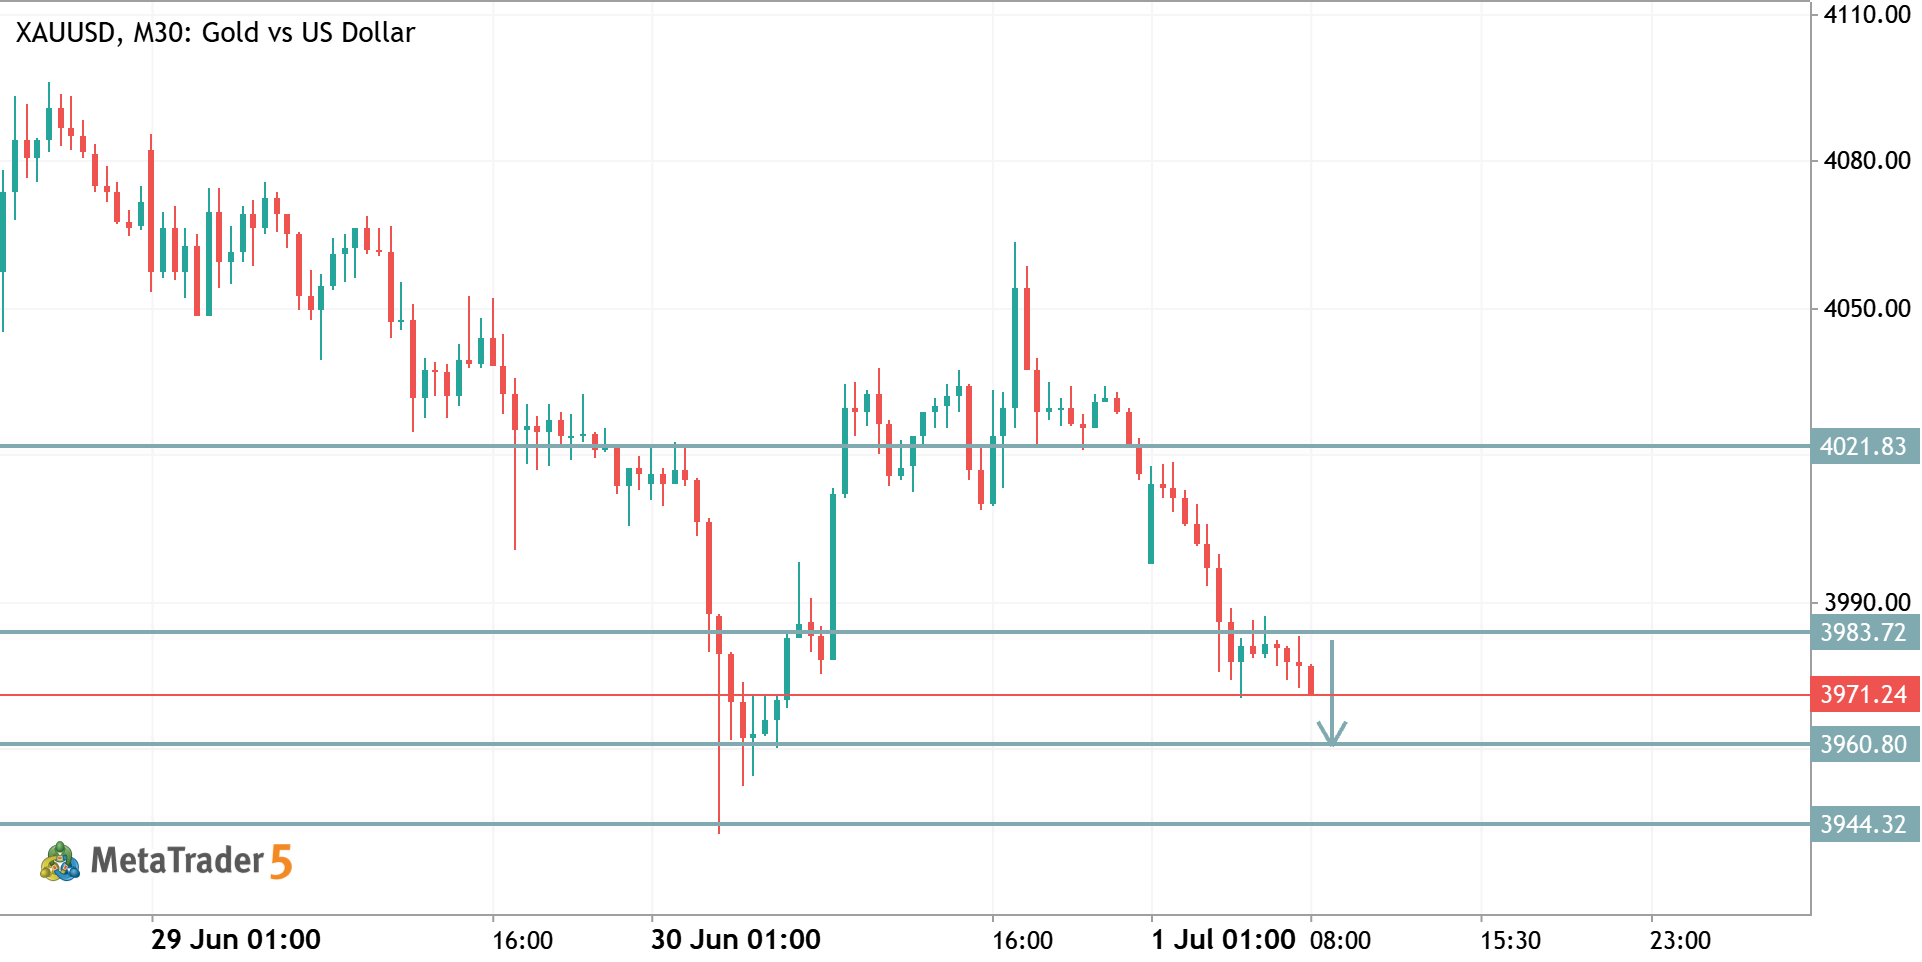
XAUUSD (Gold) – M30 Trade Analysis From the chart, the market structure is bearish . Bearish Bias Price has formed lower highs and lower lows , confirming a short-term downtrend. The 3971.35 level (red line) has been broken and is acting as resistance. Sellers remain in control while price stays below 3983.72 . Key Levels Resistance: 3971.35 → 3983.72 Major Resistance: 4021.83 Support: 3960.80 Next Support: 3944.32 Trade Idea Sell Entry: Conservative: Wait for a pullback to 3971–3983 and look for bearish rejection. Aggressive: Sell on a confirmed break below 3960.80 . Targets: TP1: 3960.80 TP2: 3944.32 Stop Loss: Above 3983.72 , or above the most recent swing high. Outlook Momentum currently favors the downside. Unless buyers reclaim 3983.72 , the probability remains higher for a
0
HamadJatoi Hamad Jatoi 2026.07.01 05:17
XAUUSD M15 Analysis. XAUUSD Gold vs US Dollar
XAUUSD M15 Analysis.
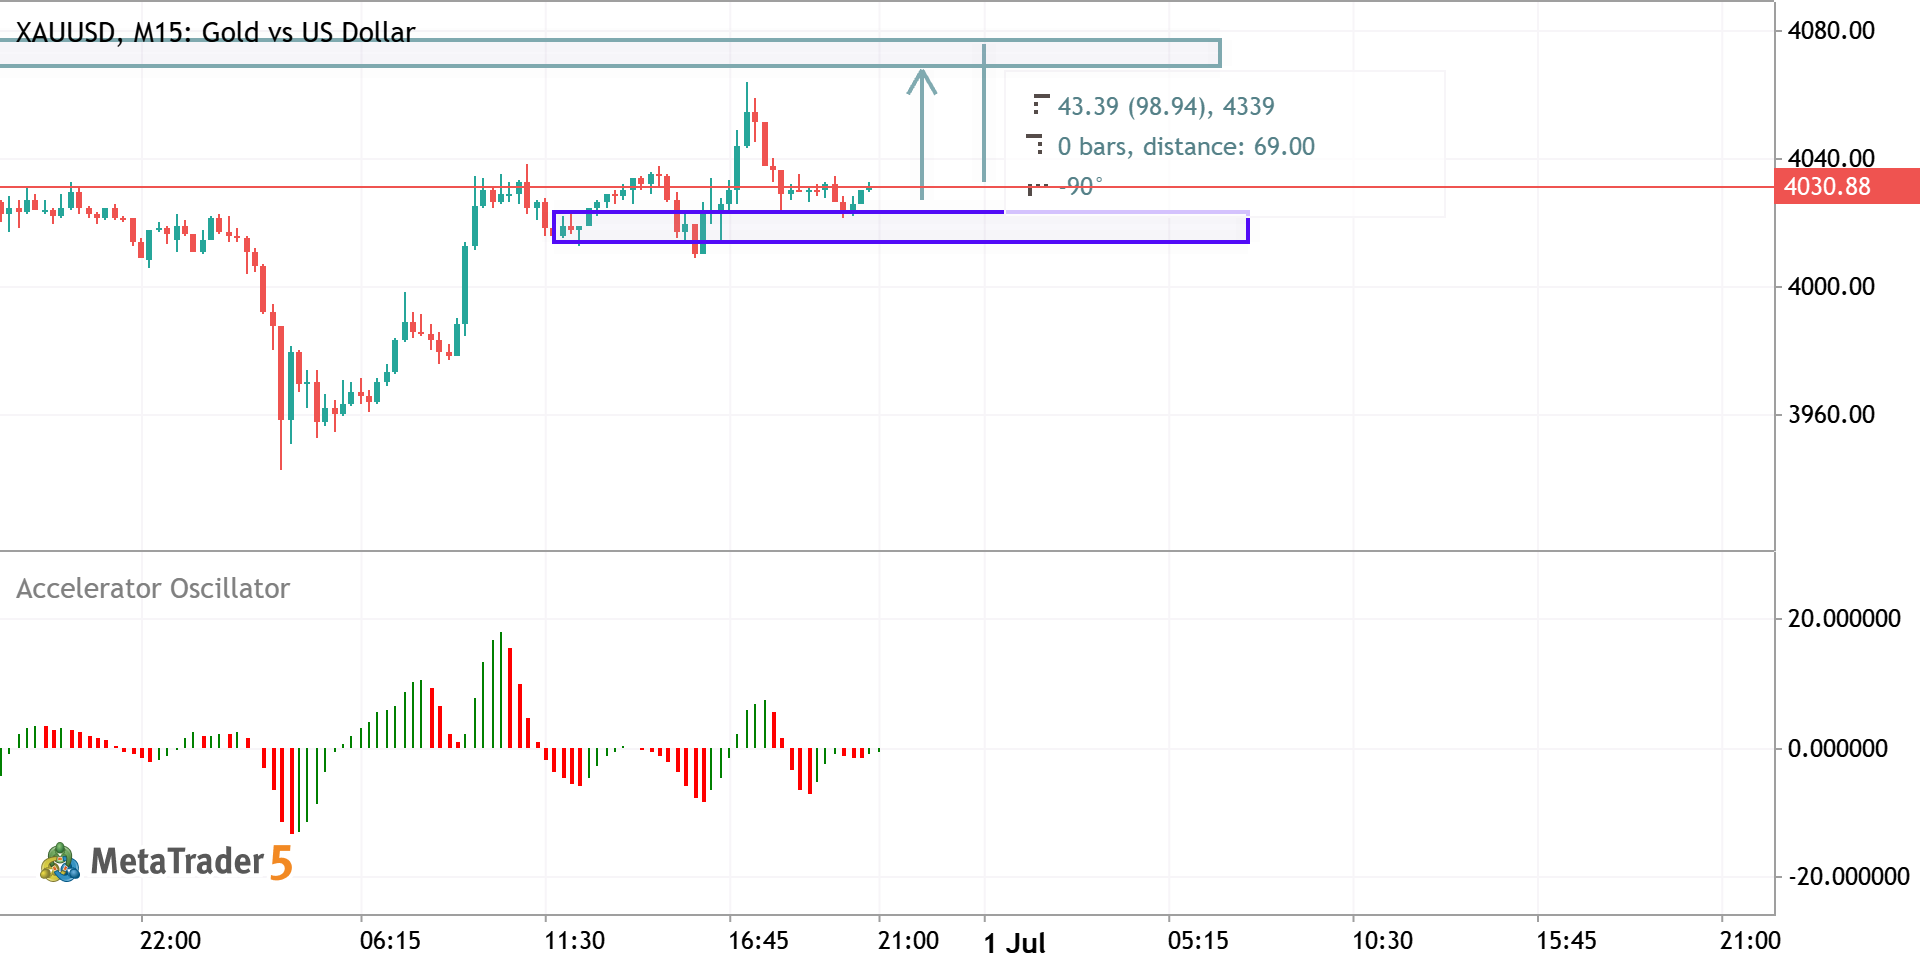
Gold is currently holding above a key demand zone around 4015–4023 , where buyers have repeatedly defended price. The recent rejection from this area suggests bullish momentum remains intact as long as support continues to hold. Price is now consolidating just below the 4030 resistance. A successful breakout and close above this level could trigger the next leg higher toward 4065 , with an extended target near 4075–4078 , matching the previous swing high. Bullish Scenario Entry: Buy on a pullback into 4018–4023 or after a confirmed breakout above 4030 . Targets: TP1: 4048–4055 TP2: 4065 TP3: 4075–4078 Invalidation: A 15-minute candle closing below 4015 would weaken the bullish outlook and increase the risk of a move toward 4005 or lower. Key Levels Support: 4015–4023 (Demand Zone)
0
Mr_Analysis_Pro Mr Sagar Kalwar 2026.06.30 18:01
XAUUSD H4 ANALYSIS XAUUSD Gold vs US Dollar
XAUUSD H4 ANALYSIS
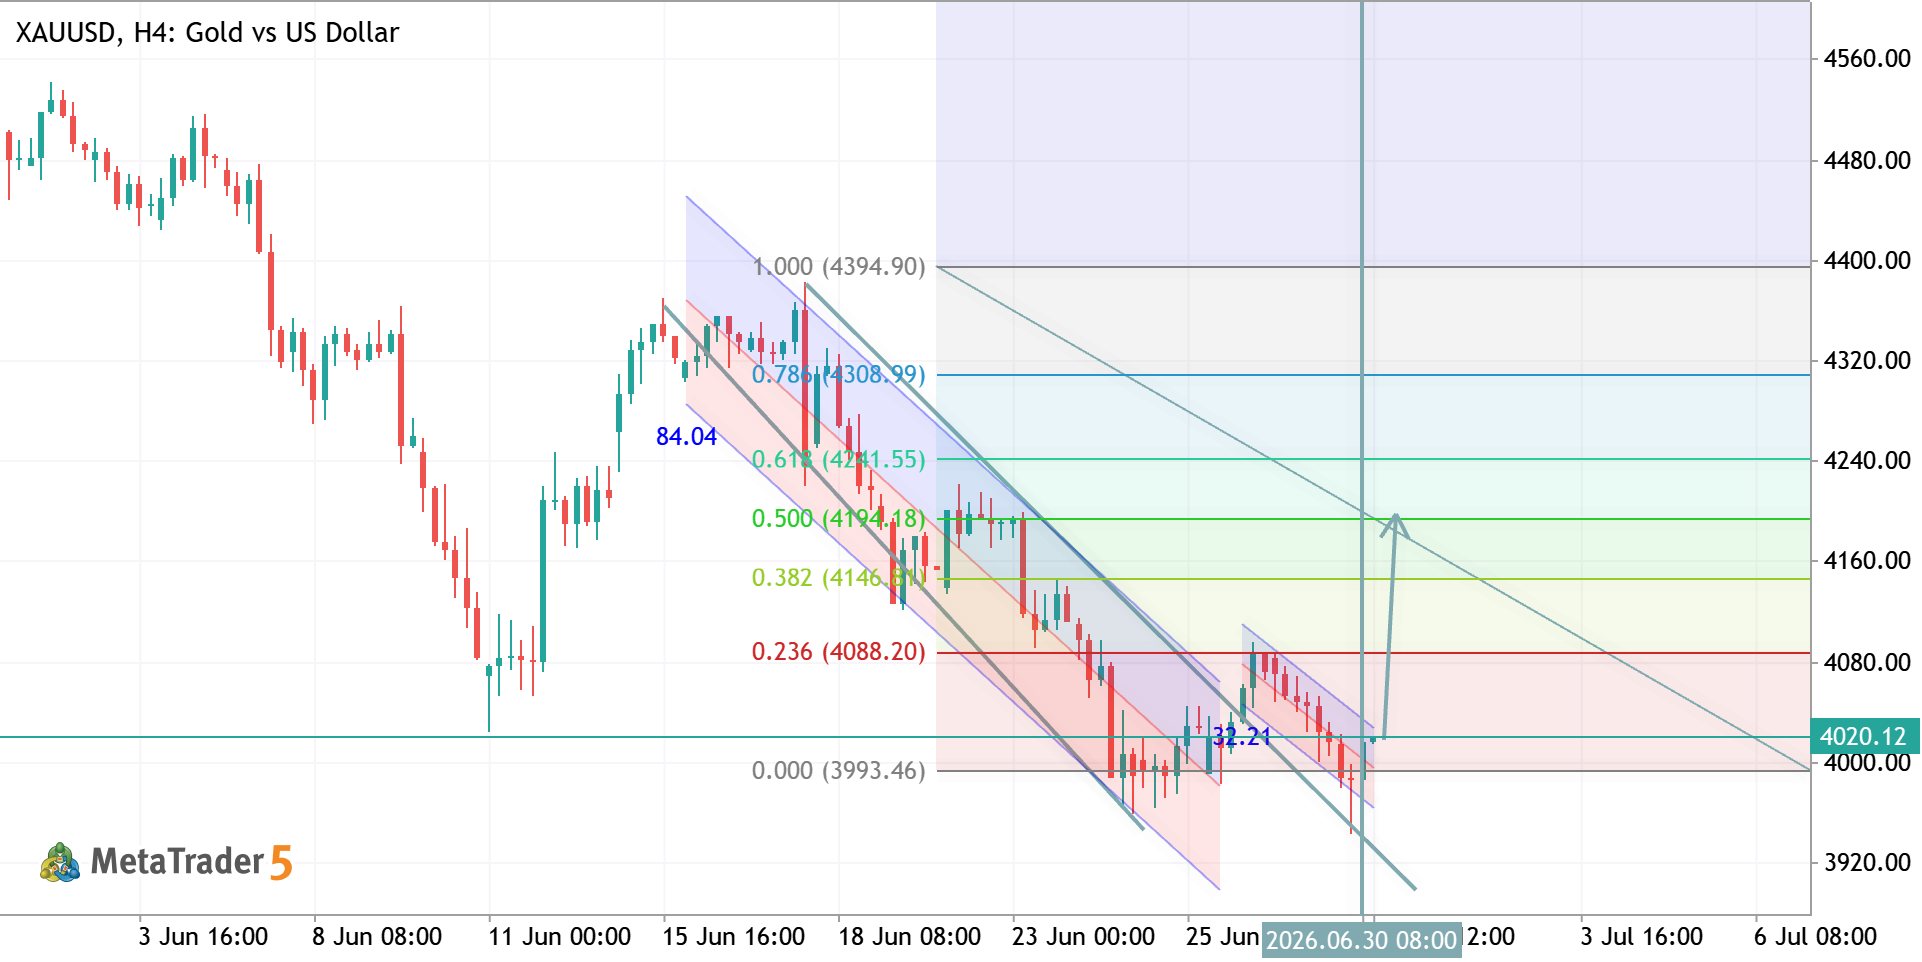
XAUUSD H4 Analysis Gold remains inside a falling channel, but price is approaching a key support zone where buying pressure is increasing. A breakout from the channel could signal a trend reversal. 📈 Bullish Scenario: A confirmed breakout above channel resistance may drive price toward 4200, with 4300 as the next upside target. 📉 Bearish Scenario: If the channel holds, sellers could push price back to retest the recent lows before any meaningful recovery. Bias: Cautiously Bullish. Waiting for breakout confirmation before targeting higher levels. #XAUUSD #Gold #Forex #TechnicalAnalysis #MQL5 #PriceAction
0
Goldanalysisteam Abdul Qayoom 2026.06.30 09:11
XAUUSD TRADE IDEA XAUUSD Long Gold vs US Dollar
XAUUSD TRADE IDEA
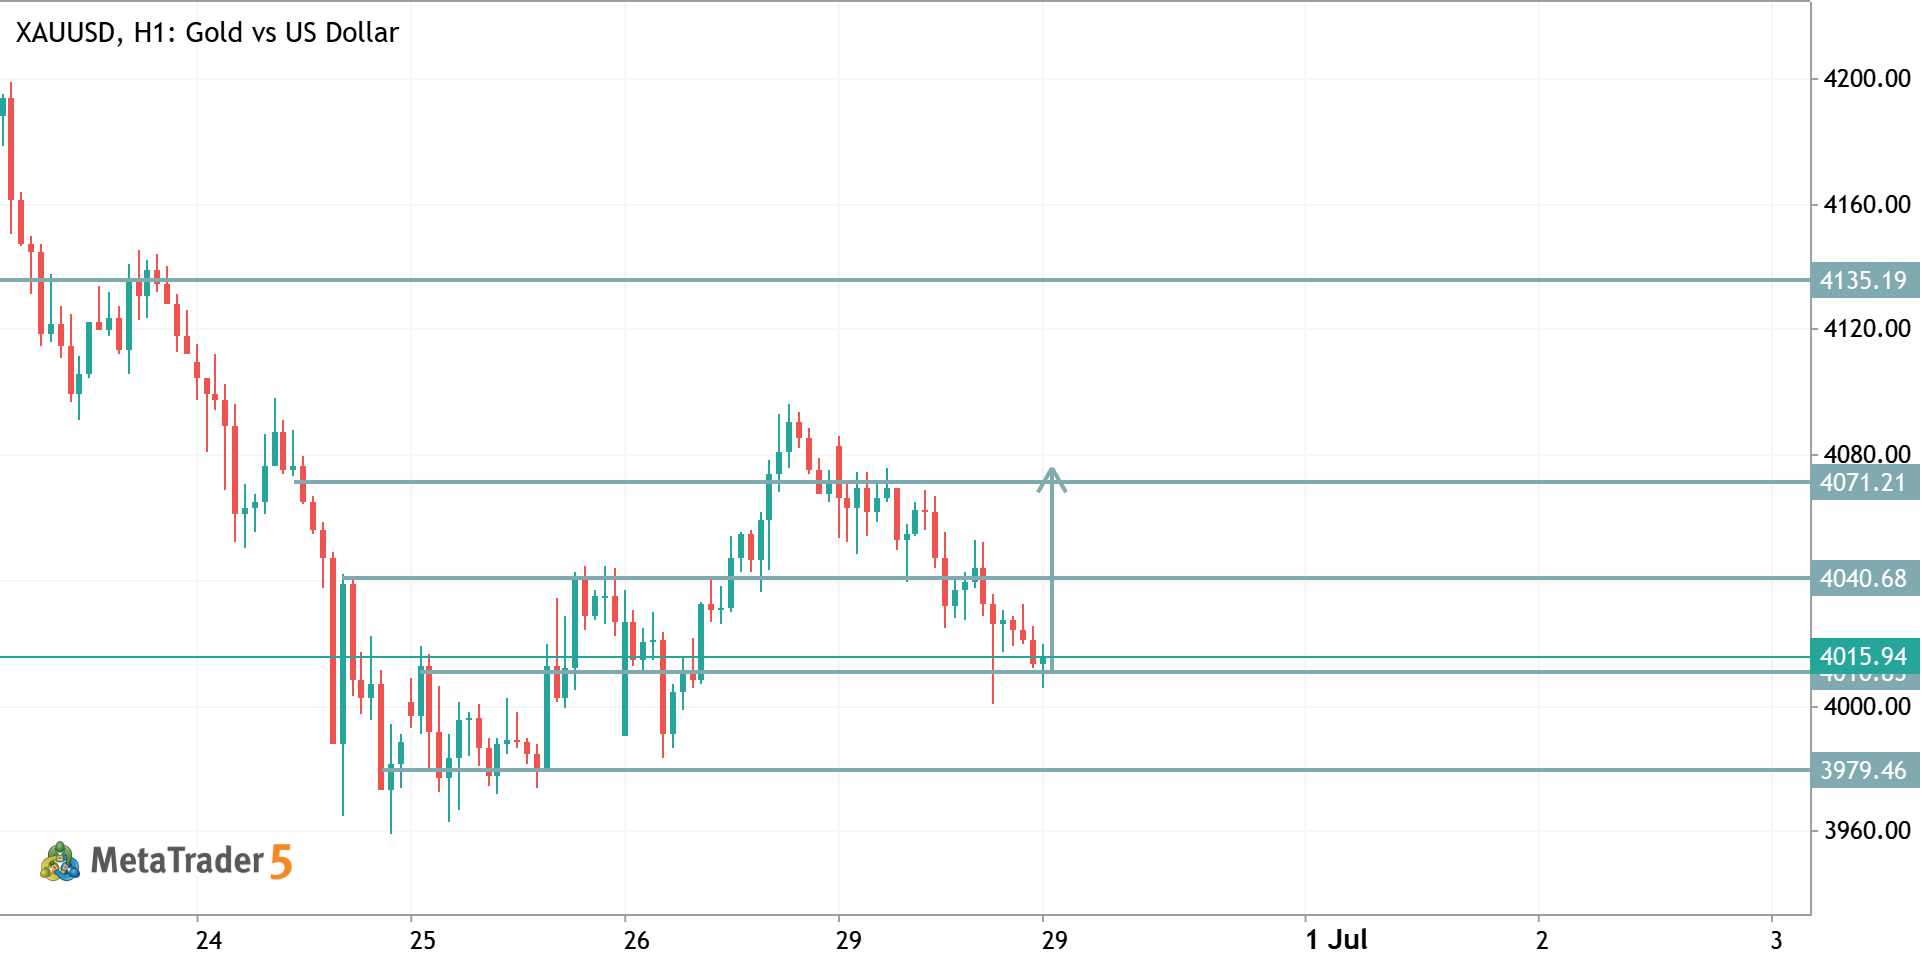
XAUUSD (Gold) – H1 Trade Analysis The overall trend remains bearish , but price is currently testing a key support area around 4015 , where buyers have reacted previously. Technical Outlook Trend: Bearish (lower highs and lower lows remain intact). Support: 4015 → 4000 → 3979. Resistance: 4040 → 4071. Price is sitting at a demand zone. A bullish rejection from 4015 could trigger a short-term recovery toward 4040 , with 4071 as the next upside target. A decisive H1 close below 4015 would invalidate the bullish setup and increase the probability of a move toward 4000 and 3979 . Buy Setup Entry: 4015–4020 (after a bullish confirmation candle) Take Profit 1: 4040 Take Profit 2: 4071 Stop Loss: Below 4000 (or below the recent swing low) Bearish Alternative If price closes below 4015 with strong
0
HamadJatoi Hamad Jatoi 2026.06.29 22:02