XAUUSD H1 ANALYSIS XAUUSD Gold vs US Dollar
XAUUSD H1 ANALYSIS
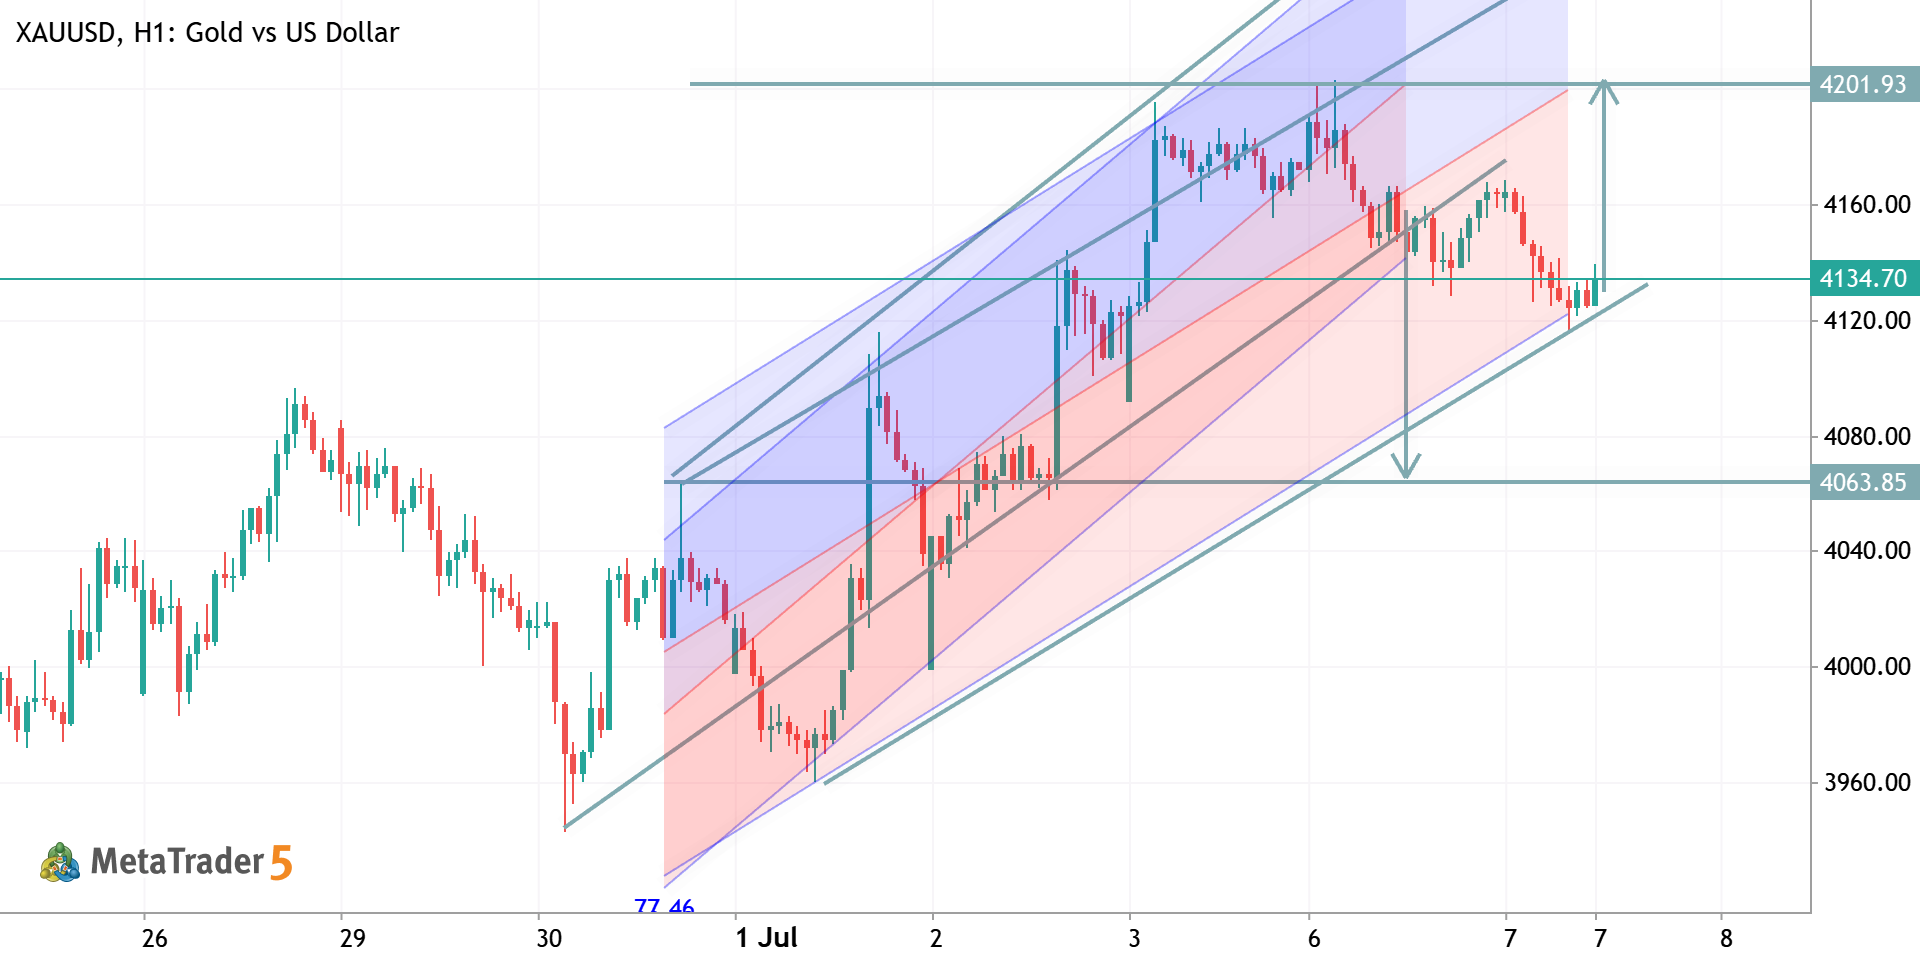
XAUUSD (H1) Analysis Price is testing the lower boundary of the ascending channel, where buyers may step in. A successful bounce could drive the market toward 4200–4210. However, a confirmed break below channel support would weaken the bullish structure and may trigger further downside. Bias: 🟢 Bullish while above channel support. Key Resistance: 4200–4210 Key Support: 4135–4100 Trade Idea: Wait for bullish confirmation from support before looking for long opportunities.
0
Goldanalysisteam Abdul Qayoom 2026.07.07 08:38
GBPUSD TRADE IDEA GBPUSD Short Pound Sterling vs US Dollar
GBPUSD TRADE IDEA
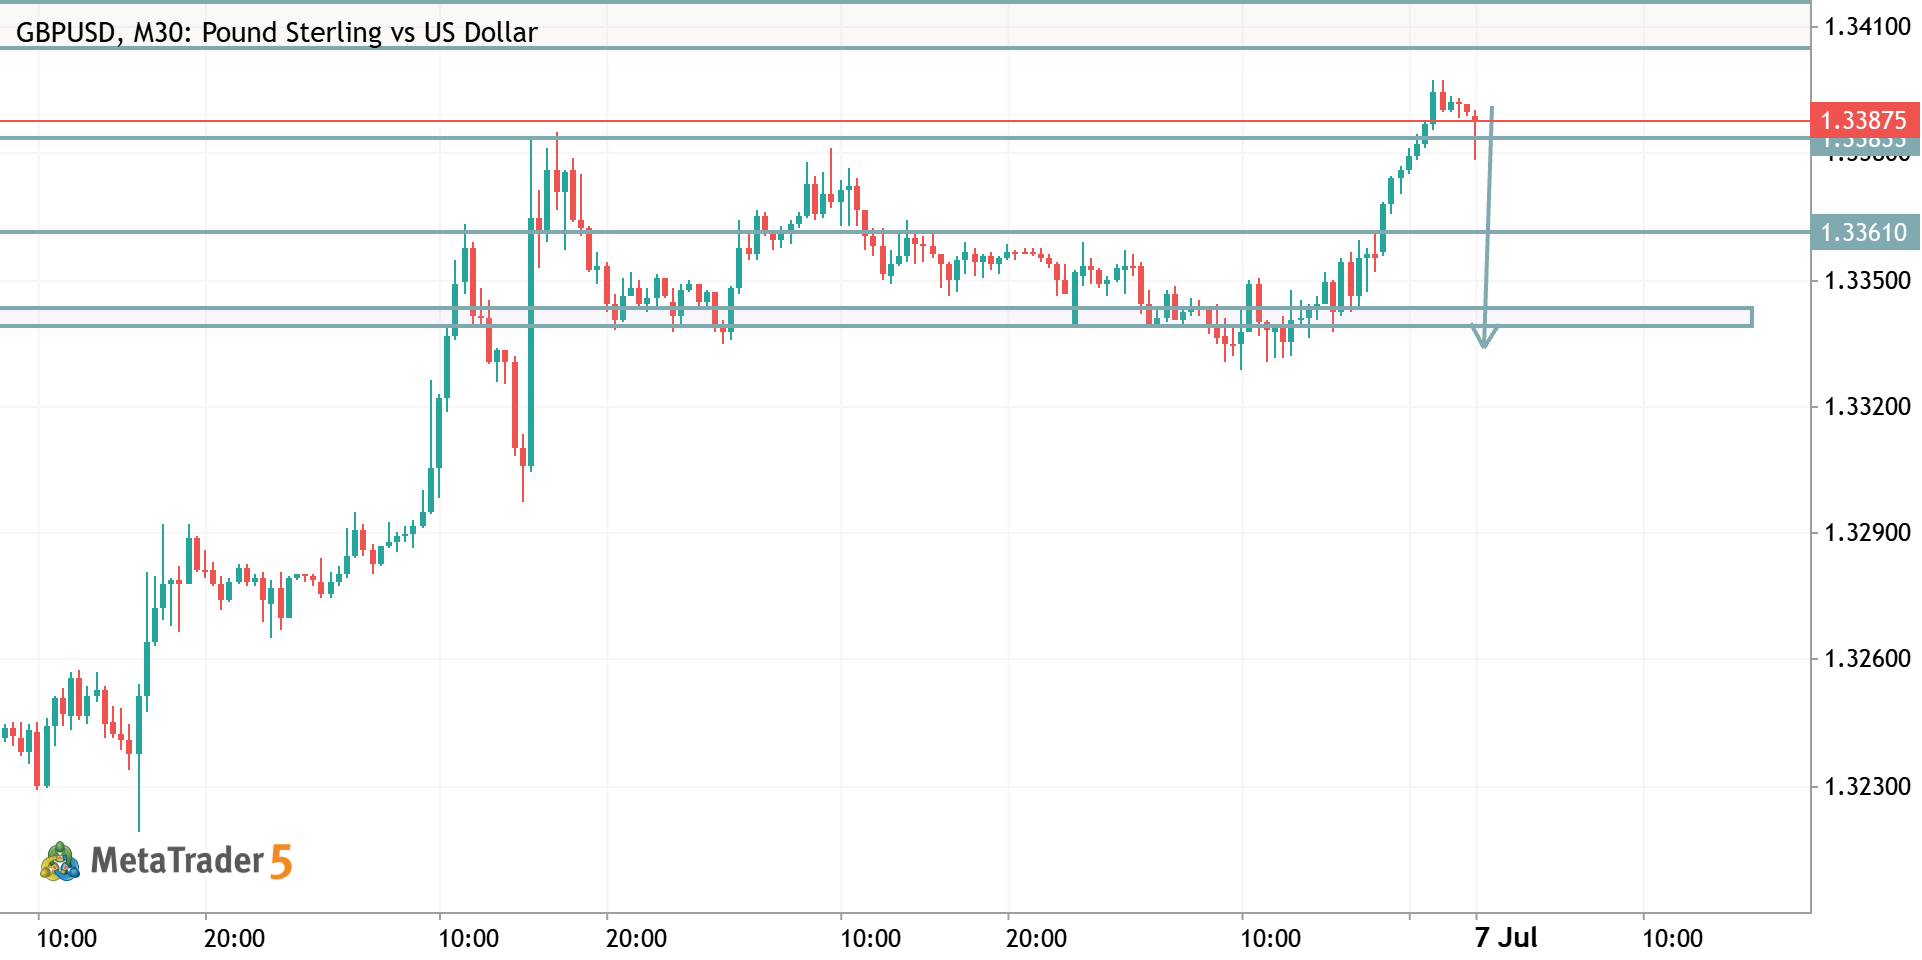
GBP/USD (M30) Trade Setup 🔴 Short (Sell) Entry Entry: 1.3385 – 1.3392 Stop Loss: 1.3408 Take Profit 1: 1.3361 Take Profit 2: 1.3345 Take Profit 3: 1.3335 Confirmation: Wait for a bearish rejection candle or bearish engulfing pattern at the resistance zone before entering. 🟢 Buy Entry Buy only if price retraces into support . Entry: 1.3335 – 1.3342 Stop Loss: 1.3320 Take Profit 1: 1.3361 Take Profit 2: 1.3383 Take Profit 3: 1.3390 Alternative Buy: If price closes strongly above 1.3395 and then retests it as support, look for buy confirmations targeting 1.3410+ . Current Bias: Sell from resistance has the higher probability until 1.3395 is broken decisively.
1
HamadJatoi Hamad Jatoi 2026.07.06 21:20
BTCUSDT — Long at Demand Rejection [Quantum Algo] BTCUSD Long Bitcoin vs US Dollar
BTCUSDT — Long at Demand Rejection [Quantum Algo]
BTC swept the range lows into 58,434, reclaimed hard, and has been building higher lows back up through the range. Price pulled into a higher demand shelf near 62,600 and held, firing the Buy. This is a continuation long: the sweep-and-reclaim flipped the structure bullish, momentum is carrying, and the play is to buy the shallow pullback into demand and ride the next leg toward the range highs. Why this setup works — three confluences: Demand holding above the reclaim. Since the sweep of the range low, every pullback has been bought at a higher level. Price tapped this demand shelf and held instead of breaking down — the Buy printed on the reaction, with a defined floor to lean risk against rather than chasing the move. Higher-low structure off the sweep. The reclaim of the range low set
0
quantumalgoai Quantum Algo 2026.07.05 15:22
BTCUSDT — Bullish Range Reclaim Forecast [Quantum Algo] BTCUSD Bitcoin vs US Dollar
BTCUSDT — Bullish Range Reclaim Forecast [Quantum Algo]
BTC has been rotating in a well-defined 59K–67K range for weeks. Twice now price has probed below the 59K floor, swept resting liquidity under the range, and snapped straight back inside — the textbook bear-trap signature. Each sweep failed to find continuation sellers, and price is now pushing back into the upper half of the range with momentum turning up. This is a forecast for a bullish continuation: reclaimed support, trapped shorts overhead as fuel, drawing toward the range highs. Why this setup works — three confluences: Double liquidity sweep and reclaim. Two clean stabs below the 59K floor, both rejected and recovered inside the range. When a level gets swept twice with no downside follow-through, it signals the sellers underneath have been absorbed — the stops are taken and the
0
quantumalgoai Quantum Algo 2026.07.05 14:01
Avesome Oscillator - traditional general approach USDBRL US Dollar vs Brazilian Real
Avesome Oscillator - traditional general approach
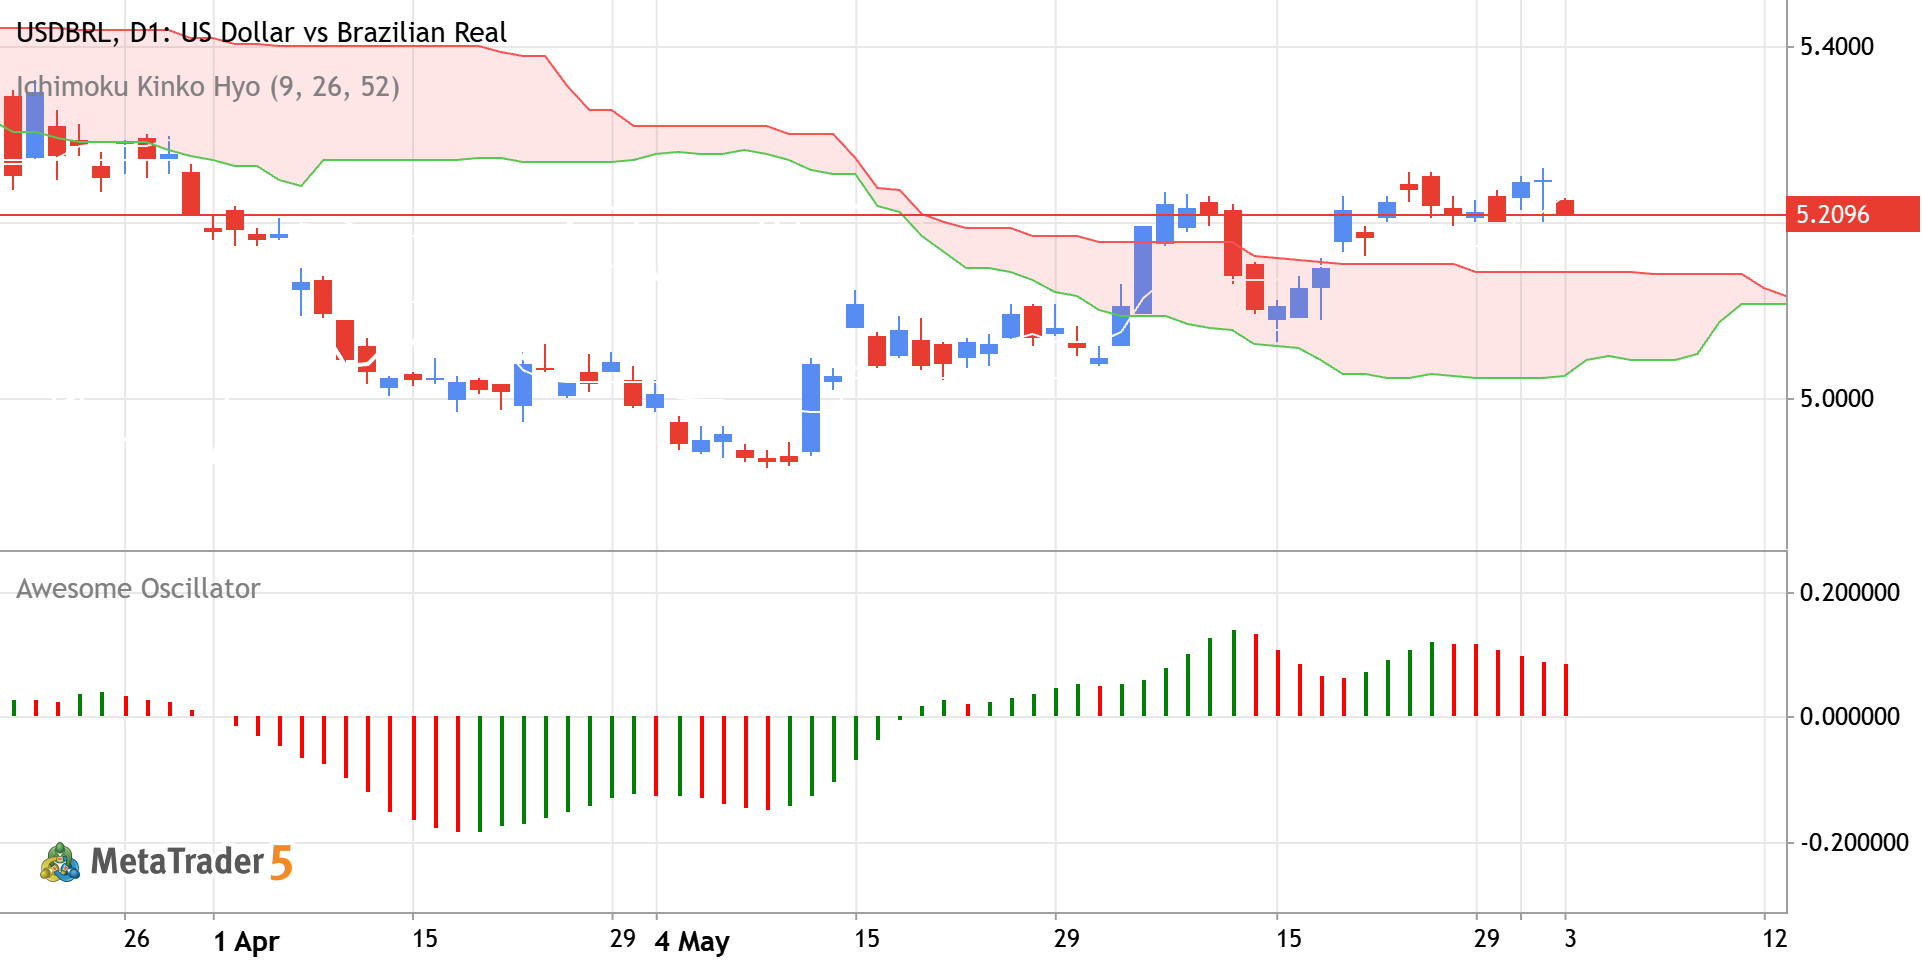
Awesome Oscillator (AO) is a momentum indicator that reflects market trend changes by comparing recent market velocity with historical velocity. The traditional trading approach focuses on capturing macro-driven trends and avoiding false breakouts caused by the pair's typical high volatility. Zero-Line Crossover This is the simplest trend-following signal indicating a shift in market direction. Bullish Signal (Buy): AO crosses from below zero to above zero. Bearish Signal (Sell): AO crosses from above zero to below zero. Apply Filter It can be 200-SMA or Ichimoku cloud for example. Only look for Buy signals if the price is above the 200-SMA or Ichimoku cloud. Only look for Sell signals if the price is below the 200-SMA or Ichimoku cloud. Best used on daily (D1) charts to capture large
0
newdigital Sergey Golubev 2026.07.05 05:04
XAUUSD — Short at Supply Rejection [Quantum Algo] XAUUSD Short Gold vs US Dollar
XAUUSD — Short at Supply Rejection [Quantum Algo]
Gold bounced off the 4,155 session low and rallied back up into an intraday supply pocket near 4,176 — the same area that capped the earlier swings around 4,179–4,180. Price pushed into the zone and stalled, firing the Sell. This is a scalp short off supply: fade the recovery into resistance, target the recent demand shelf where buyers last stepped in. Why this setup works — three confluences: Supply rejection at intraday resistance. The 4,176–4,180 band has repeatedly capped price through the session. The recovery ran straight back into it and stalled — the reaction printed on the tap, giving a tight, defined ceiling to lean risk against. Recovery into resistance, not breakout. The move off 4,155 is a corrective bounce back to the top of the intraday range, not a trend break. Selling into
0
quantumalgoai Quantum Algo 2026.07.04 16:54
SHIP - Long-Term Technical Forecast SHIP Seanergy Maritime Holdings Corp. - Common Stock
SHIP - Long-Term Technical Forecast
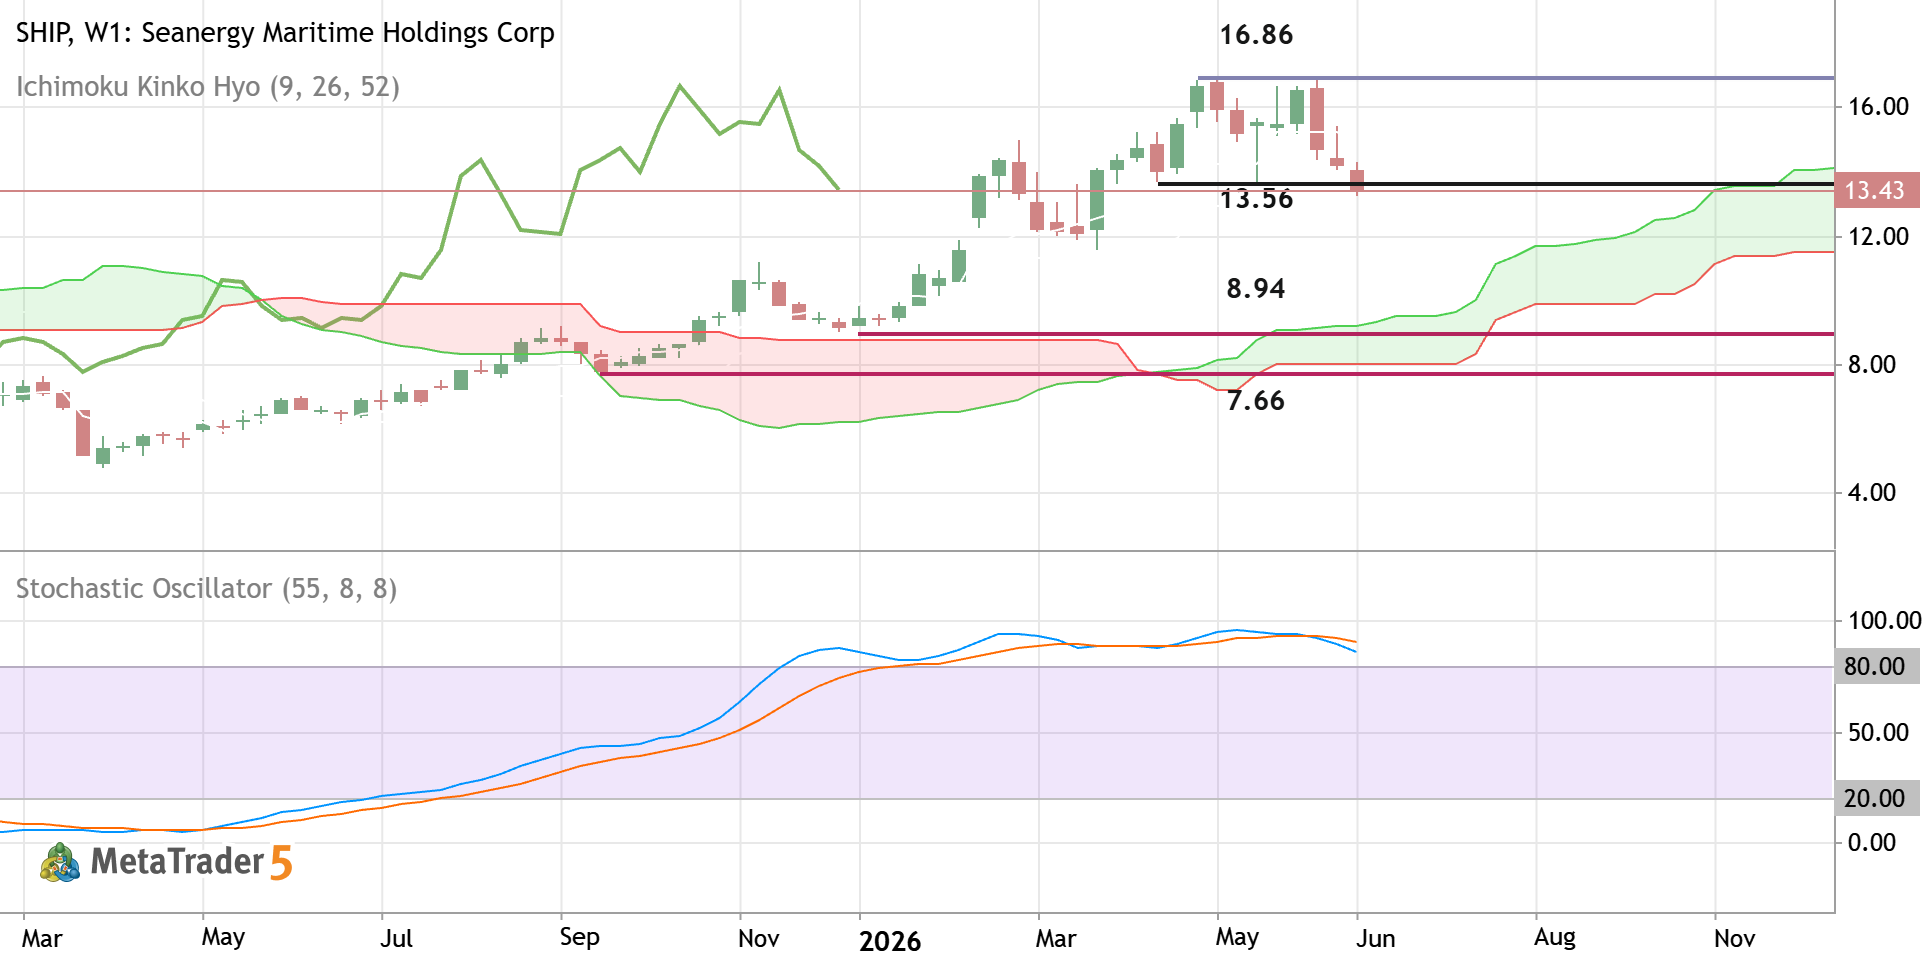
The weekly price is located above Ichimoku cloud in the bullish area of the chart. The price was bounced from support level at 16.86 to below for trying to break the next support level at 13.56 for the secondary correction to be started. If the price breaks the level at 13.56 to below on weekly close bar so we may see the secondary correction within the primary bullish market condition. If the price crosses 8.94 support to below together with the next support level at 7.66 so the primary bearish reversal will be started. Alternatively, the price will be on ranging to be near and above Ichimoku cloud waiting for the direction of the strong trend to be started. Trading Summary : ranging to the secondary correction
0
newdigital Sergey Golubev 2026.07.04 08:27
BGC - Daily Trading Forecast BGC BGC Group, Inc. - Class A Common Stock
BGC - Daily Trading Forecast
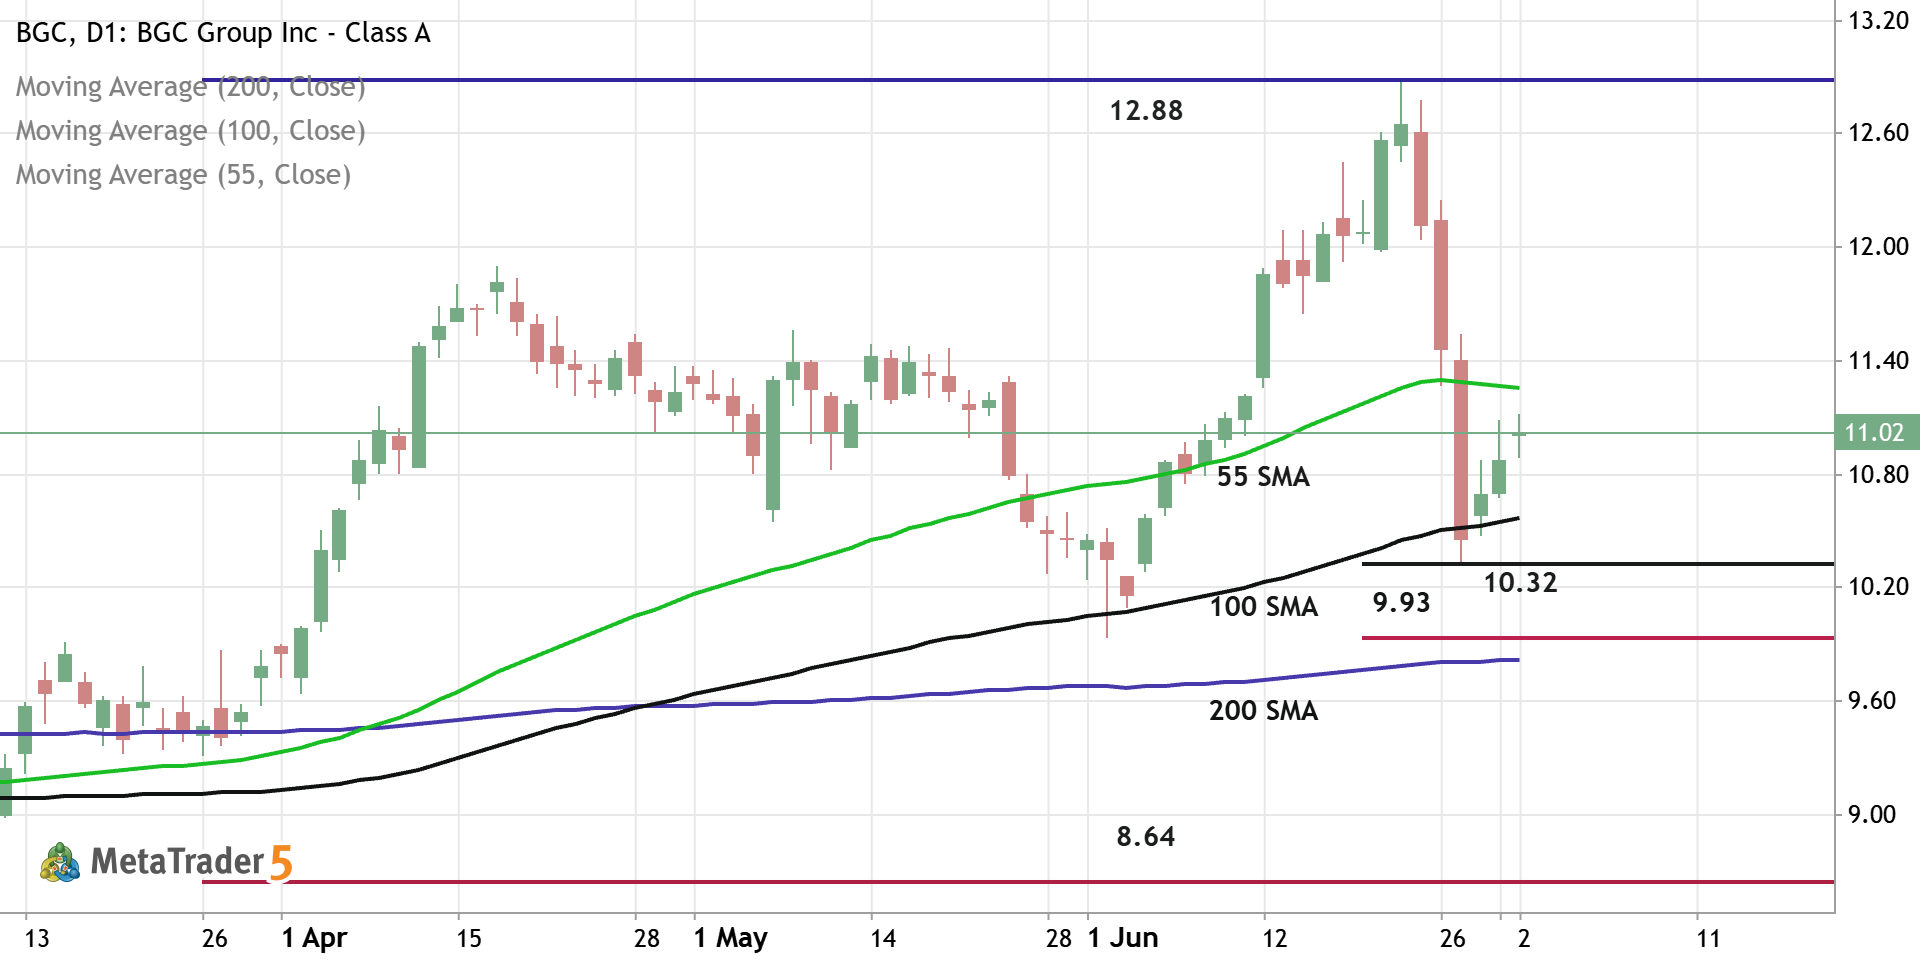
Daily price is located above 200-SMA in the bullish area of the chart. The price was bounced from support level at 10.32 and from 100-SMA to above for the pimary bullish trend to be continuing. If the price breaks 55-SMA to above so the strong bullish trend will be resumed with 12.88 resistance as the global possible target. If the price crosses support level at 9.93 together with 200-SMA to below so the primary bearish reversal will be started with 8.64 support level as the global possible target. Aternatively, the price will be on secondary ranging to be near and above 200 SMA waiting for direction. Trading Summary : waiting for direction
0
newdigital Sergey Golubev 2026.07.04 07:38
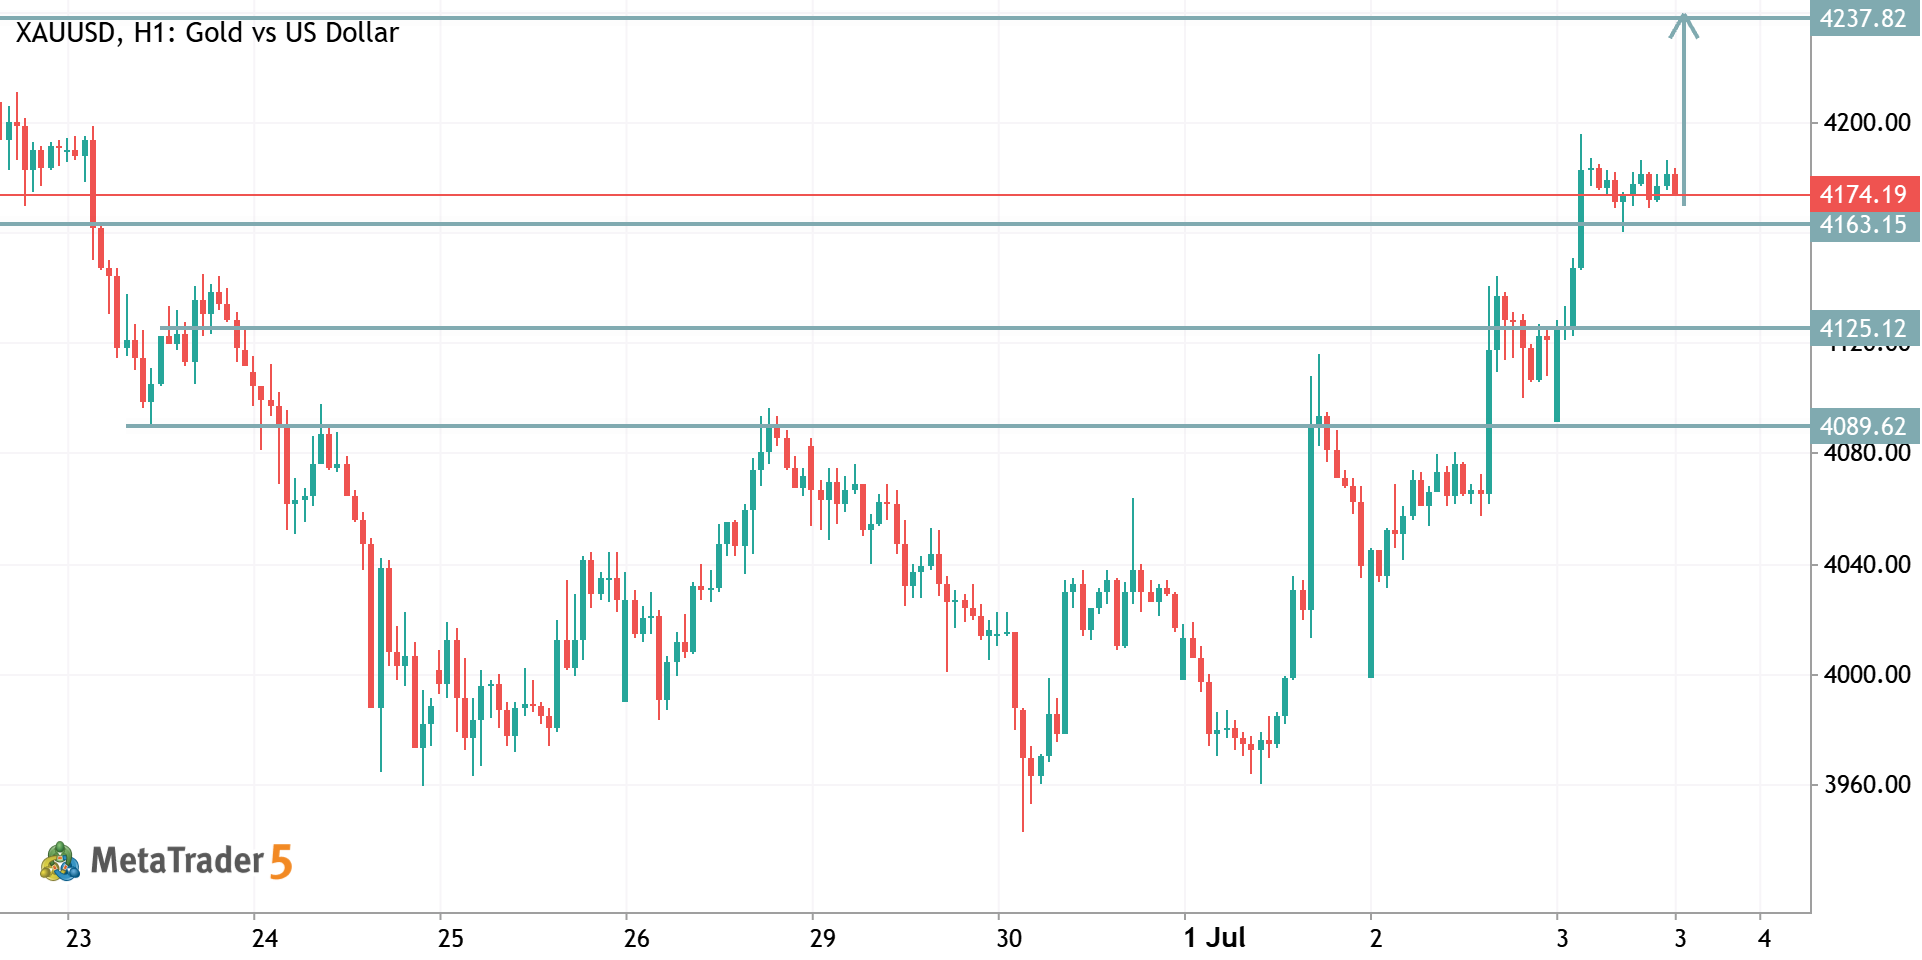
XAUUSD TRADE IDEA XAUUSD Long Gold vs US Dollar
XAUUSD TRADE IDEA
XAUUSD (Gold) – H1 Trade Analysis Trend: Bullish. Price has formed a strong impulsive move from the 3960 area and is making higher highs and higher lows. Current Resistance: 4173.68 (price is consolidating just below this level). Support Levels: 4165.15 – Immediate support. 4125.12 – Strong intraday support. 4089.62 – Major bullish support. Bullish Scenario (Higher Probability) Price is holding above 4165.15 , showing strength after the breakout. A sustained move above 4173.68 could trigger another bullish leg. Target 1: 4237.82 If momentum remains strong, price could extend beyond this resistance. Buy Idea Entry: Above 4173.68 after a confirmed candle close or on a retest. Stop Loss: Below 4165.15 (or below the most recent swing low for a wider stop). Take Profit: 4237.82 Bearish Scenario
1
HamadJatoi Hamad Jatoi 2026.07.03 12:28