
PYPL
#360
PayPal Holdings, Inc. - Common Stock
47.6 5 USD
+0.03%
セクター: 金融
ベース: USD
利益通貨: USD
日中レンジ
1年のレンジ
1日の変化
+2.87%
月次変化
+12.49%
6か月変化
-17.47%
1年の変化
-35.43%
以前の終値
46.3 2
Open
47.6 5
安値
47.6 5
High
47.6 5
ボリューム
399
Financials
値 202020212022202320242025 Current
Key stats
Valuation ratios
Profitability ratios
Liquidity ratios
Solvency ratios
Per share metrics
ニュース
原油価格下落でS&P500指数が史上最高値を更新:投資家心理は改善、恐怖指数は「貪欲」ゾーンにとどまる
イラン戦争再燃でダウ平均株価が550ポイント下落:投資家心理は悪化したが、恐怖指数は依然として「貪欲」ゾーンに留まる
火曜日に注目すべき3つの株式:ファイザー、ピンタレスト、そして3つの銘柄
マイケル・バリーがまたもや「ビッグ・ショート」を成功させた ― 歴史的な半導体株の上昇相場がついに崩壊
ピーター・ティールがアルゼンチンに1200万ドルの豪邸を購入、一方ハビエル・ミレイはシリコンバレーにアプローチ:報道
先週投資家が注目した5つの株式:アマゾン、メタ、リーバイ・ストラウス、パランティア、テスラ
7ヶ月後に2026年上院議員、株式を売却:売却銘柄とは?
トランプ顧問のデビッド・サックス、イラン情勢の悪化は「壊滅的な事態」を招く可能性があると警告し、米国は「勝利を宣言して撤退すべきだ」と訴え
PayPay IPO、2日目の取引で18%急騰、ARKが株式を購入
PayPayのIPO、Nasdaq上場初日に19%急騰、SoftBank支援のフィンテック企業の評価額は147億ドルに
ペイパル・ホールディングス、Wolfe FinTechフォーラムで戦略的焦点と課題を語る
チャート&アイデア
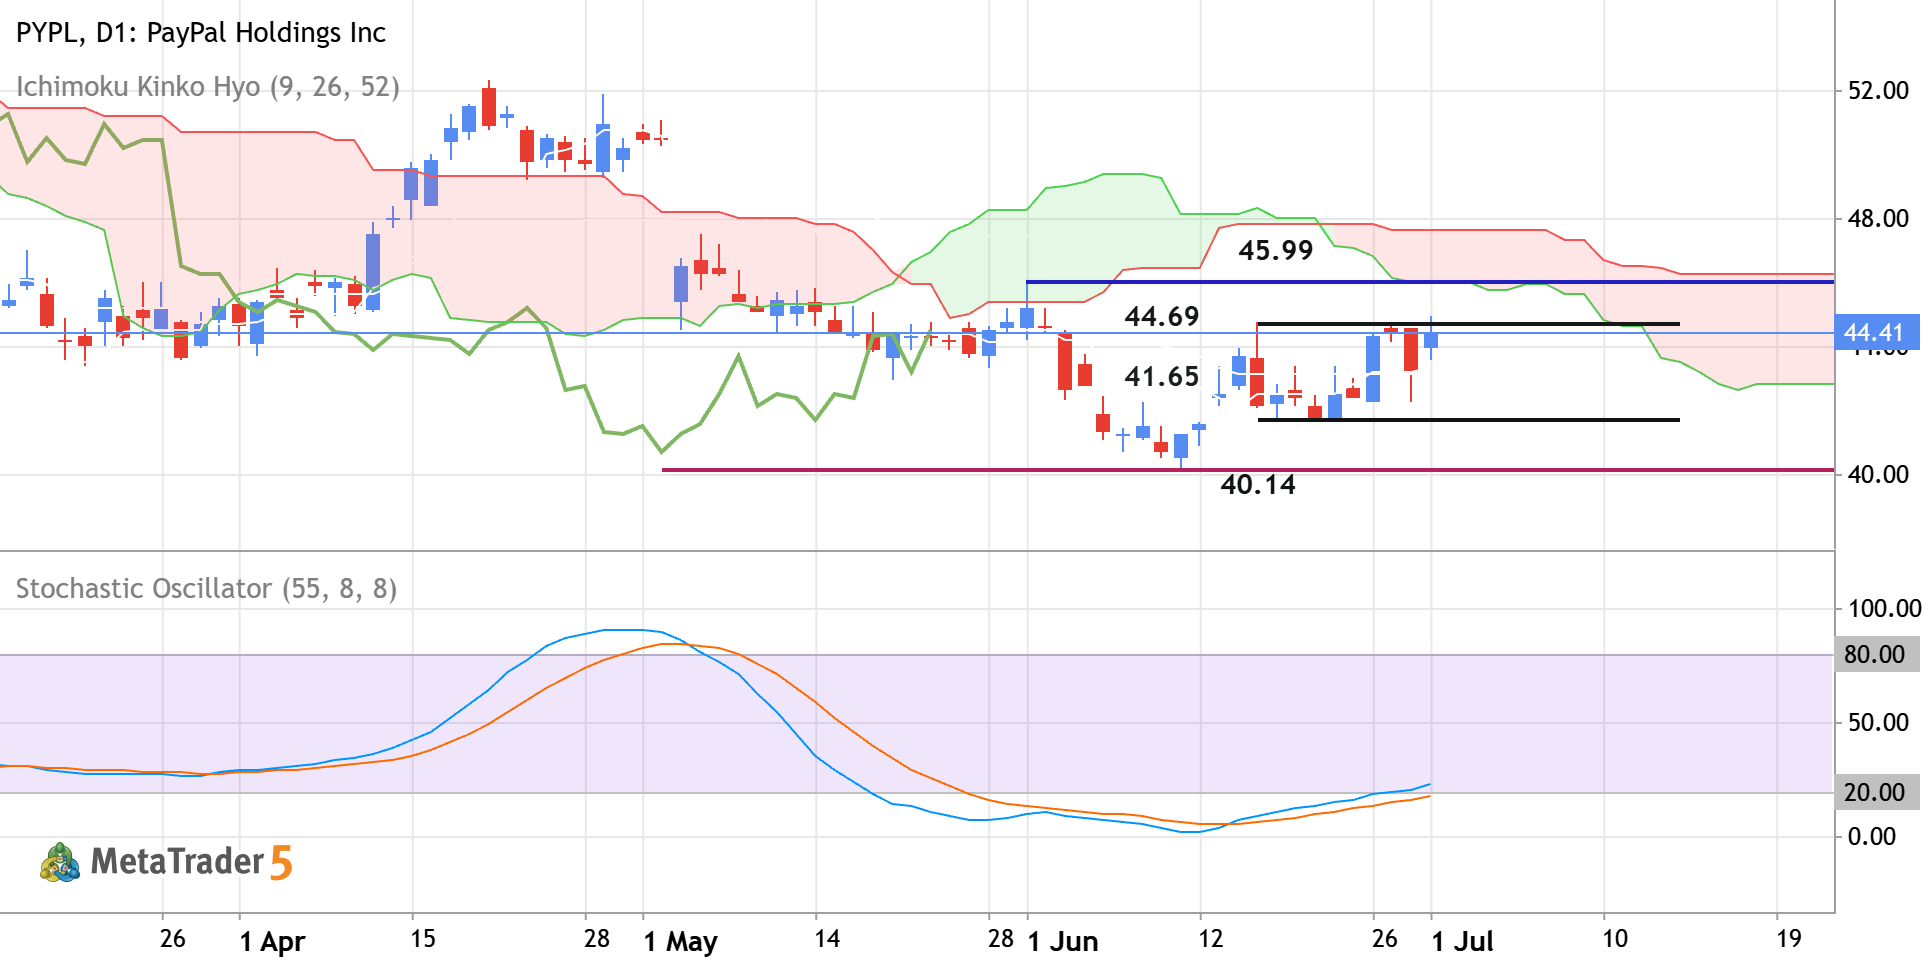
PYPL - Daily Rally to the Possible Bullish Reversal
Daily price is located near and below Ichimoku cloud in the bearish area of the chart. The price was blinced from resistance levels at 40.14 and 41.65 to above for the bear market rally to be started. The Stochastic oscillator is showing the possible uptrend in the near future, and Chinkou Span line is crossing historical price but on open daily bar for now. If the price breaks the resistance level at 44.69 to the 45.99 to above so the primary bullish reversal will be started. If the price crosses support at 41.65 together with support level at 40.14 to below so the primary bearish trend will be resumed. Alternatively, the price will be on secondary ranging within the primary bearish trend to be near and below Ichimoku cloud waiting for direction of the strong trend to be started. Trading
0 

The PYPL doesn’t have other trading ideas at this time
Browse ready-made trading ideas or select a symbol and create your own
Go to Charts and Trading Ideas