
PYPL
#360
PayPal Holdings, Inc. - Common Stock
47.6 5 USD
+0.03%
Setor: Finanças
Base: USD
Moeda do lucro: USD
Faixa diária
Faixa anual
Mudança diária
+2.87%
Mudança mensal
+12.49%
Mudança em 6 meses
-17.47%
Mudança anual
-35.43%
Fechamento anterior
46.3 2
Open
47.6 5
Mínimo
47.6 5
High
47.6 5
Volume
399
Financials
Valor 202020212022202320242025 Current
Key stats
Valuation ratios
Profitability ratios
Liquidity ratios
Solvency ratios
Per share metrics
Notícias
Piper Sandler elege vencedores em pagamentos e finanças do consumidor
Diretor financeiro do PayPal descarta US$ 254.537 em ações para fins fiscais
Freedom Broker reduz preço-alvo do PayPal para US$ 60 por pressão nas margens
Ação da PayPal cai 36% no ano e negocia perto da mínima de 52 semanas
Usuários do PayPal nos EUA já podem pagar em comerciantes do WeChat na China
Burry compra Lululemon, aumenta posições em ações desvalorizadas e alerta para bolha de IA
Michael Burry amplia posições em MercadoLibre, Adobe, PayPal e Lululemon
Ações do PayPal reduzem perdas após parceria com Anthropic
PayPal vai abrir mão de US$ 30 milhões em taxas para pequenas empresas em acordo com o DOJ
PayPal resolve caso de discriminação e lança programa de US$ 30 mi para pequenas empresas
Truist reduz preço-alvo do PayPal por gastos com fidelidade e TPV fraco
Gráficos e ideias
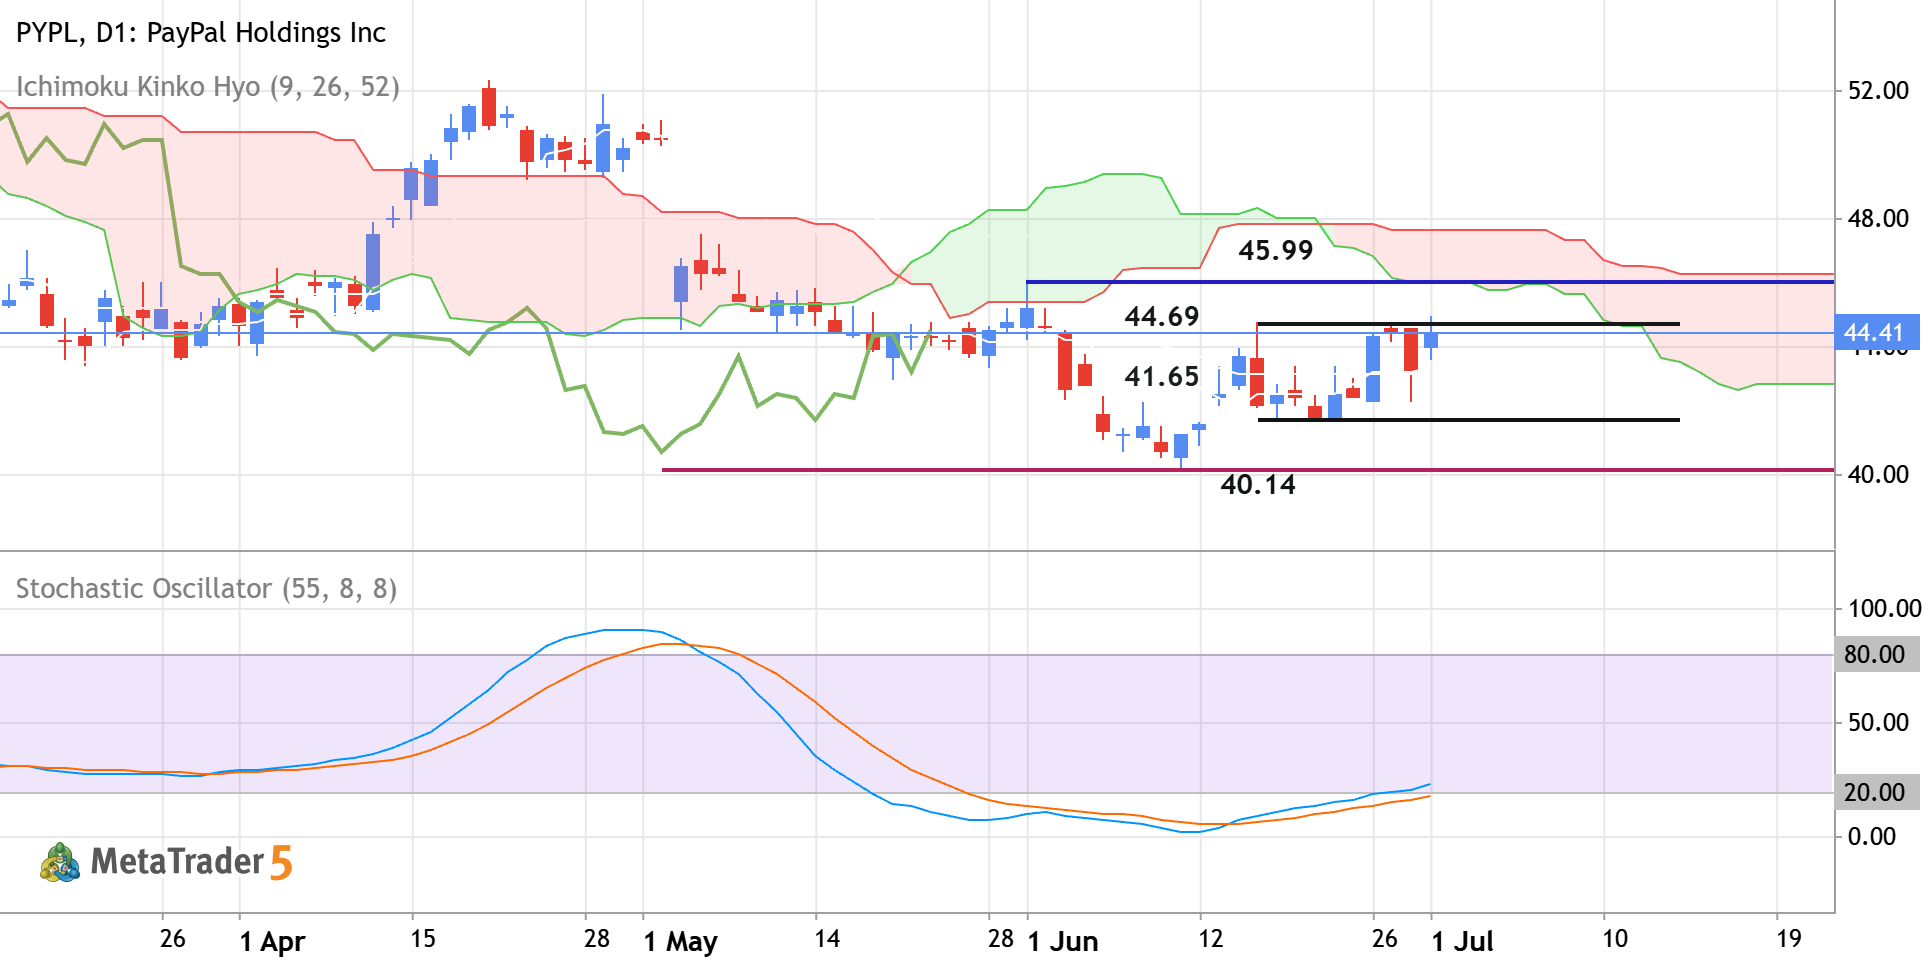
PYPL - Daily Rally to the Possible Bullish Reversal
Daily price is located near and below Ichimoku cloud in the bearish area of the chart. The price was blinced from resistance levels at 40.14 and 41.65 to above for the bear market rally to be started. The Stochastic oscillator is showing the possible uptrend in the near future, and Chinkou Span line is crossing historical price but on open daily bar for now. If the price breaks the resistance level at 44.69 to the 45.99 to above so the primary bullish reversal will be started. If the price crosses support at 41.65 together with support level at 40.14 to below so the primary bearish trend will be resumed. Alternatively, the price will be on secondary ranging within the primary bearish trend to be near and below Ichimoku cloud waiting for direction of the strong trend to be started. Trading
0 

The PYPL doesn’t have other trading ideas at this time
Browse ready-made trading ideas or select a symbol and create your own
Go to Charts and Trading Ideas