
PYPL
#360
PayPal Holdings, Inc. - Common Stock
47.6 5 USD
+0.03%
Sektör: Finansal
Baz: USD
Kar Para Birimi: USD
Günlük Aralık
Yıllık Aralık
Günlük Değişim
+2.87%
Aylık Değişim
+12.49%
6 Aylık Değişim
-17.47%
Yıllık Değişim
-35.43%
Önceki Kapanış
46.3 2
Open
47.6 5
Düşük
47.6 5
High
47.6 5
Hacim
399
Financials
Değer 202020212022202320242025 Current
Key stats
Valuation ratios
Profitability ratios
Liquidity ratios
Solvency ratios
Per share metrics
Haberler
Piper Sandler çarpanlar sıfırlanırken ödeme ve tüketici finansında kazananları seçti
PayPal CFO’su vergi için 254.537 dolar değerinde hisse sattı
Freedom Broker, PayPal hissesi için hedef fiyatı 60 dolara düşürdü
ABD’deki PayPal kullanıcıları artık Çin’de WeChat üyelerinden alışveriş yapabilecek
Burry değer kaybeden hisseleri artırıyor, Lululemon alıyor, yapay zeka balonu konusunda uyarıyor
Michael Burry MercadoLibre, Adobe, PayPal ve Lululemon’daki Pozisyonlarını Artırdı
Anthropic küçük işletmeler için Claude’u yazılım entegrasyonlarıyla tanıttı
PayPal hisseleri Anthropic ortaklığı sonrası düşüşü sınırladı
PayPal küçük işletmeler için 30 milyon dolarlık ücretten feragat edecek
PayPal ayrımcılık davasını sonuçlandırdı, 30 milyon dolarlık küçük işletme programı başlattı
PayPal ayrımcılık davasını kapattı, 30 milyon dolarlık program başlattı
Grafikler ve Fikirler
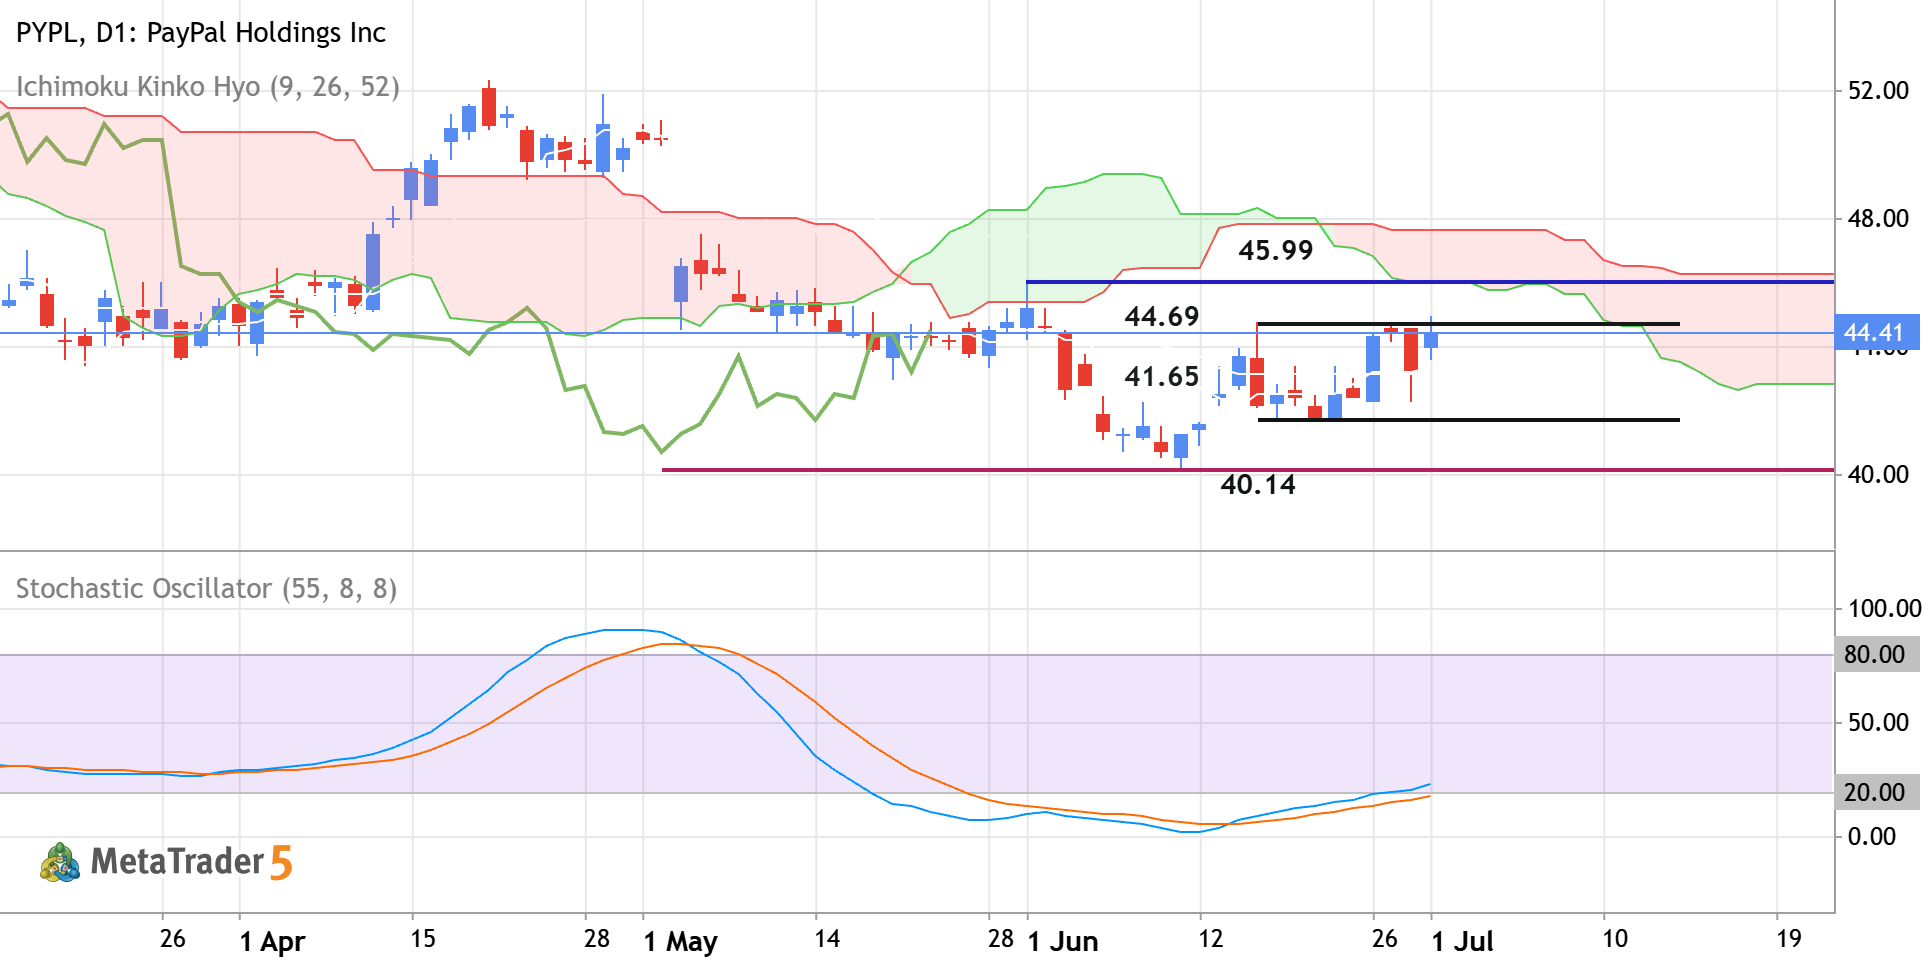
PYPL - Daily Rally to the Possible Bullish Reversal
Daily price is located near and below Ichimoku cloud in the bearish area of the chart. The price was blinced from resistance levels at 40.14 and 41.65 to above for the bear market rally to be started. The Stochastic oscillator is showing the possible uptrend in the near future, and Chinkou Span line is crossing historical price but on open daily bar for now. If the price breaks the resistance level at 44.69 to the 45.99 to above so the primary bullish reversal will be started. If the price crosses support at 41.65 together with support level at 40.14 to below so the primary bearish trend will be resumed. Alternatively, the price will be on secondary ranging within the primary bearish trend to be near and below Ichimoku cloud waiting for direction of the strong trend to be started. Trading
0 

The PYPL doesn’t have other trading ideas at this time
Browse ready-made trading ideas or select a symbol and create your own
Go to Charts and Trading Ideas