
PYPL
#360
PayPal Holdings, Inc. - Common Stock
47.6 5 USD
+0.03%
Sector: Finanzas
Básica: USD
Divisa de beneficio: USD
Rango diario
Rango anual
Cambio diario
+2.87%
Variación mensual
+12.49%
Variación en los últimos 6 meses
-17.47%
Cambio anual
-35.43%
Cierres anteriores
46.3 2
Open
47.6 5
Mínimo
47.6 5
High
47.6 5
Volumen
399
Financials
Valor 202020212022202320242025 Current
Key stats
Valuation ratios
Profitability ratios
Liquidity ratios
Solvency ratios
Per share metrics
Noticias
Piper Sandler elige ganadores en pagos y financiación al consumo
Freedom Broker recorta el precio objetivo de la acción de PayPal a 60 dólares por presión en márgenes
Los usuarios de PayPal en EE.UU. ya pueden pagar en comercios de WeChat en China
Burry compra Lululemon y advierte sobre una burbuja en la IA
Michael Burry amplía posiciones en MercadoLibre, Adobe, PayPal y Lululemon
Anthropic lanza Claude para pequeñas empresas con integraciones de software
Las acciones de PayPal recortan pérdidas tras alianza con Anthropic
PayPal condonará 30 millones en comisiones a pymes en acuerdo con el DOJ
PayPal llega a un acuerdo por discriminación y lanza un programa de 30.000 millones de dólares para pequeñas empresas
PayPal resuelve caso de discriminación y lanza programa de 30.000 millones de dólares para pequeñas empresas
Truist recorta el precio objetivo de PayPal por gastos en fidelización y débil TPV
Gráficos e ideas
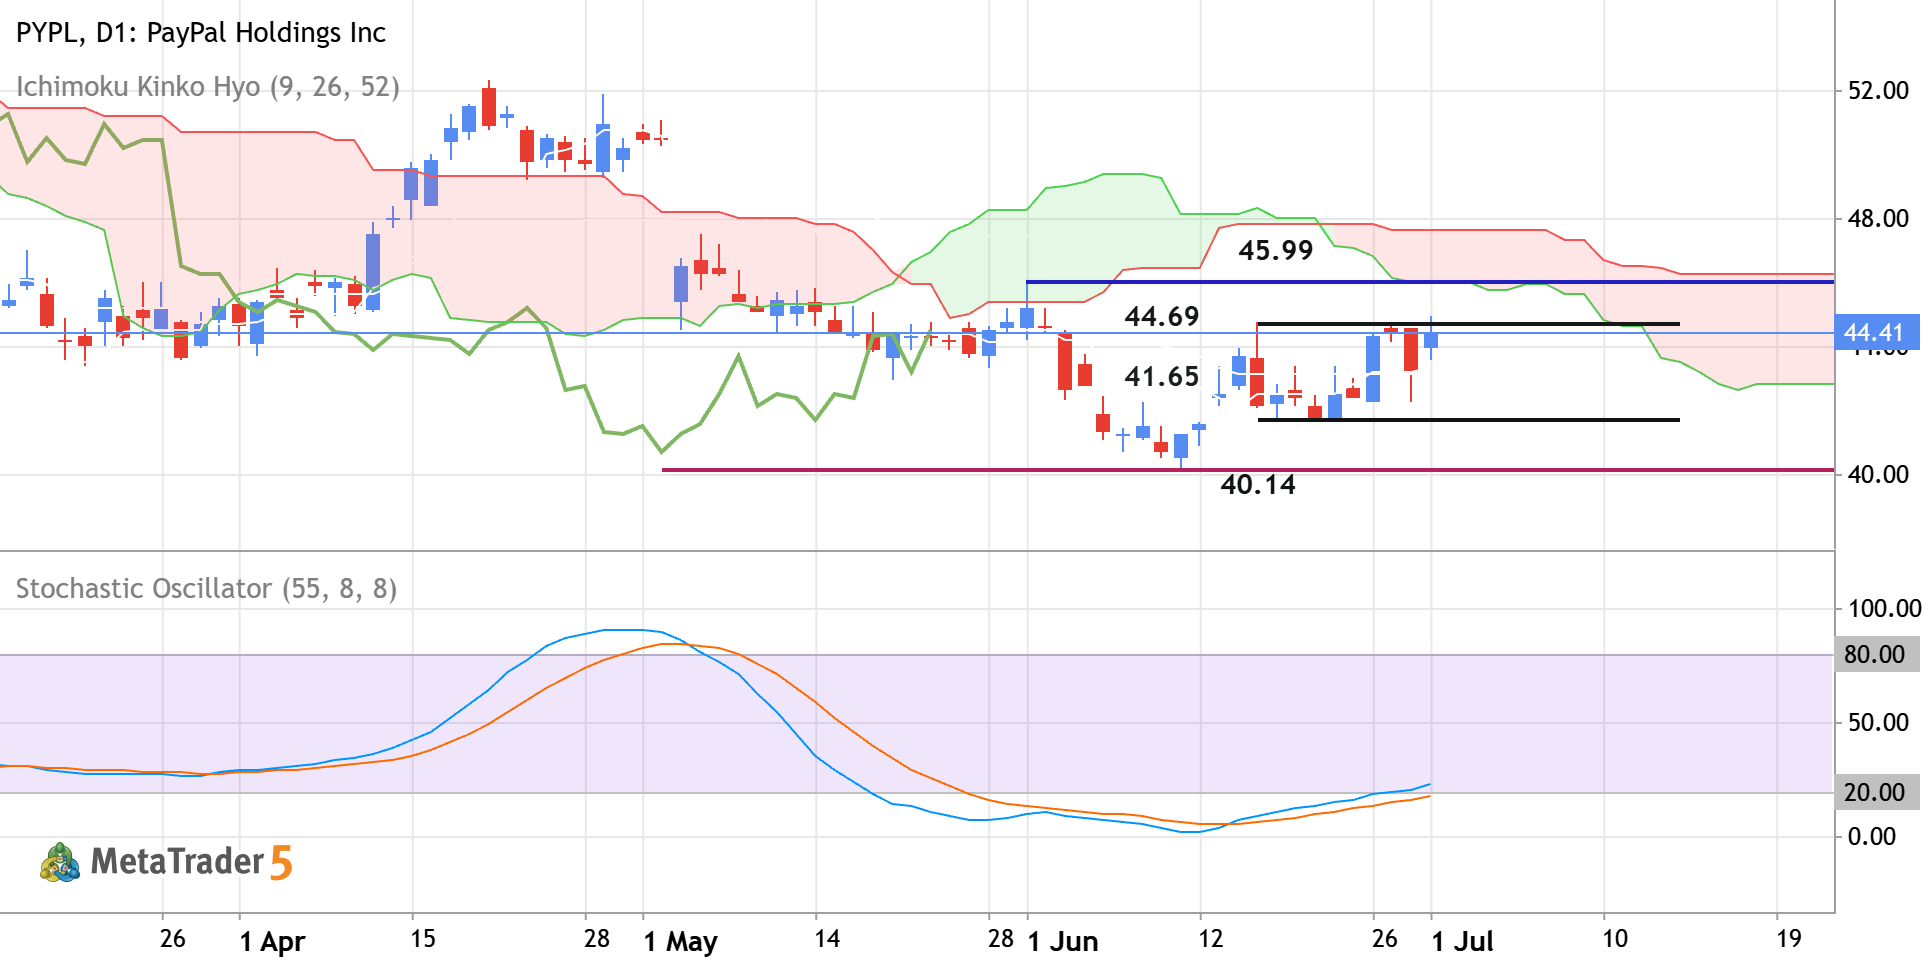
PYPL - Daily Rally to the Possible Bullish Reversal
Daily price is located near and below Ichimoku cloud in the bearish area of the chart. The price was blinced from resistance levels at 40.14 and 41.65 to above for the bear market rally to be started. The Stochastic oscillator is showing the possible uptrend in the near future, and Chinkou Span line is crossing historical price but on open daily bar for now. If the price breaks the resistance level at 44.69 to the 45.99 to above so the primary bullish reversal will be started. If the price crosses support at 41.65 together with support level at 40.14 to below so the primary bearish trend will be resumed. Alternatively, the price will be on secondary ranging within the primary bearish trend to be near and below Ichimoku cloud waiting for direction of the strong trend to be started. Trading
0 

The PYPL doesn’t have other trading ideas at this time
Browse ready-made trading ideas or select a symbol and create your own
Go to Charts and Trading Ideas